

Briefly: in our opinion, full (300% of the regular position size) speculative short positions in mining stocks are justified from the risk/reward point of view at the moment of publishing this Alert.
If the stock market goes down, gold will go up, right? After all, it is a safe haven asset. Not so fast. Remember the interconnectedness of things.
Just as we saw on Tuesday (Jan. 12), yesterday’s session was relatively calm in gold, silver and mining stocks, so I’ll keep today’s technical comments relatively short. There are two notable things that happened, and they took place in the mining stocks and in the USD Index. Still, let’s start with a quick look at gold and silver.
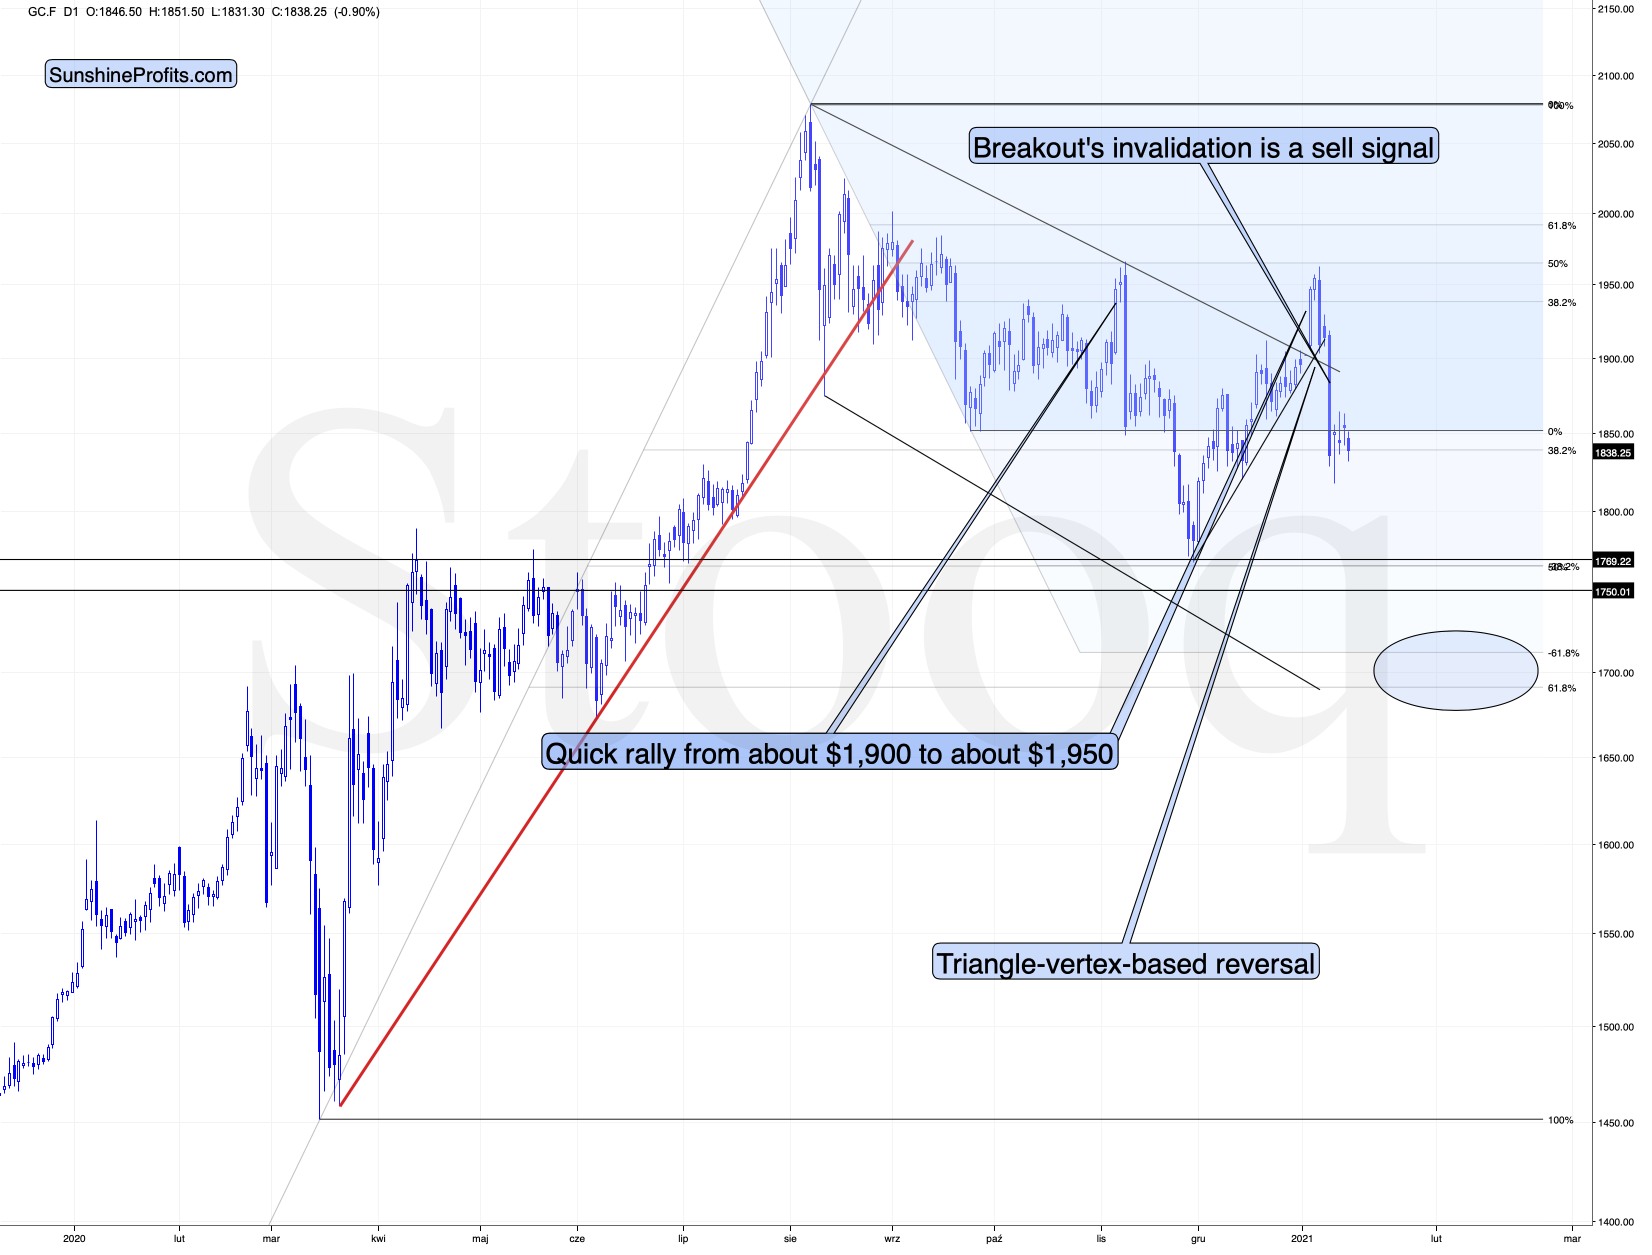
Figure – COMEX Gold Futures
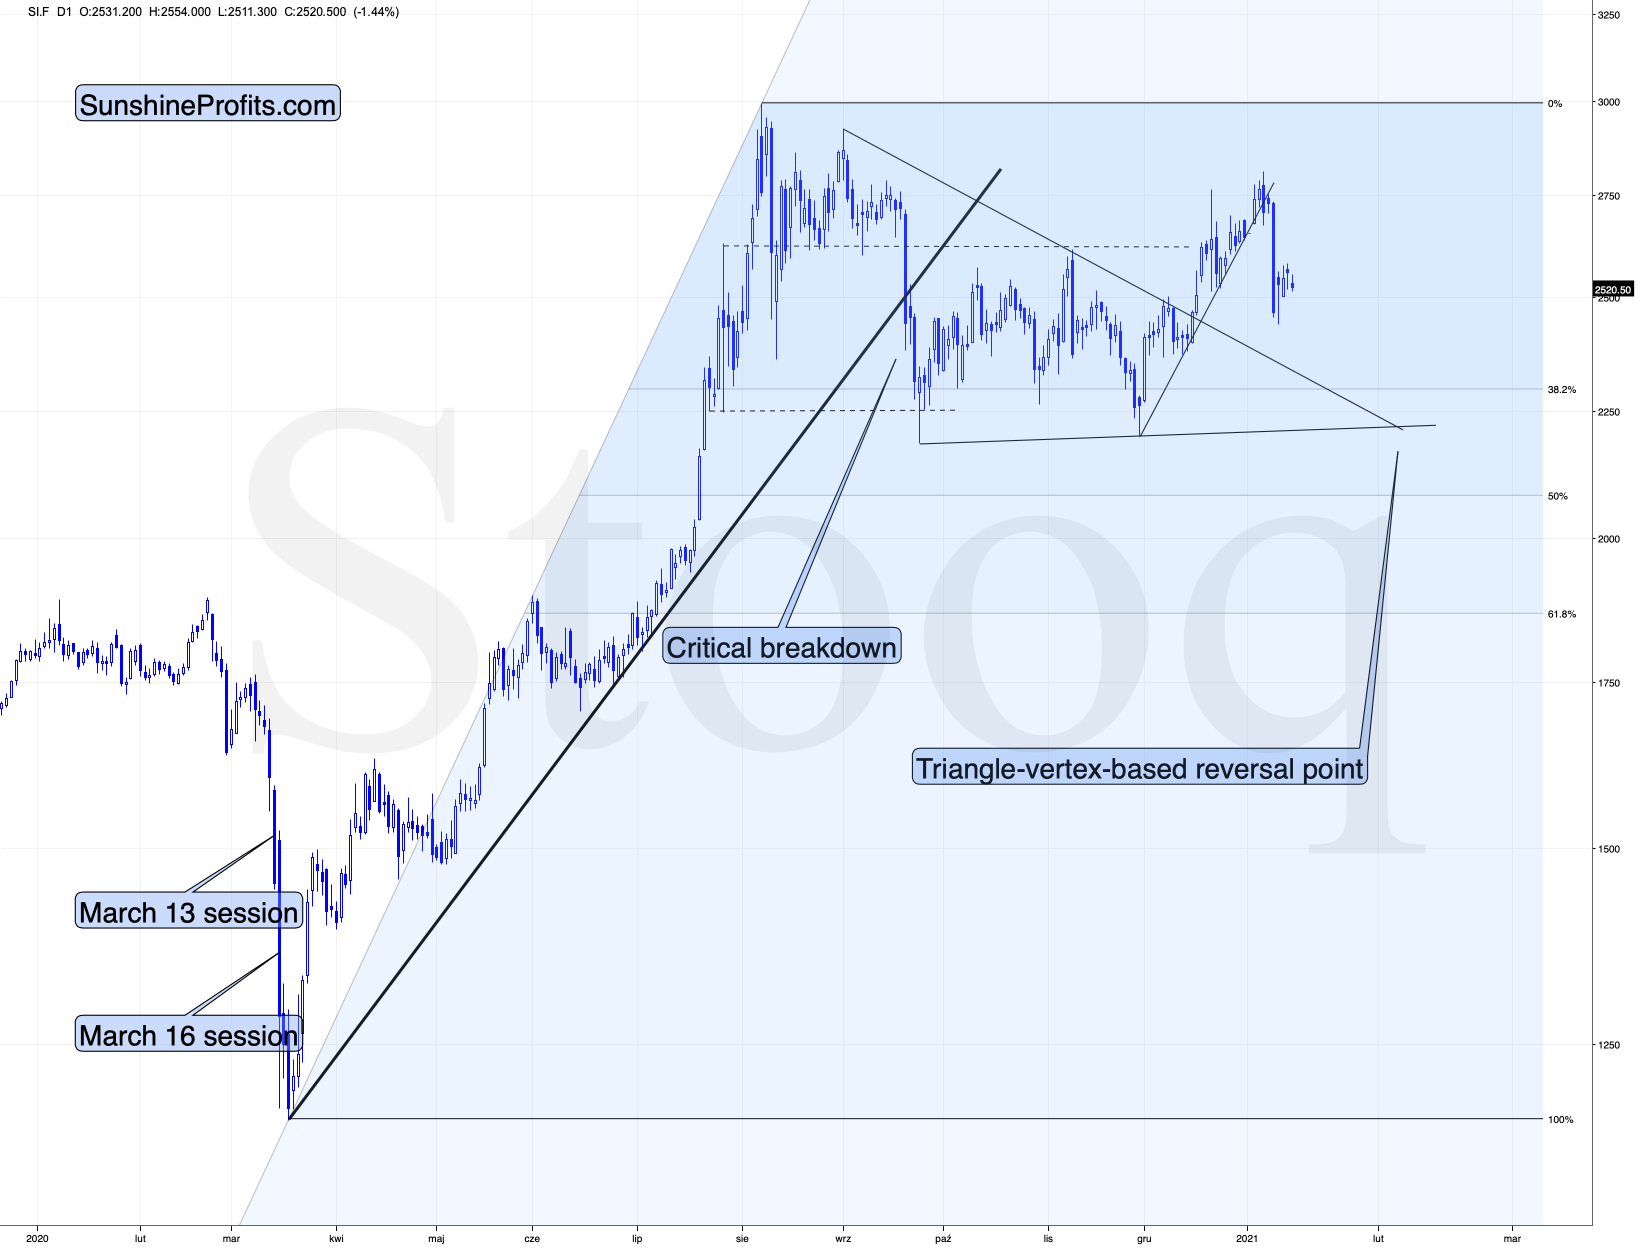
Figure – COMEX Silver Futures
In short, the breather in gold and silver continues. After a small upswing, we are seeing a small decline in today’s pre-market trading. This is natural and normal, given the size of the slide that we saw recently. The decline is likely to resume shortly.
After all, gold did reverse just as I described previously – right at its triangle-vertex-based reversal.
Having said that, let’s move on to something more interesting.
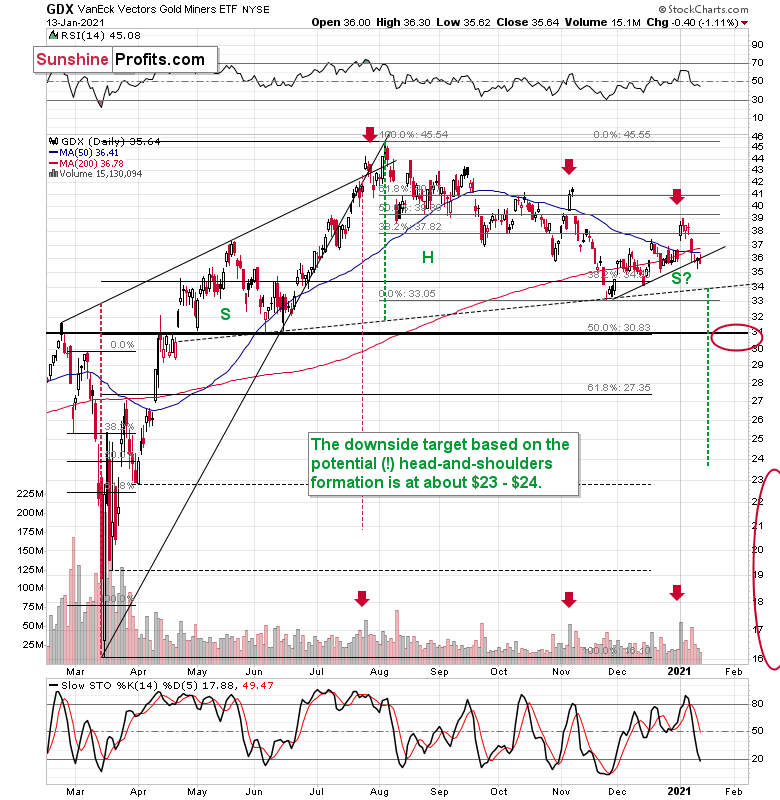
Figure - VanEck Vectors Gold Miners ETF (GDX)
The interesting thing about the mining stocks is that they closed the day below the rising, short-term support line. While it’s still unconfirmed, that looks like a breakdown. The volume on which it materialized was low. This, by itself, doesn’t invalidate the breakdown, but it means that it requires a confirmation before the implications get very bearish. The first crack in a dam seems innocent at first, but we all know what happens after a short while.
Consequently, my previous comments on the above chart remain up-to-date:
The sell signal from the stochastic indicator remains in place, and so does the sell signal coming from the volume spike in the first session of the year (analogy to July and November tops).
Please note that, based on the analogy to the November top, a small, two-day corrective upswing, would be quite normal here. It wouldn’t change the bearish outlook at all.
In addition, the GDX is on the cusp of forming a head and shoulders pattern. If you analyze the chart above, the area on the left (marked S) represents the first shoulder, while the area in the middle (H) represents the head and the area on the right (second S) represents the potential second shoulder.
Right now, $33.7-$34 is the do-or-die area. If the GDX breaks below this (where the right shoulder forms) it could trigger a decline back to the $24 to $23 range (measured by the spread between the head and the neckline; marked with green).
Since there’s a significant support at about $31 in the form of the 50% retracement based on the 2020 rally, and the February 2020 high, it seems that we might see the miners pause there. In fact, it wouldn’t be surprising to see a pullback from these levels to about $33, which could serve as the verification of the completion of the head-and-shoulder pattern. This might take place at the same time, when gold corrects the decline to $1,700, but it’s too early to say with certainty.
Also, let’s not forget that the GDX ETF has recently invalidated the breakout above the 61.8% Fibonacci retracement based on the 2011 – 2016 decline.
On top of that we have a classic post-breakout action in the USD Index.
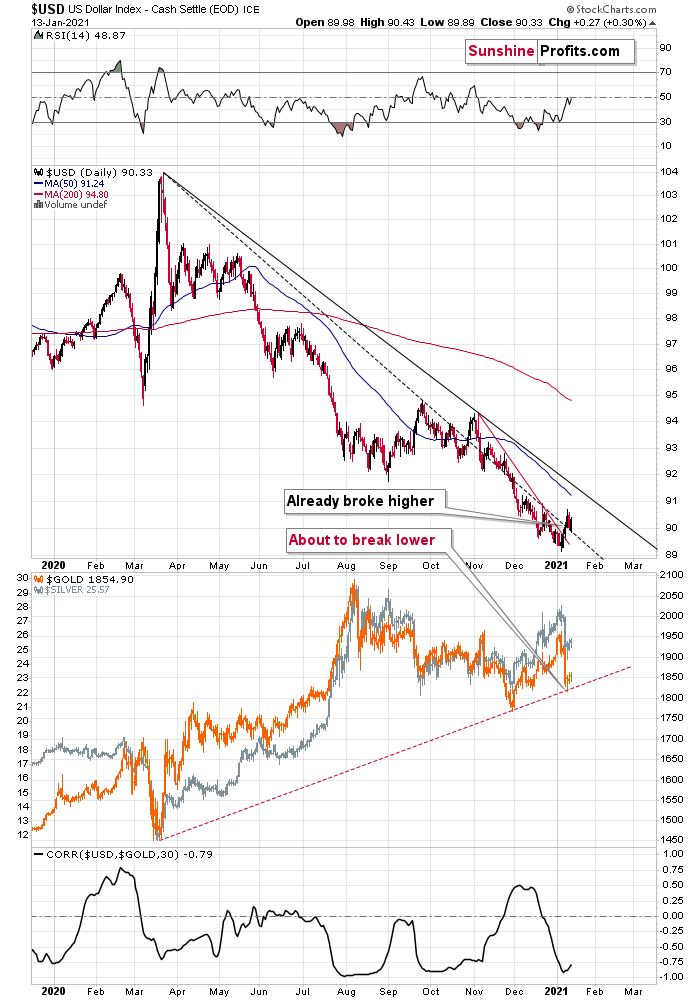
Figure - USD Index, USD, GOLD and CORR Comparison
In Tuesday’s (Jan. 12) analysis, I described the above chart in the following way:
After confirming the breakout above the very short-term declining resistance line, the USD Index has now broken above the declining dashed line that’s based on the March 2020 and September 2020 tops.
With the correlation between the USD index and gold (bottom part of the chart) being strongly negative, the USD’s breakouts are bullish for gold. Namely, they tell us that after a breather, the USD Index is likely to continue its rally, while precious metals are likely to fall.
The next big move in the PMs is likely to take place once gold breaks below its rising support line, and that’s likely to happen relatively soon. Moreover, please note that the existence of the support line is – by itself – a reason for gold to correct before sliding. This makes the theory of yesterday’s (Jan. 11) reversal not being a true reversal even more valid.
All in all, it seems that the precious metals sector is about to decline once again, if not immediately, then shortly.
And yesterday (Jan. 13), I added:
The breakout above the declining dashed line based on the March 2020 and September 2020 tops is now being verified. In other words, the USD Index moved back to this line without breaking below it. Once the USDX rallies once again, this breakout will be verified, and another short-term rally will be very likely to start.
The above is likely to mark the end of the pause in the precious metals’ and miners’ decline.
The USD Index did move higher yesterday and it’s slightly higher in today’s pre-market trading. The breakout is therefore verified and the implications for the precious metals sector are bearish.
Before summarizing, let’s take a more fundamental look at precious metals price drivers: currencies, yields, and stocks.
As you can see in our Correlation Matrix, the 30-trading-day correlation values are strongly negative in the case of all key parts of the precious metals market (gold, silver, senior miners, junior miners) and the USD Index, while they remain generally positive in case of the link with the stock market. Both links are most visible when we take the 250 trading days into account (effectively about 1 year).
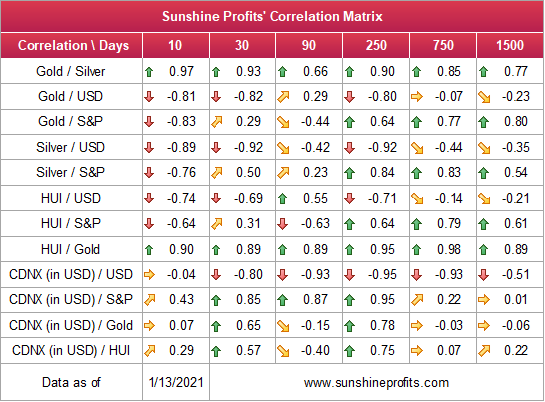
Figure 5 – Sunshine Profits’ Correlation Matrix
The closer to -1 the number gets, the more negatively correlated given assets are, and the closer to 1 it gets, the stronger the positive correlation. Numbers close to zero imply no correlation.
So, what do these markets tell us about future movements in the price of gold?
In for a Penny, in for a Pound
Over the last few days, I’ve highlighted the unhealthy activity that’s underpinned the rise in U.S. equities. And just like in a situation where the inmates would be running the asylum, risks are surpassing all-time highs.
In December, a penny stock frenzy pushed monthly volume to an eight-year high – smashing the previous spike in 2014. Moreover, if you analyze the extreme size of the bar (on the right side of the chart below), it highlights how Wall Street has become the latest addition to the Las Vegas Strip.
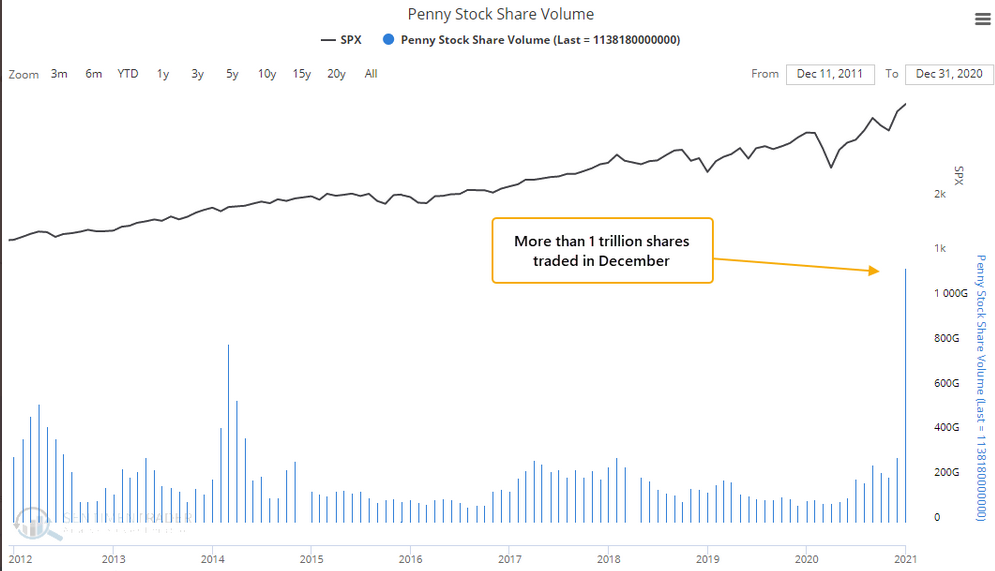
Figure 6 – (Source: NASDAQ/ SentimenTrader)
Fast forward to 2021 and the situation is even more extreme. As of Monday’s (Jan. 11) close, companies with share prices of less than $2.00 have significantly outperformed their larger counterparts.
Please see below:
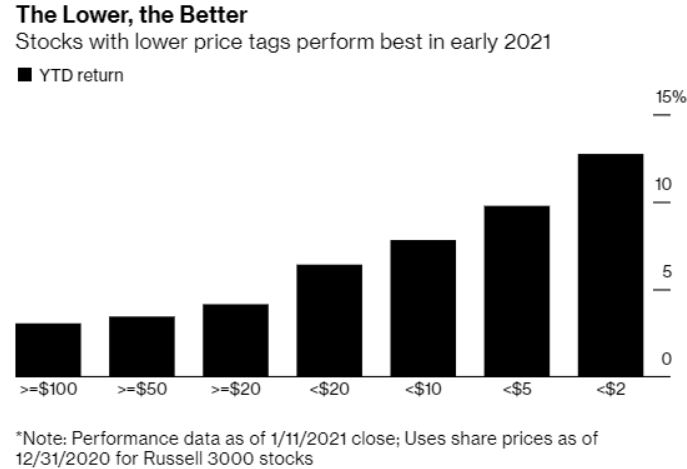
Figure 7 – (Source: Bloomberg)
Moreover, as the speculative feast reached new heights on Monday, six companies with share prices of below $1.00 made up nearly 20% of the day’s U.S. equity volume.
The most notable?
Zomedica (ZOM).
After Carole Baskin – who was featured in the 2020 Netflix documentary series Tiger King – mentioned the pharmaceutical company during a promotional appearance, the stock ended up ripping 230% higher.
Please see below:
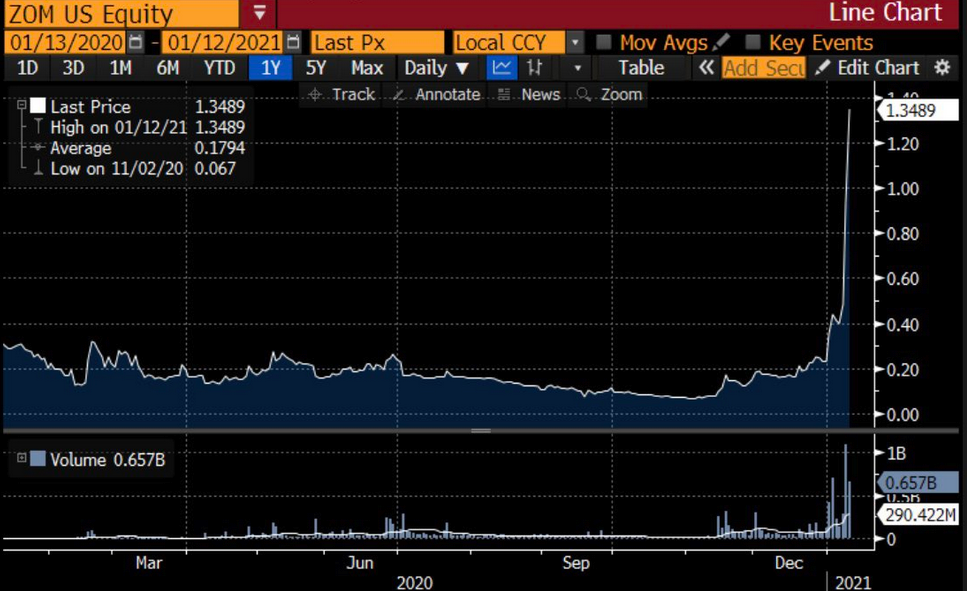
Figure 8 – (Source: Bloomberg/ Sarah Ponczek)
But what’s fanning these irrational flames?
Well, retail traders have overrun the U.S. equity markets. And contrasting most seasoned investors, retail traders are willing to purchase assets at any price with no regard for historical technicals or fundamentals. Furthermore, many of today’s traders are too young to remember the dot-com bubble, which further erodes their ability to see the forest through the trees.
Warren Buffett once wrote, “Normally sensible people drift into behavior akin to that of Cinderella at the ball. They know that overstaying the festivities, that is, continuing to speculate in companies that have gigantic valuations relative to the cash they are likely to generate in the future will eventually bring on pumpkins and mice. Therefore, the giddy participants all plan to leave just seconds before midnight. There’s a problem, though: they are dancing in a room in which the clocks have no hands.”
So, while the party rages on and the invisible hands tick, retail traders continue to (as I mentioned yesterday), Push It to the Limit.
Please see below:
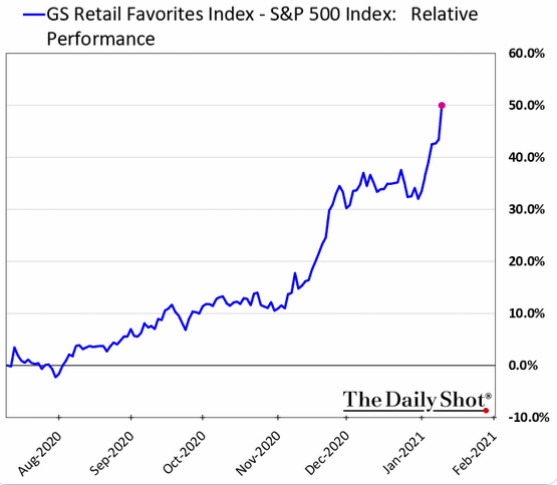
Figure 9
To explain, the blue line above depicts the spread between the Goldman Sachs Retail Favorites Index return and the S&P 500 (SPX) return. As you can see, the vertical move higher in late December helps explain why the S&P 500 has been green for 14 of the last 17 days (For context, the GS retail index includes companies like Penn National Gaming, Moderna, Tesla, MGM Resorts International and Royal Caribbean Cruises.)
If that wasn’t enough, 2020 ended with U.S. investors granting the highest-ever market cap to technology companies with negative earnings.
Please see below:
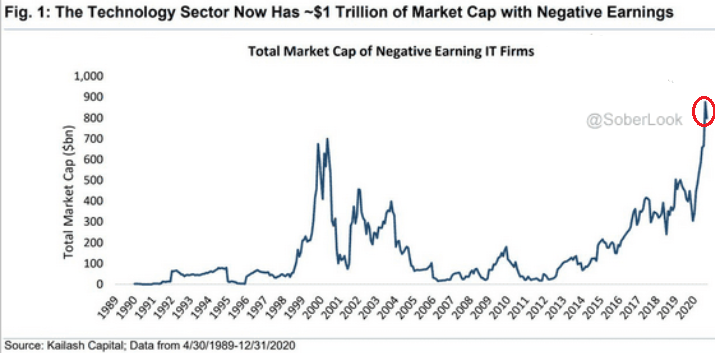
Figure 10
Furthermore, this record-breaking feat also coincided with the NASDAQ 100 reaching its highest-ever relative outperformance of the S&P 500.
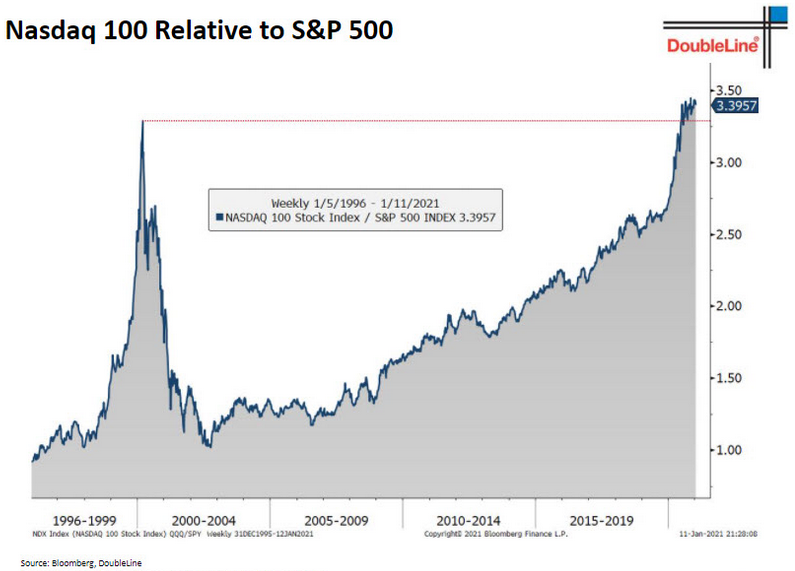
Figure 11
To explain, the chart above plots the ratio of the NASDAQ 100’s price relative to the S&P 500’s price. When the line rises, it means that the NASDAQ 100 is outperforming and when the line falls, it means that the S&P 500 is outperforming. As you can see, the current value already exceeds the dot-com bubble peak.
More importantly though, the six largest companies in the NASDAQ 100 – Apple, Microsoft, Amazon, Tesla, Facebook and Alphabet – are also the six largest constituents of the S&P 500. Thus, if technology’s outperformance reverts back to its historical average, both indices will be slaughtered.
And how could this affect the precious metals?
Well, considering the interconnectedness of financial markets, a collapse of equities will shake the foundation of the PMs. As you read above, gold, silver and the HUI Index have 250-day (roughly one year) correlations with the S&P 500 of 0.64, 0.84 and 0.64 (For context, the closer they are to +1, the more often they move in the same direction.)
Thus, with recent equity strength helping to support the PMs, a reversal of this trend could lead to an even bigger decline for the PMs once it unfolds.
EUR/USD Can’t Make up Its Mind
As choppy fundamental waves rattle the EUR/USD, its European half is starting to take on water. Yesterday, I warned of a fundamental disconnect that’s likely to drown the euro.
And after Wednesday’s (Jan. 13) 0.43% decline, we can add another variable to the bearish mix: political instability.
On the verge of collapse, Italy’s former Prime Minister Matteo Renzi announced (on Jan. 12) that he won’t support the country’s ruling coalition and that two ministers from his Italia Viva party are resigning.
And as the political chaos unfolds, Europe’s third largest economy (if you exclude the U.K. which left the EU and has its own currency) remains in partial lockdown and its government debt-to-GDP already exceeds 149% (the highest on record and second-highest in the Eurozone behind Greece).
Thus, the latest developments aren’t exactly bullish for the euro.
Moving on to the Consumer Price Index (CPI), I wrote on Jan. 8 that Eurozone CPI (inflation) fell by 0.30% in December (its fifth-straight negative print). And yesterday, the U.S. Bureau of Labor Statistics (BLS) published its December figure.
Continuing the relative outperformance, U.S. CPI increased by 0.40% (rounded), notching its seventh-straight month of positive data.
Please see below:
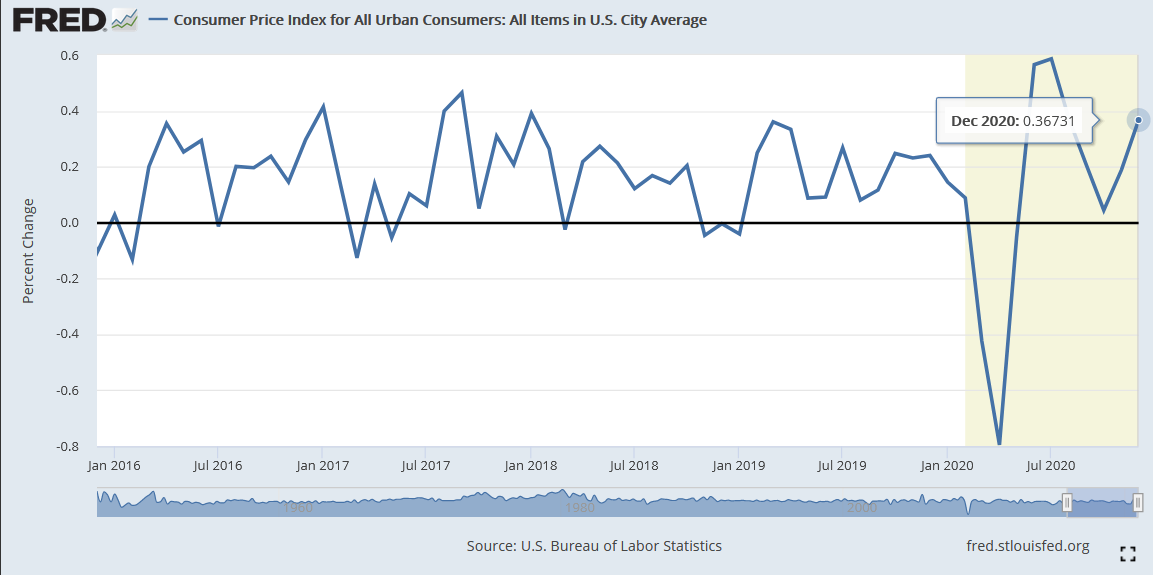
Figure 12
To explain the significance, I wrote on Jan. 8:
Weak CPI is a precursor to a weaker euro. Why so? Because since asset purchases fail to produce any real economic growth, the ECB will be forced to lower interest rates to stimulate the economy. As a result, the cocktail of paltry economic activity and lower bond yields leads to capital outflows as foreign (and domestic) investors reallocate money to other geographies (like the U.S.). Thus, capital will likely exit the Eurozone and lead to a lower EUR/USD.
The bottom line?
Day after day, more rain pours on the euro. And once sentiment gives way to reality, a decline in the EUR/USD is likely to propel the USD Index higher (which, as mentioned, is already trading above its declining resistance line).
And given the strong negative correlations between gold, silver and the HUI Index relative to the USD Index (– 0.80, – 0.92 and – 0.71 respectively over the last 250 days), a profound USDX rally could be the next shoe to drop for the PMs.
Letters to the Editor
Q: You have changed your down price target for Gold $1700 to $1500. Is this a revision and do you see a correction being more severe? Please clarify.
"After the sell-off (that takes gold to about $1,500), we expect the precious metals to rally significantly. The final part of the decline might take as little as 1-5 weeks, so it's important to stay alert to any changes."
A: This change reflects what I’ve been writing in my analyses in the previous days and weeks. The USD Index is just starting to rally, and gold already declined severely. Consequently, it seems likely that if the USD Index rallies really visibly, gold will do more than just repeat its recent January decline – the latter would take it to approximately $1,700.
Consequently, while I think that gold will find a temporary bottom at $1,700, it seems more likely than not that it will not be the final bottom for this decline. The same with $31 as the downside target for the GDX ETF.
Overview of the Upcoming Decline
- As far as the current overview of the upcoming decline is concerned, I think it has already begun.
- During the final part of the slide (which could end within the next 1-12 weeks or so), I expect silver to decline more than miners. That would align with how the markets initially reacted to the COVID-19 threat.
- The impact of all the new rounds of money printing in the U.S. and Europe on the precious metals prices is incredibly positive in the long run, which does not make the short-term decline improbable. Markets can and will get ahead of themselves and decline afterward – sometimes very profoundly – before continuing with their upward climb.
- The plan is to exit the current short positions in miners after they decline far and fast, but at the same time, silver drops just “significantly” (we expect this to happen in 0 – 5 weeks ). In other words, the decline in silver should be severe, but the decline in the miners should look “ridiculous”. That’s what we did in March when we bought practically right at the bottom . It is a soft, but simultaneously broad instruction, so additional confirmations are necessary.
- As a point of reference, given that the inverse pattern above mirrors today’s price action, the duration of the precious metals’ decline could last longer than my initial forecast. Keep in mind though, a prolonged bear market is not my base case; I’m merely indicating that the possibility exists.
- The final bottom in gold could form close to $1,500, after a temporary rebound from about $1,700. The $1,700 is likely to correspond to a move to about $31 in the GDX ETF. We will likely exit the short positions at that time, and we might even open quick long positions. During the next move lower silver might decline more than gold and miners, so we might focus on shorting that market at that time.
- The precious metals market's final bottom is likely to take shape when gold shows significant strength relative to the USD Index . It could take the form of a gold’s rally or a bullish reversal, despite the ongoing USD Index rally.
Summary
Summing up, the outlook for gold and the rest of the precious metals market is bearish for at least the next few weeks. After topping at its triangle-vertex-based reversal, gold moved sharply lower and it just invalidated the breakout above its declining resistance line, while breaking below the rising support line. All this happened as the USD Index rallied visibly above its declining resistance lines and invalidated the breakdown below the 2020 lows. This creates a strongly bearish combination for the precious metals market.
The USD Index and cryptocurrencies suggest that we’re seeing the repeat of early 2018, when the USD Index bottomed. Given the current correlations between PMs and the USD Index, the rally in the USDX is likely to have very bearish implications for the precious metals market.
Despite a recent decline, it seems that the USD Index is going to move higher in the following months and weeks, in turn causing gold to decline. At some point gold is likely to stop responding to dollar’s bearish indications, and based on the above analysis, it seems that this is already taking place.
Naturally, everyone's trading is their responsibility. But in our opinion, if there ever was a time to either enter a short position in the miners or increase its size if it was not already sizable, it's now. We made money on the March decline, and on the March rebound, with another massive slide already underway.
After the sell-off (that takes gold to about $1,500), we expect the precious metals to rally significantly. The final part of the decline might take as little as 1-5 weeks, so it's important to stay alert to any changes.
Most importantly, please stay healthy and safe. We made a lot of money on the March decline and the subsequent rebound (its initial part) price moves (and we'll likely earn much more in the following weeks and months), but you have to be healthy to enjoy the results.
As always, we'll keep you - our subscribers - informed.
To summarize:
Trading capital (supplementary part of the portfolio; our opinion): Full speculative short positions (300% of the full position) in mining stocks is justified from the risk to reward point of view with the following binding exit profit-take price levels:
Senior mining stocks (price levels for the GDX ETF): binding profit-take exit price: $32.02; stop-loss: none (the volatility is too big to justify a SL order in case of this particular trade); binding profit-take level for the DUST ETF: $28.73; stop-loss for the DUST ETF: none (the volatility is too big to justify a SL order in case of this particular trade)
Junior mining stocks (price levels for the GDXJ ETF): binding profit-take exit price: $42.72; stop-loss: none (the volatility is too big to justify a SL order in case of this particular trade); binding profit-take level for the JDST ETF: $21.22; stop-loss for the JDST ETF: none (the volatility is too big to justify a SL order in case of this particular trade)
For-your-information targets (our opinion; we continue to think that mining stocks are the preferred way of taking advantage of the upcoming price move, but if for whatever reason one wants / has to use silver or gold for this trade, we are providing the details anyway. In our view, silver has greater potential than gold does):
Silver futures downside profit-take exit price: unclear at this time - initially, it might be a good idea to exit, when gold moves to $1,703.
Gold futures downside profit-take exit price: $1,703
Long-term capital (core part of the portfolio; our opinion): No positions (in other words: cash
Insurance capital (core part of the portfolio; our opinion): Full position
Whether you already subscribed or not, we encourage you to find out how to make the most of our alerts and read our replies to the most common alert-and-gold-trading-related-questions.
Please note that we describe the situation for the day that the alert is posted in the trading section. In other words, if we are writing about a speculative position, it means that it is up-to-date on the day it was posted. We are also featuring the initial target prices to decide whether keeping a position on a given day is in tune with your approach (some moves are too small for medium-term traders, and some might appear too big for day-traders).
Additionally, you might want to read why our stop-loss orders are usually relatively far from the current price.
Please note that a full position doesn't mean using all of the capital for a given trade. You will find details on our thoughts on gold portfolio structuring in the Key Insights section on our website.
As a reminder - "initial target price" means exactly that - an "initial" one. It's not a price level at which we suggest closing positions. If this becomes the case (like it did in the previous trade), we will refer to these levels as levels of exit orders (exactly as we've done previously). Stop-loss levels, however, are naturally not "initial", but something that, in our opinion, might be entered as an order.
Since it is impossible to synchronize target prices and stop-loss levels for all the ETFs and ETNs with the main markets that we provide these levels for (gold, silver and mining stocks - the GDX ETF), the stop-loss levels and target prices for other ETNs and ETF (among other: UGL, GLL, AGQ, ZSL, NUGT, DUST, JNUG, JDST) are provided as supplementary, and not as "final". This means that if a stop-loss or a target level is reached for any of the "additional instruments" (GLL for instance), but not for the "main instrument" (gold in this case), we will view positions in both gold and GLL as still open and the stop-loss for GLL would have to be moved lower. On the other hand, if gold moves to a stop-loss level but GLL doesn't, then we will view both positions (in gold and GLL) as closed. In other words, since it's not possible to be 100% certain that each related instrument moves to a given level when the underlying instrument does, we can't provide levels that would be binding. The levels that we do provide are our best estimate of the levels that will correspond to the levels in the underlying assets, but it will be the underlying assets that one will need to focus on regarding the signs pointing to closing a given position or keeping it open. We might adjust the levels in the "additional instruments" without adjusting the levels in the "main instruments", which will simply mean that we have improved our estimation of these levels, not that we changed our outlook on the markets. We are already working on a tool that would update these levels daily for the most popular ETFs, ETNs and individual mining stocks.
Our preferred ways to invest in and to trade gold along with the reasoning can be found in the how to buy gold section. Furthermore, our preferred ETFs and ETNs can be found in our Gold & Silver ETF Ranking.
As a reminder, Gold & Silver Trading Alerts are posted before or on each trading day (we usually post them before the opening bell, but we don't promise doing that each day). If there's anything urgent, we will send you an additional small alert before posting the main one.
Thank you.
Przemyslaw Radomski, CFA
Founder, Editor-in-chief

