

Briefly: in our opinion, full (250% of the regular size of the position) speculative short positions in gold, silver and mining stocks are justified from the risk/reward perspective at the moment of publishing this alert.
The gold stocks tend to lead gold right after the major bottoms. We saw this in early 2016 and since gold stocks showed strength yesterday by closing back above the previous important highs, it could be viewed as a sign of a bottom. But is it really the case?
In all likelihood, this is not the case. Gold stocks did move higher and they did close above their October 2015 highs, but that’s just a small blip on the radar screen and it’s not supported by anything else that we have on the charts. Moreover, small breakout in the gold stocks to gold ratio was exactly what preceded the previous significant decline in the precious metals sector, so perhaps what we saw yesterday should be viewed as something bearish, not bullish.
Let’s take a look at the charts for details (charts courtesy of http://stockcharts.com). Let’s start with gold and silver.
No Bullish Signs in Precious Metals’ Prices
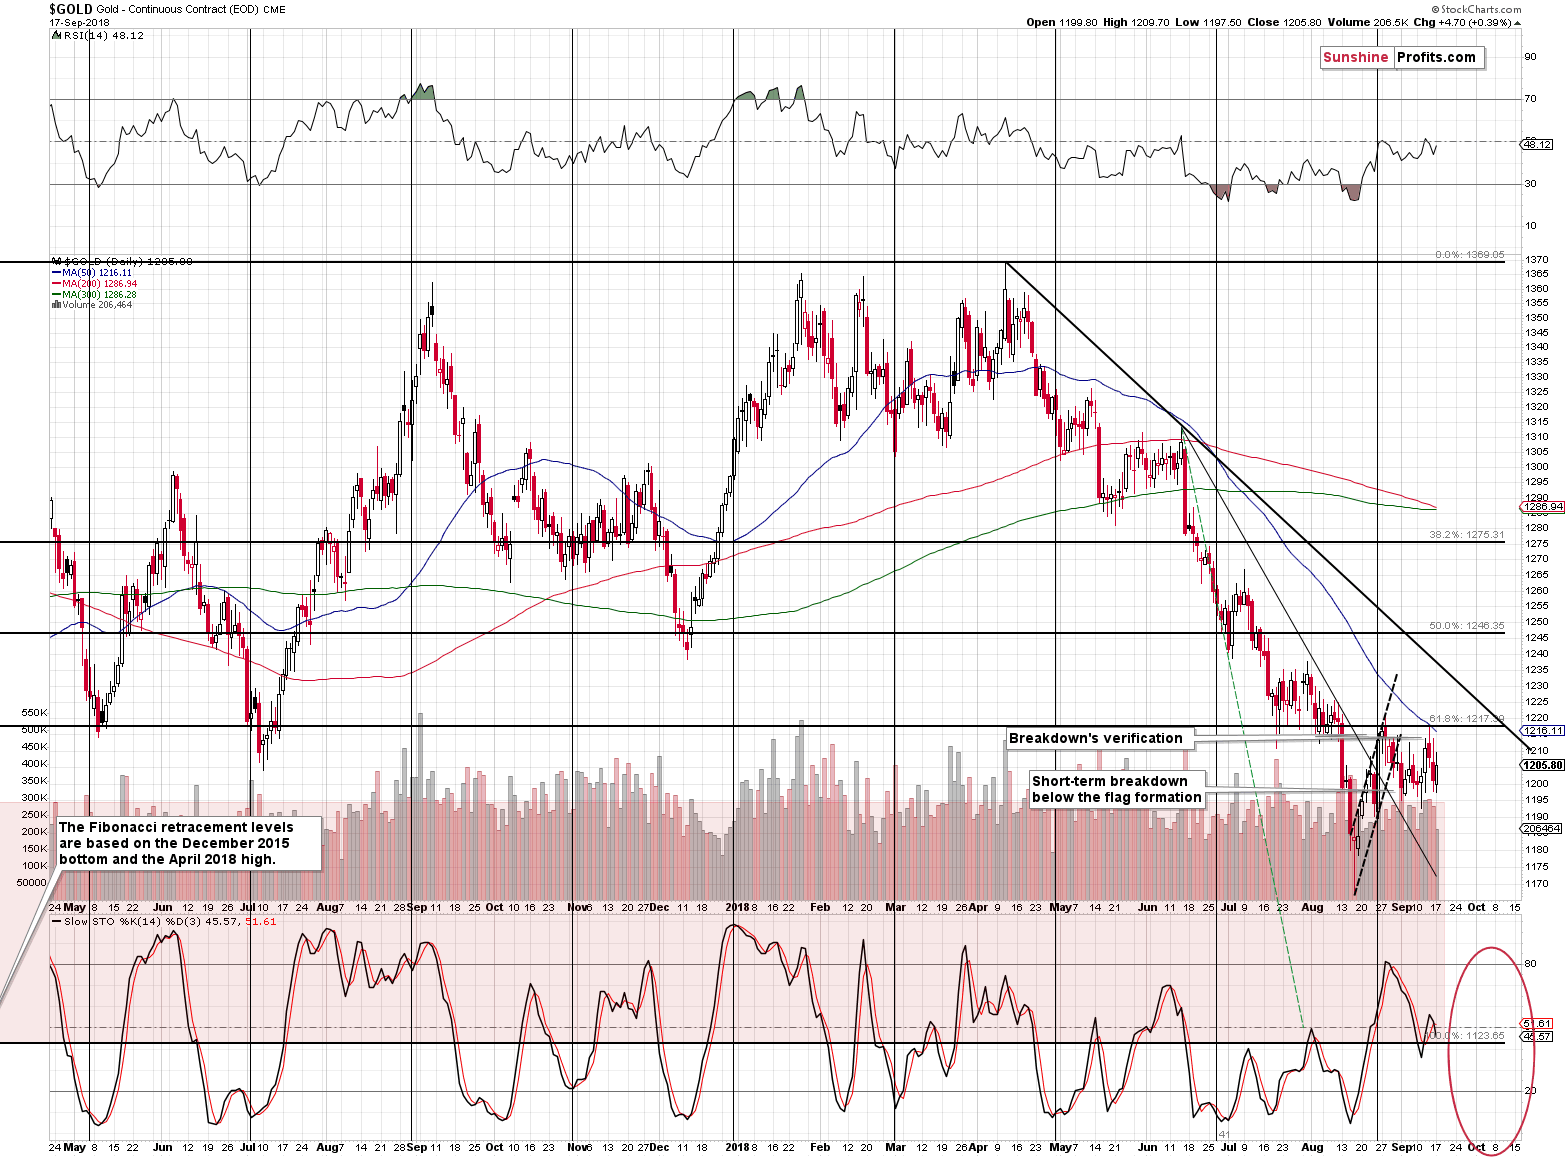
Gold closed the day only a few dollars higher than it had closed on Friday, and at the moment of writing these words, gold is trading back below $1,200 (precisely, at $1,198).
Yesterday’s upswing is therefore rather unimportant. What appears more important is the sell signal from the Stochastic indicator. As you saw in yesterday’s Alert, such signal (approximately at the current indicator levels) was the final bearish confirmation that we saw right before the powerful $200+ slide. The implications are bearish.
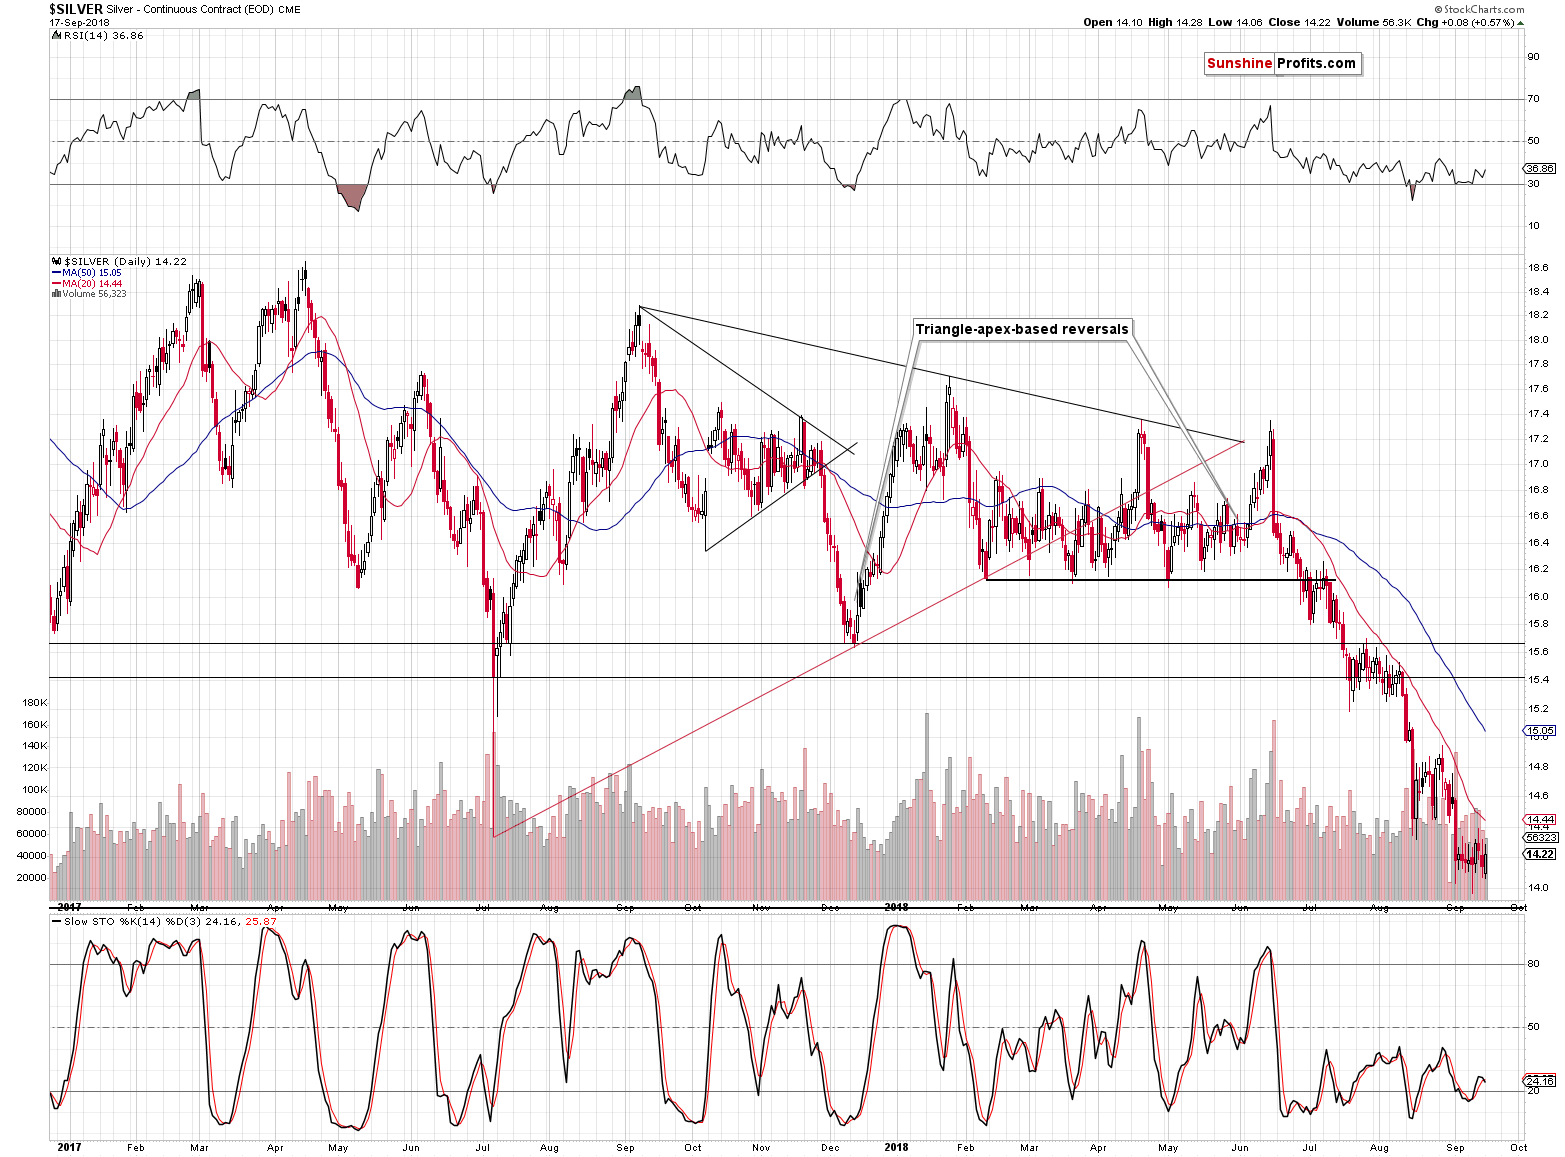
Silver moved a bit higher, but this move didn’t change much – the white metal is still moving back and forth just above the $14 level. Consequently, our yesterday’s comments on the above chart and the implications of Friday’s small (but still) breakdown remain up-to-date:
On Thursday, silver rallied visibly higher on an intraday basis, which is something that silver quite often does before starting volatile declines. We saw that in the final part of August, in early July, and – in a more visible way – in mid-June. The signal would have been even stronger if silver outperformed gold on that day, but due to the breakout in the gold to silver ratio, it was difficult to achieve, and thus what silver did seems to be a rather normal thing to do right before declining.
The price of the white metal didn’t plunge yet, but it did close the day and the week at a new yearly low, which is a subtle, but strong indication that the next big move lower is about to start.
Verifications, Invalidations and Their Implications
In yesterday’s Alert, we commented on HUI’s breakdowns in the following way:
In case of the mining stocks, there was no new breakdown, but we once again saw a textbook example of breakdown’s verification.
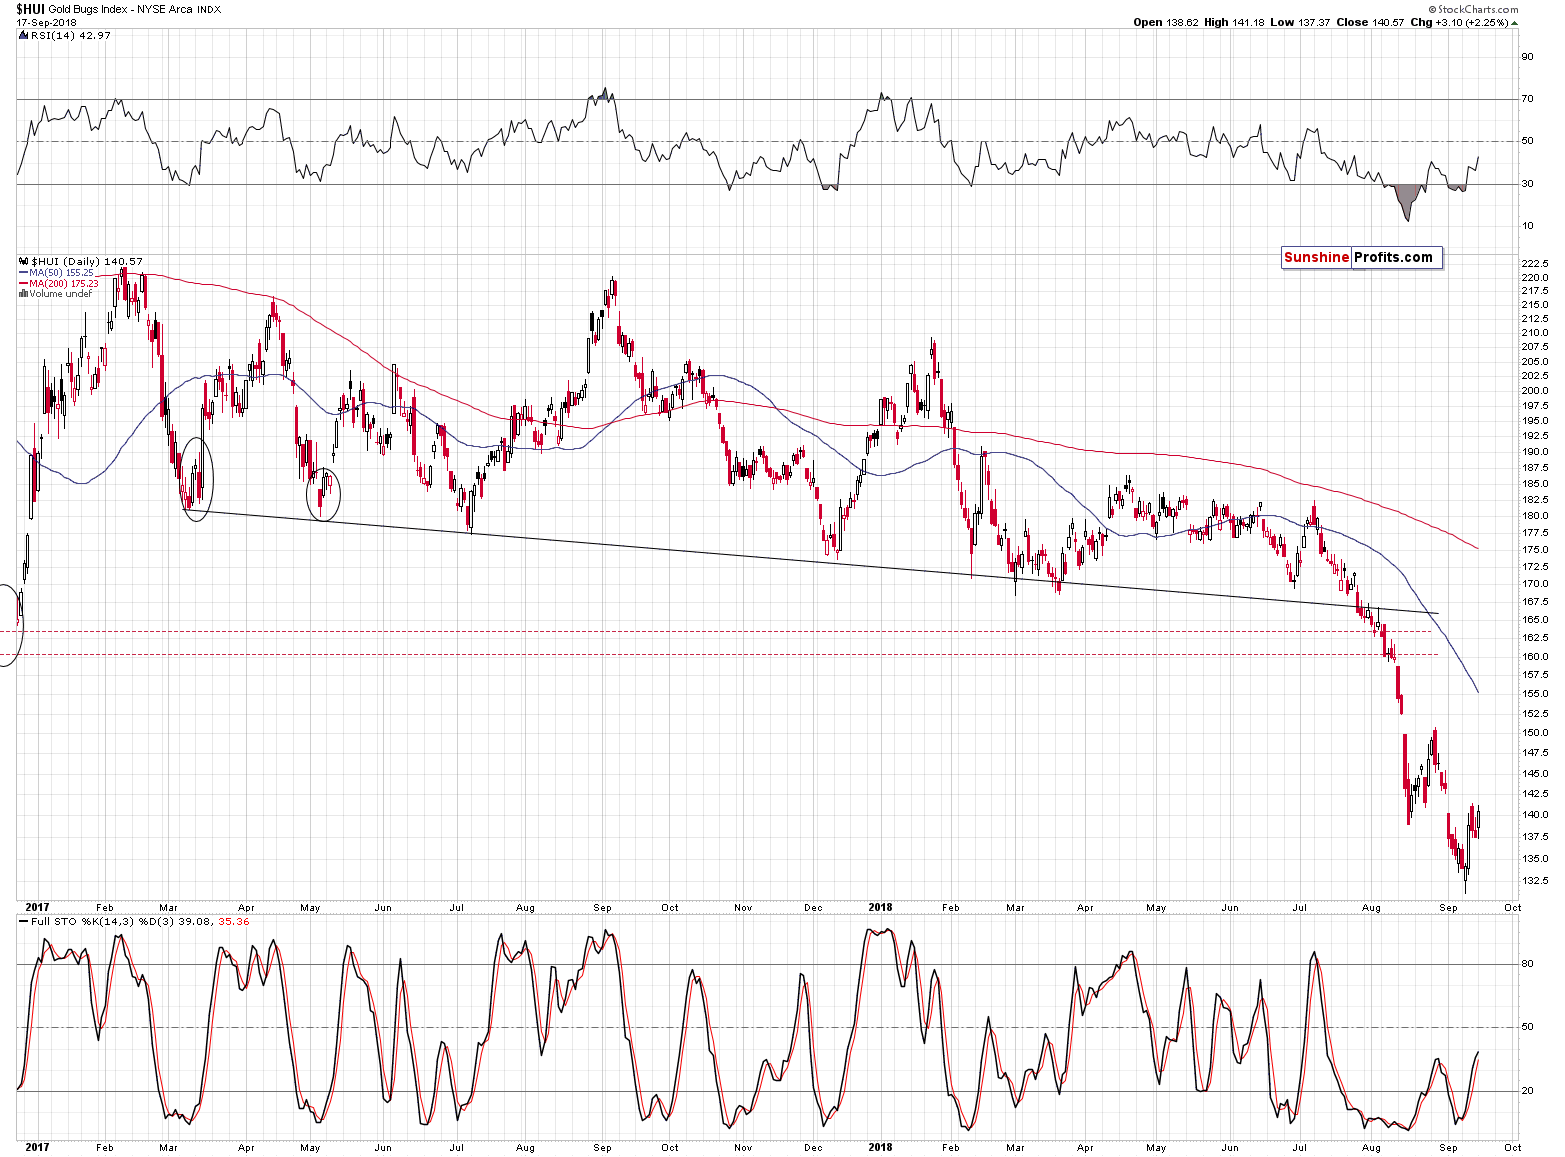
The first major breakdown was below the 150 level that corresponds to the 2008 low. After moving below it, the HUI Index moved to the October 2015 highs and started the corrective upswing from these levels. After moving back to the previously broken 150 level, HUI declined once again, this time breaking below the October 2015 highs.
Gold stocks managed to decline to almost 130, before correcting. Like it was the case previously, what was support, now provided resistance. The HUI Index tried to move back above the levels of October 2015 highs (approximately 140), and even succeeded on an intraday basis, but ultimately failed by not managing to close above this level for even a single day.
The breakdown below the 140 level is confirmed and the implications are very bearish. In 2016, it took about 2 weeks for the HUI Index to rally from below 100 to the current levels and we could see similar level of volatility on the downside. The implications are very bearish.
Gold stocks closed yesterday’s session slightly above 140, and the question is if the breakdown below this level was invalidated. In a way, yes. After all, we saw a daily close above 140. But, the really important question is if this already has bullish implications. In most cases, invalidations of given moves have immediate implications. But, this situation looks suspicious to say the least.
And it’s not only because nothing else in the precious metals market confirms the supposedly bullish implications of the tiny breakout. It’s also because we saw something similar very recently. When the HUI Index broke below the 150 level (the 2008 bottom) in August, the corrective upswing also took it back above this level. There was no close back above 150, but there was an intraday move and some viewed this as an invalidation when it was taking place. Yet, it was a perfect opportunity to enter the short position, not to close it .
Another clue comes from the analysis of the HUI to gold ratio.
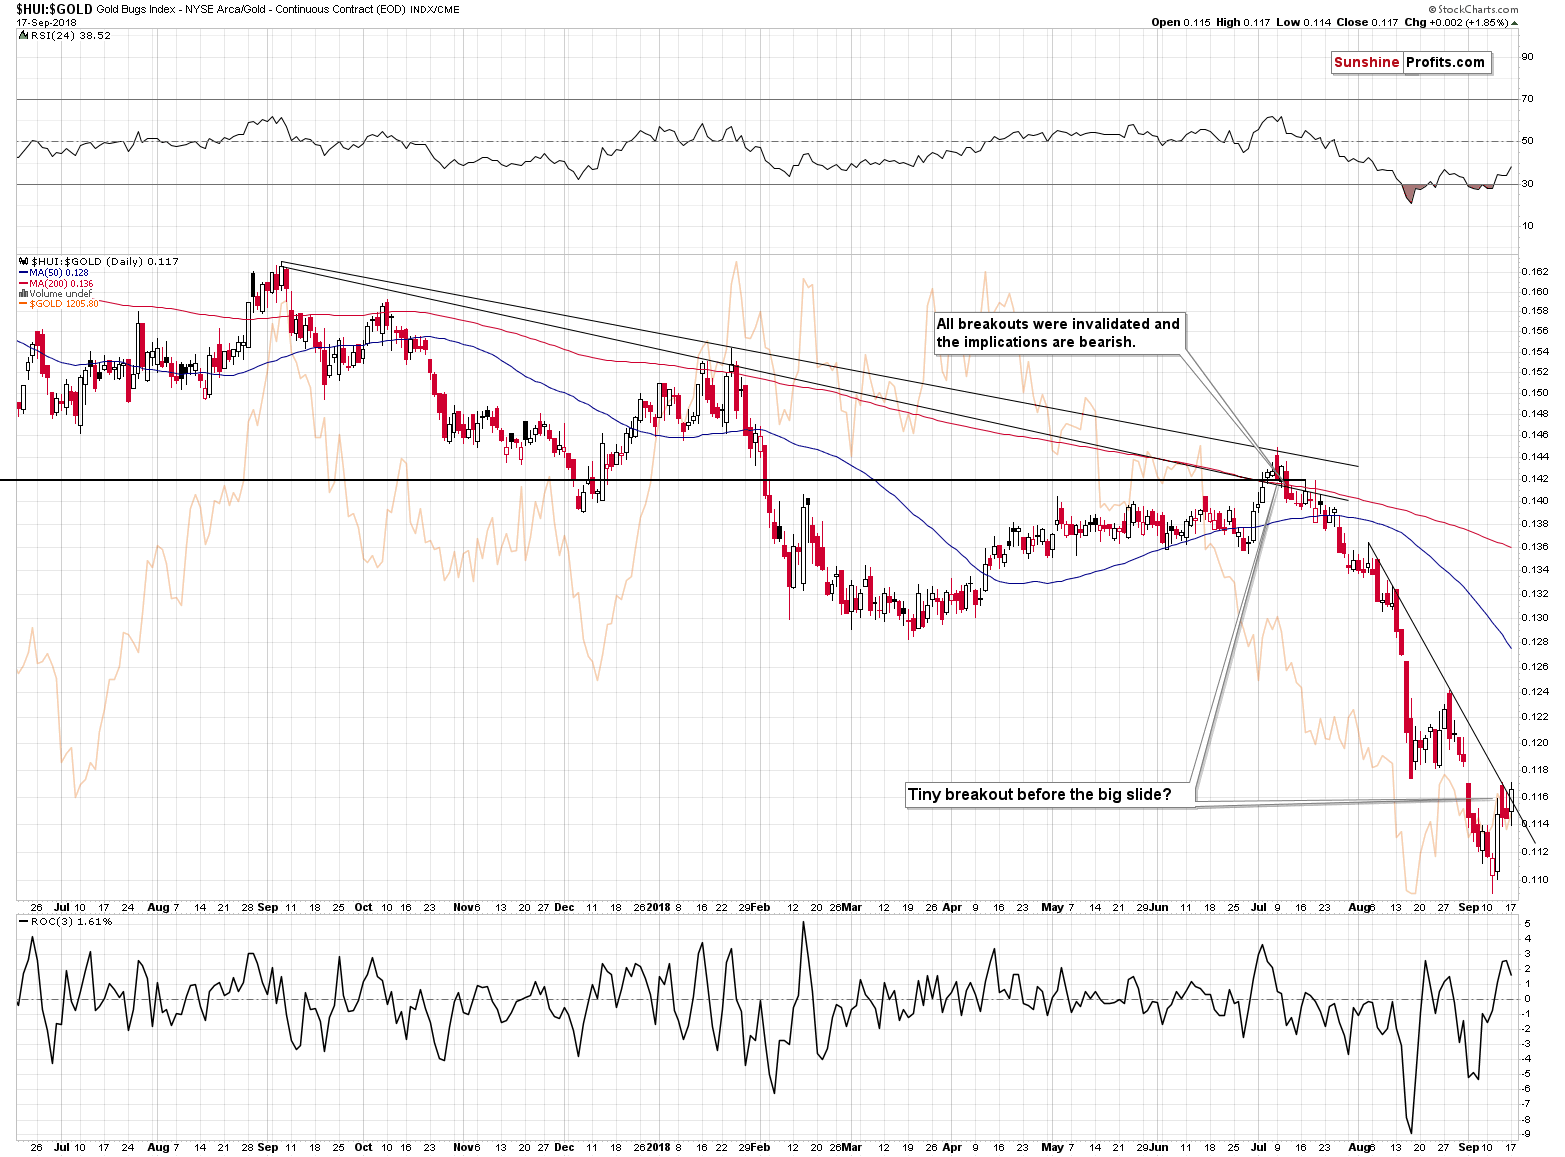
There was a tiny breakout in the ratio and the last time we saw something similar was in early July, 2018. That was not a real breakout – it was the final call for establishing short positions in order to take advantage of the price slide.
So, we have not one, but two examples of how small breakouts were actually fake signals that were followed by big declines. This, plus the fact that the outlook didn’t improve in case of the underlying metals makes us view the outlook as unchanged in light of yesterday’s session. In other words, it remains very bearish.
Before summarizing, we would like to examine the situation in the currencies.
Forex Update
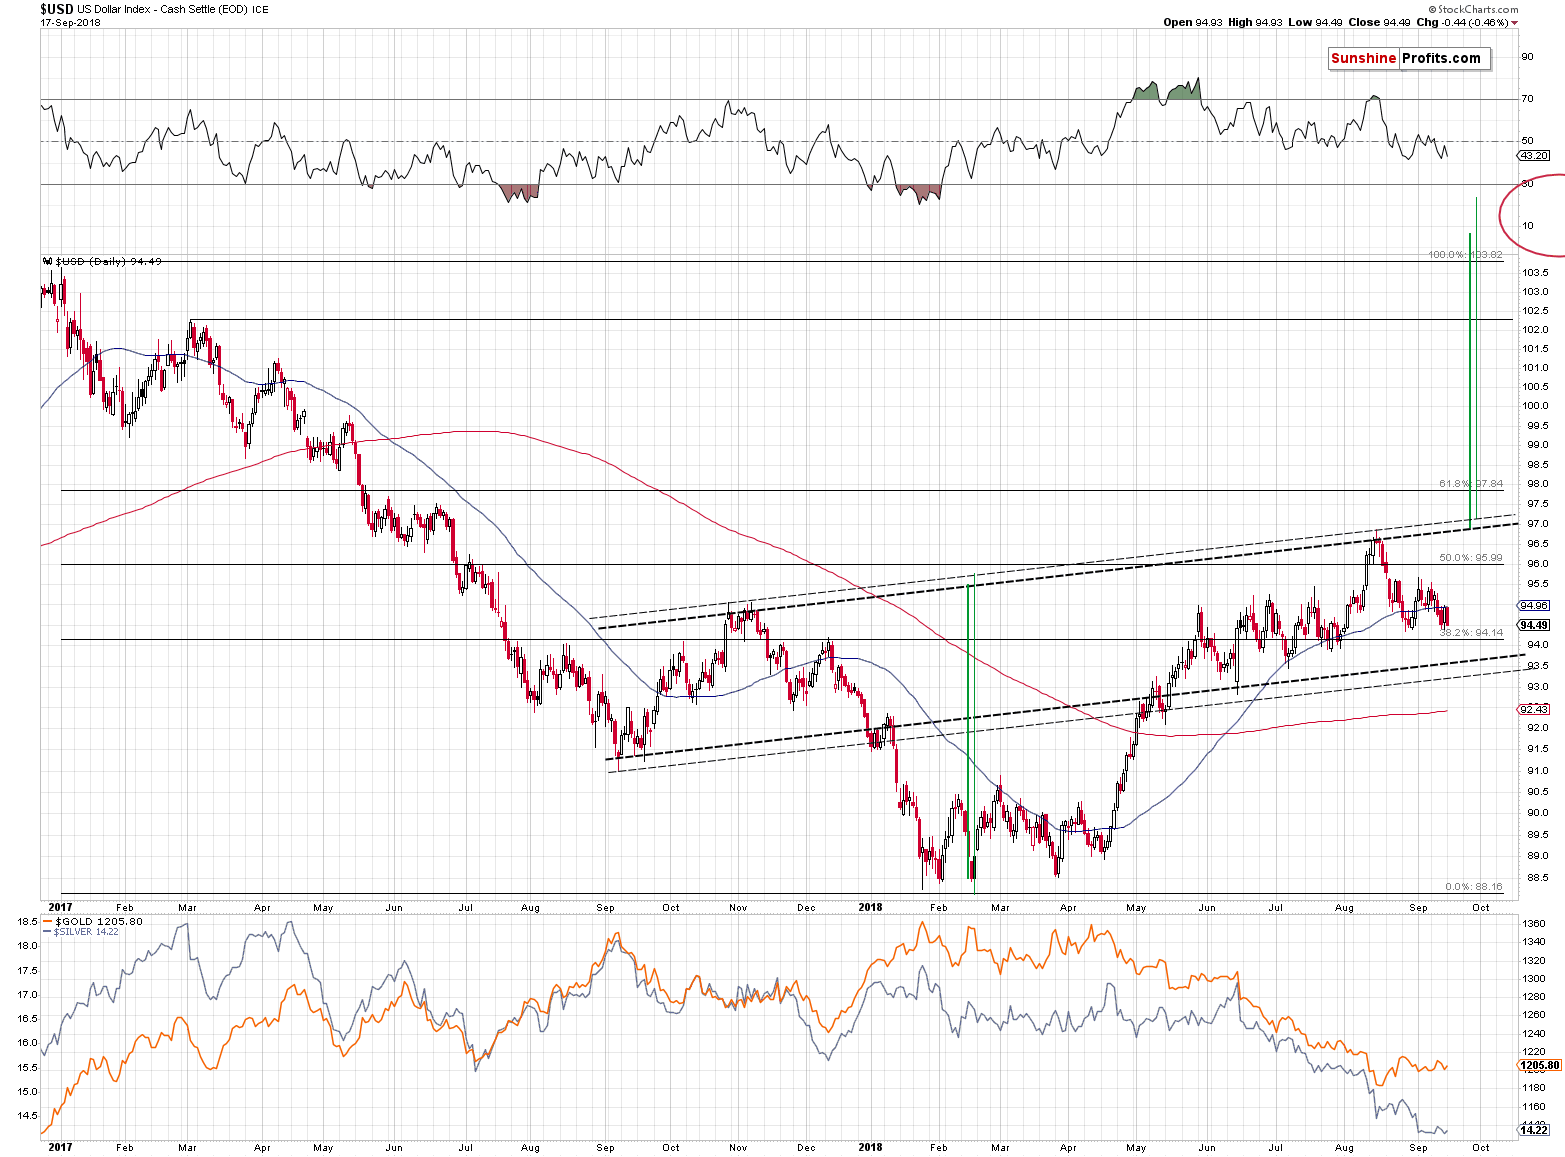
The situation in the USD Index didn’t change yesterday, as the price levels that we saw, were the same price levels that we had already seen on Thursday. Most importantly, the outlook for the two key components of the USD Index didn’t change.
The intraday high was a bit below Thursday’s high and yesterday’s closing prices was a bit below Thursday’s closing prices. It seems that we simply saw a re-test of the price levels that we saw on Thursday.
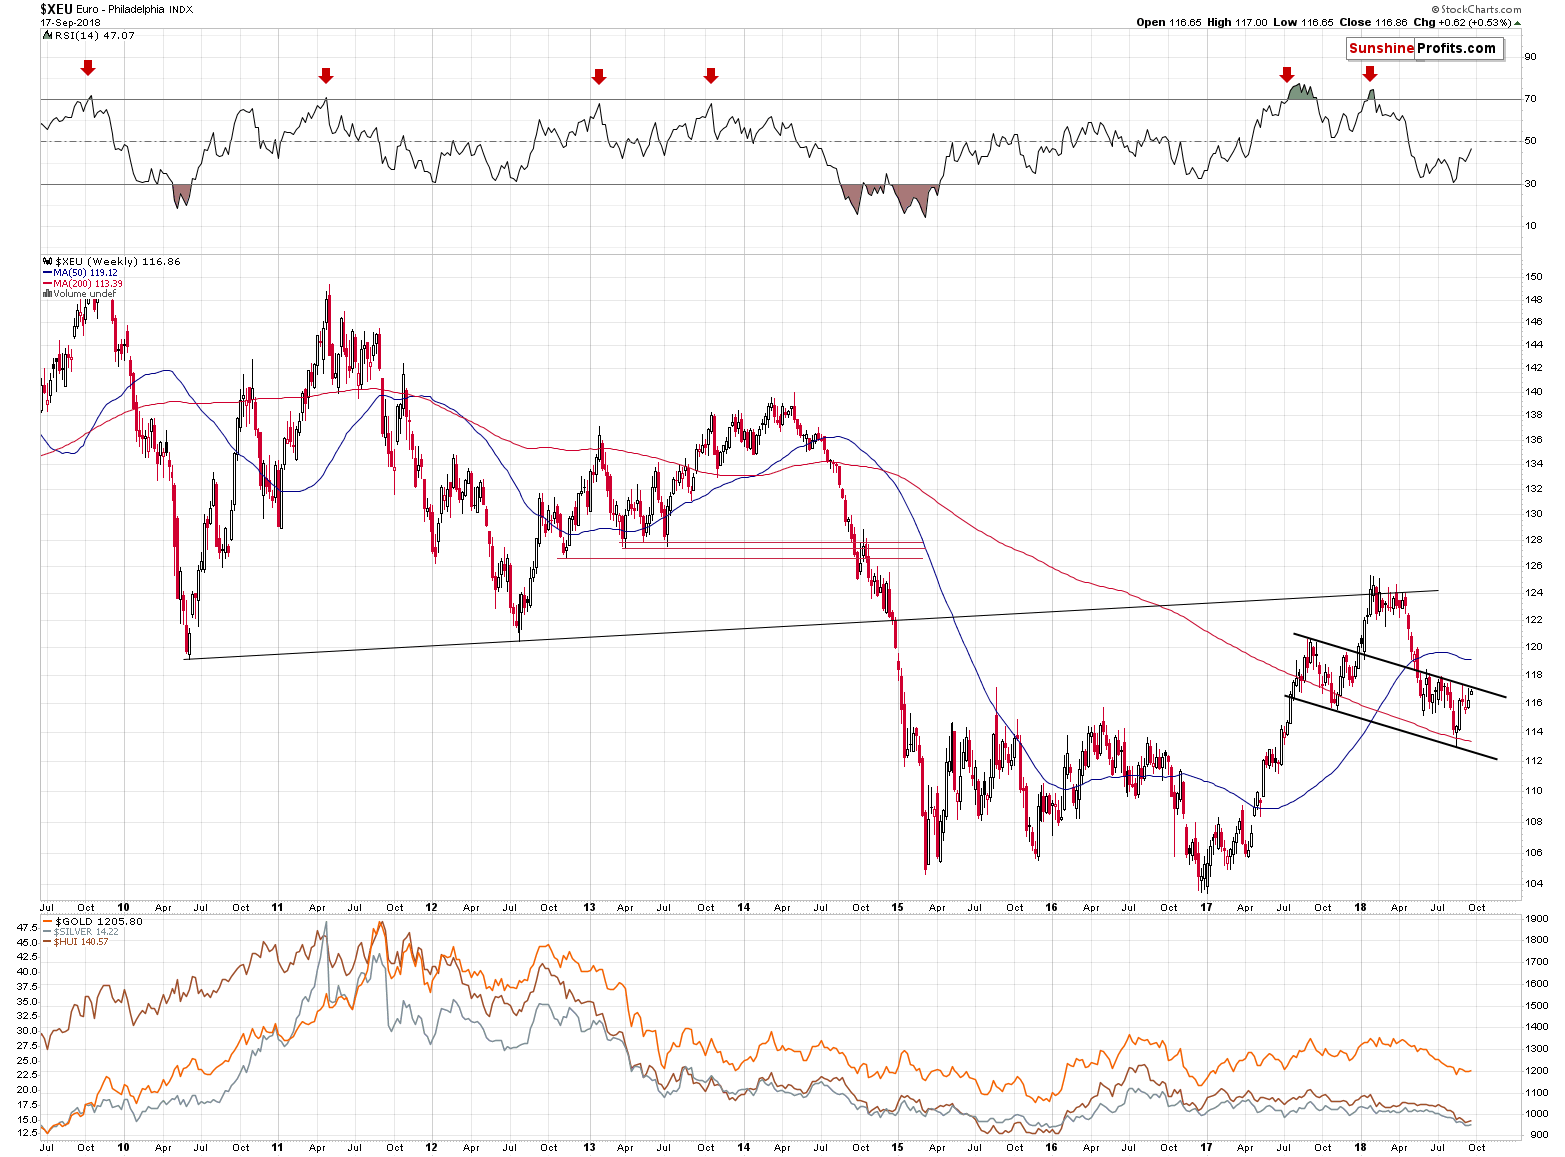
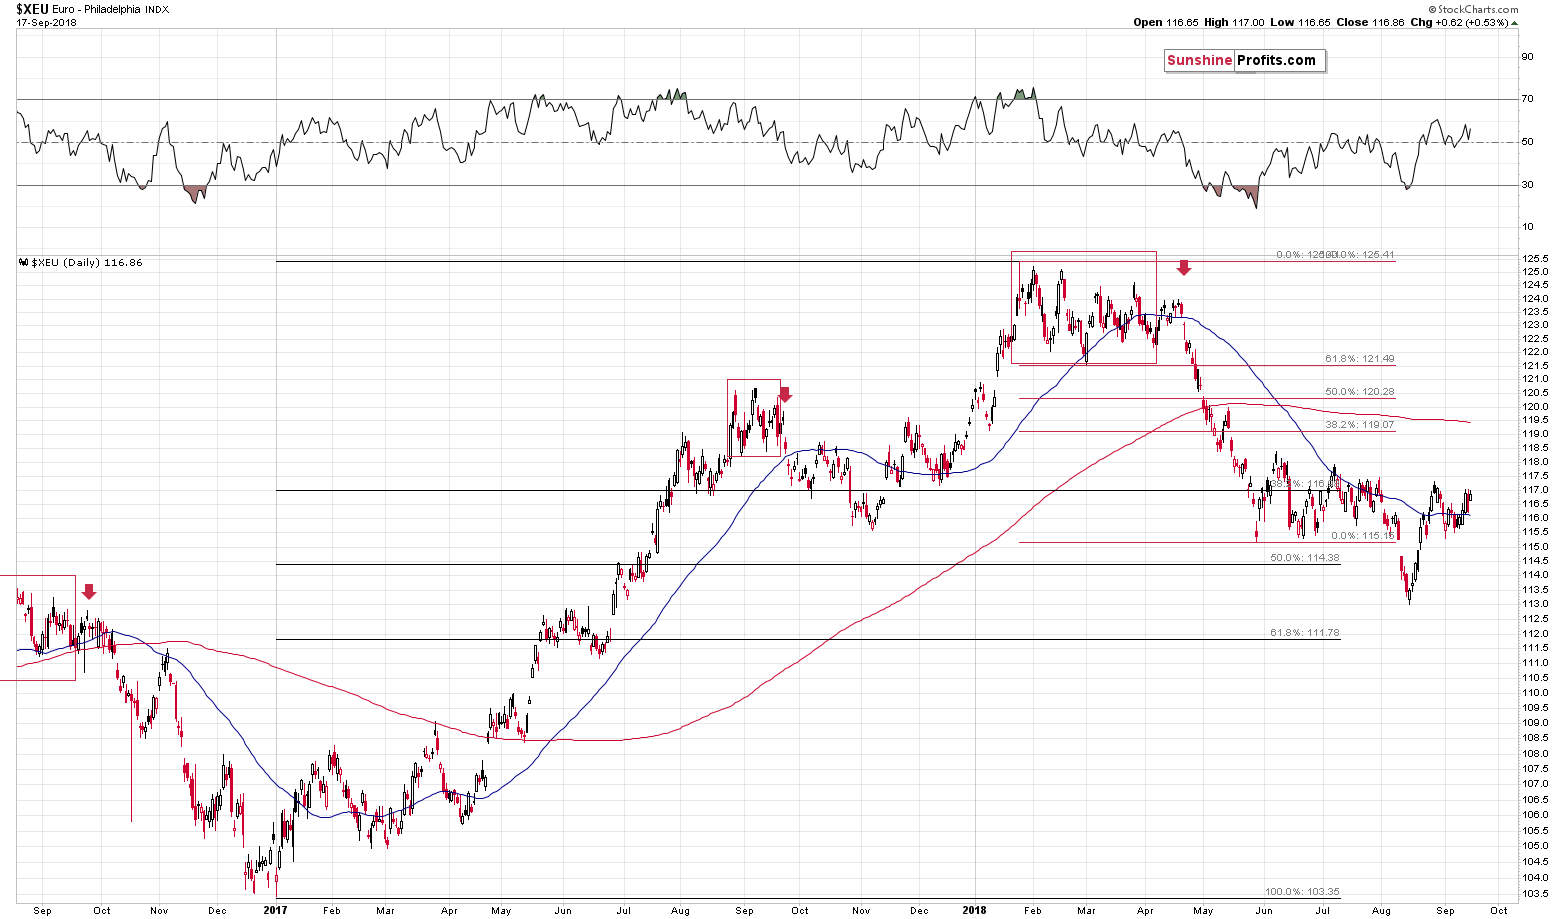
Zooming out we see that the line created as parallel to the line based on two important bottoms was not broken and it continues to serve as resistance. We expect to see a turnaround and sizable declines in the European currency shortly.
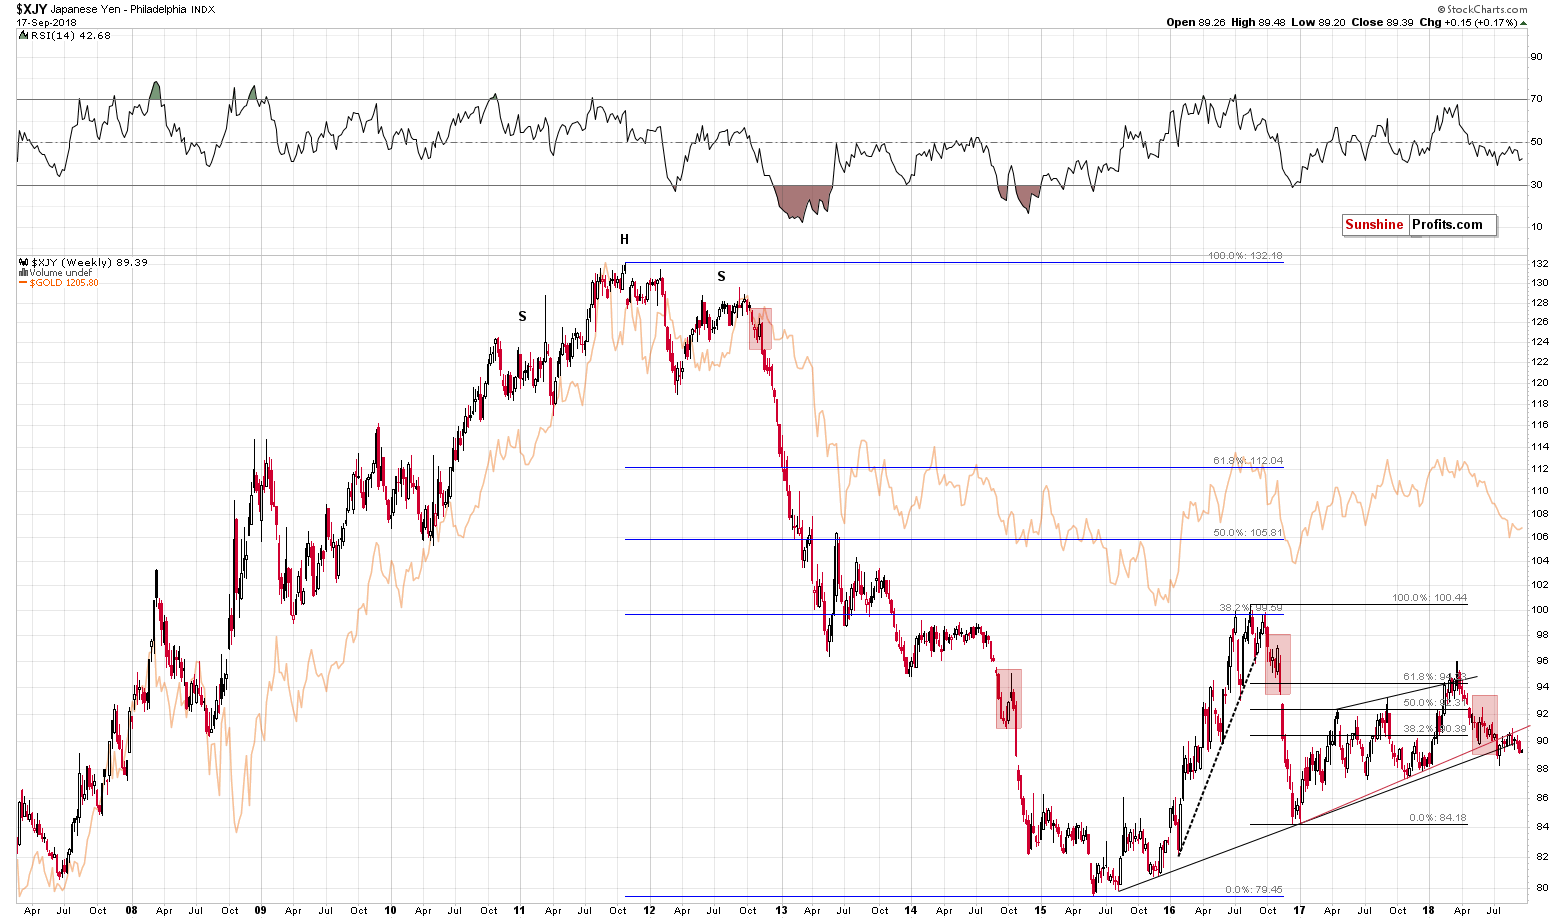
The Japanese yen moved higher, but the move was too small (less than 0.2%) to change anything. The implications of last week’s breakdown remain up-to-date and are bearish for the yen (and bullish for the USD/JPY currency exchange rate). As a reminder, the Japanese yen ended the previous week visibly below the rising black support line that’s based on very important bottoms from 2015 and 2016. Since the support line is based on such important bottoms, it’s also very important itself. And, since the weekly closing prices are more important than the daily closing prices, what we saw last week was profoundly bearish for the following weeks. Yesterday’s performance didn’t change it at all.
The implications are bearish for the precious metals market due to the link between the yen and the price of gold (you can see the latter in the background of the above chart and it’s immediately clear that it moves in tune with the value of the Japanese currency).
Summing up, the situation on the precious metals market remains very bearish, despite yesterday’s move higher in the mining stocks. Similar developments happened recently right before major declines and there were no other bullish signs in case of the other parts of the precious metals market and we haven’t seen any changes in the currency markets either. It seems that the big profits on our short positions will become much bigger before this trade is completely over.
As always, we’ll keep you – our subscribers – informed.
To summarize:
Trading capital (supplementary part of the portfolio; our opinion): Full short positions (250% of the full position) in gold, silver and mining stocks are justified from the risk/reward perspective with the following stop-loss orders and exit profit-take price levels:
- Gold: profit-take exit price: $1,062; stop-loss: $1,226; initial target price for the DGLD ETN: $82.96; stop-loss for the DGLD ETN $53.67
- Silver: profit-take exit price: $12.72; stop-loss: $15.16; initial target price for the DSLV ETN: $46.97; stop-loss for the DSLV ETN $31.37
- Mining stocks (price levels for the GDX ETF): profit-take exit price: $13.12; stop-loss: $19.61; initial target price for the DUST ETF: $80.97; stop-loss for the DUST ETF $33.37
Note: the above is a specific preparation for a possible sudden price drop, it does not reflect the most likely outcome. You will find a more detailed explanation in our August 1 Alert. In case one wants to bet on junior mining stocks’ prices (we do not suggest doing so – we think senior mining stocks are more predictable in the case of short-term trades – if one wants to do it anyway, we provide the details), here are the stop-loss details and target prices:
- GDXJ ETF: profit-take exit price: $17.52; stop-loss: $29.43
- JDST ETF: initial target price: $154.97 stop-loss: $64.88
Long-term capital (core part of the portfolio; our opinion): No positions (in other words: cash)
Insurance capital (core part of the portfolio; our opinion): Full position
Important Details for New Subscribers
Whether you already subscribed or not, we encourage you to find out how to make the most of our alerts and read our replies to the most common alert-and-gold-trading-related-questions.
Please note that the in the trading section we describe the situation for the day that the alert is posted. In other words, it we are writing about a speculative position, it means that it is up-to-date on the day it was posted. We are also featuring the initial target prices, so that you can decide whether keeping a position on a given day is something that is in tune with your approach (some moves are too small for medium-term traders and some might appear too big for day-traders).
Plus, you might want to read why our stop-loss orders are usually relatively far from the current price.
Please note that a full position doesn’t mean using all of the capital for a given trade. You will find details on our thoughts on gold portfolio structuring in the Key Insights section on our website.
As a reminder – “initial target price” means exactly that – an “initial” one, it’s not a price level at which we suggest closing positions. If this becomes the case (like it did in the previous trade) we will refer to these levels as levels of exit orders (exactly as we’ve done previously). Stop-loss levels, however, are naturally not “initial”, but something that, in our opinion, might be entered as an order.
Since it is impossible to synchronize target prices and stop-loss levels for all the ETFs and ETNs with the main markets that we provide these levels for (gold, silver and mining stocks – the GDX ETF), the stop-loss levels and target prices for other ETNs and ETF (among other: UGLD, DGLD, USLV, DSLV, NUGT, DUST, JNUG, JDST) are provided as supplementary, and not as “final”. This means that if a stop-loss or a target level is reached for any of the “additional instruments” (DGLD for instance), but not for the “main instrument” (gold in this case), we will view positions in both gold and DGLD as still open and the stop-loss for DGLD would have to be moved lower. On the other hand, if gold moves to a stop-loss level but DGLD doesn’t, then we will view both positions (in gold and DGLD) as closed. In other words, since it’s not possible to be 100% certain that each related instrument moves to a given level when the underlying instrument does, we can’t provide levels that would be binding. The levels that we do provide are our best estimate of the levels that will correspond to the levels in the underlying assets, but it will be the underlying assets that one will need to focus on regarding the signs pointing to closing a given position or keeping it open. We might adjust the levels in the “additional instruments” without adjusting the levels in the “main instruments”, which will simply mean that we have improved our estimation of these levels, not that we changed our outlook on the markets. We are already working on a tool that would update these levels on a daily basis for the most popular ETFs, ETNs and individual mining stocks.
Our preferred ways to invest in and to trade gold along with the reasoning can be found in the how to buy gold section. Additionally, our preferred ETFs and ETNs can be found in our Gold & Silver ETF Ranking.
As a reminder, Gold & Silver Trading Alerts are posted before or on each trading day (we usually post them before the opening bell, but we don't promise doing that each day). If there's anything urgent, we will send you an additional small alert before posting the main one.
=====
Latest Free Trading Alerts:
Last week was full of interesting economic data. We analyze them to show that gold bulls have to be patient. The data suggest that the US economy remains healthy. So far.
=====
Thank you.
Sincerely,
Przemyslaw Radomski, CFA
Founder, Editor-in-chief, Gold & Silver Fund Manager
Gold & Silver Trading Alerts
Forex Trading Alerts
Oil Investment Updates
Oil Trading Alerts

