

Briefly: in our opinion, full (300% of the regular position size) speculative short positions in junior mining stocks are justified from the risk/reward point of view at the moment of publishing this Alert. I’m slightly adjusting the downside targets for JDST and ZSL (no changes in other targets; that’s an adjustment based only on the current price path during this decline).
In yesterday’s analysis, I wrote about how the current situation is similar to what happened in 2008 and what we can learn from that. Today, after another increase in our profits, I’d like to show you that there are quite a few fundamental similarities to 2008, which only increases the importance of my yesterday’s comments.
Tick-Tock
It’s decision day for the FOMC, as a 50 or 75 basis point rate hike is likely a done deal. Moreover, with the U.S. economic clock counting down the seconds until a recession, the Fed’s rate hike cycle should be the straw that breaks the camel’s back. To that point, with interest rates rising rapidly in recent days, the medium-term effects should be profound.
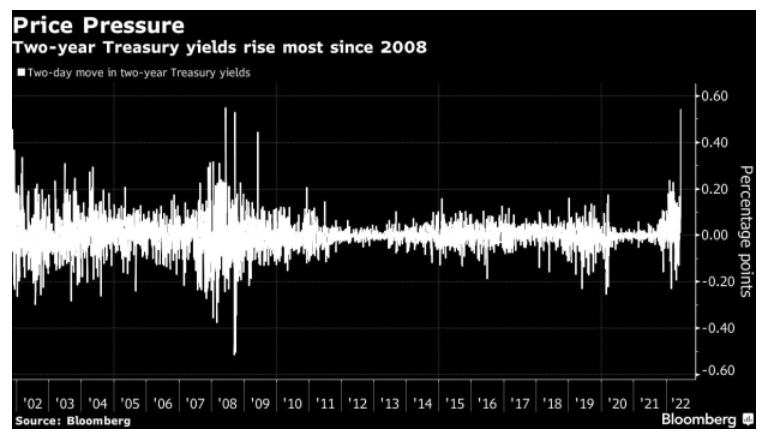
For example, the U.S. 2-Year Treasury yield rallied by 54 basis points combined on Jun. 10 and Jun. 13 – the largest two-day increase since 2008 (the white bar on the right side of the chart below). As a result, panic percolated throughout the bond market.
Please see below:
Likewise, the drama continued on Jun. 14, as U.S. Treasury yields increased across the board. Thus, investors have taken front-running the Fed to a whole new level.
Please see below:
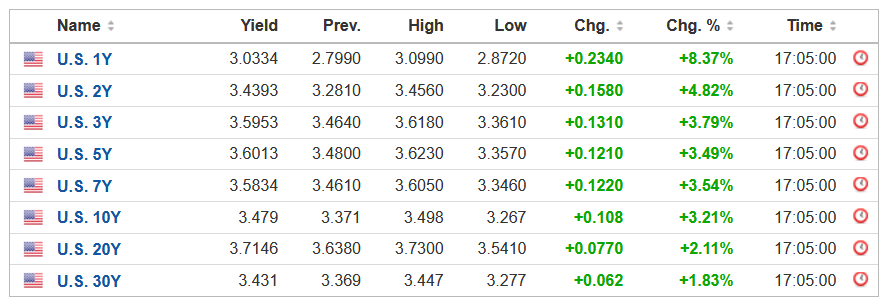 Source: Investing.com
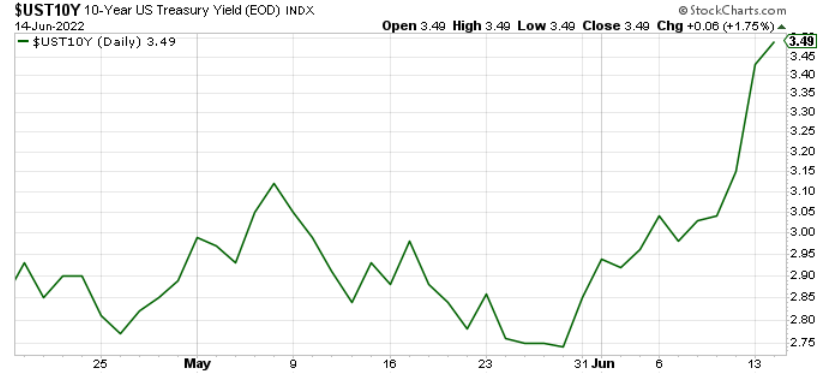
Furthermore, the U.S. 10-Year Treasury yield continued its ascent, and I warned on Apr. 20 that more carnage would unfold. I wrote:
Plenty of technical damage has been done, and the data could be used to support higher bond prices and lower long-term interest rates. However, even if oversold conditions elicit a short-term rally, the medium-term fundamentals remain intact.
Please see below:
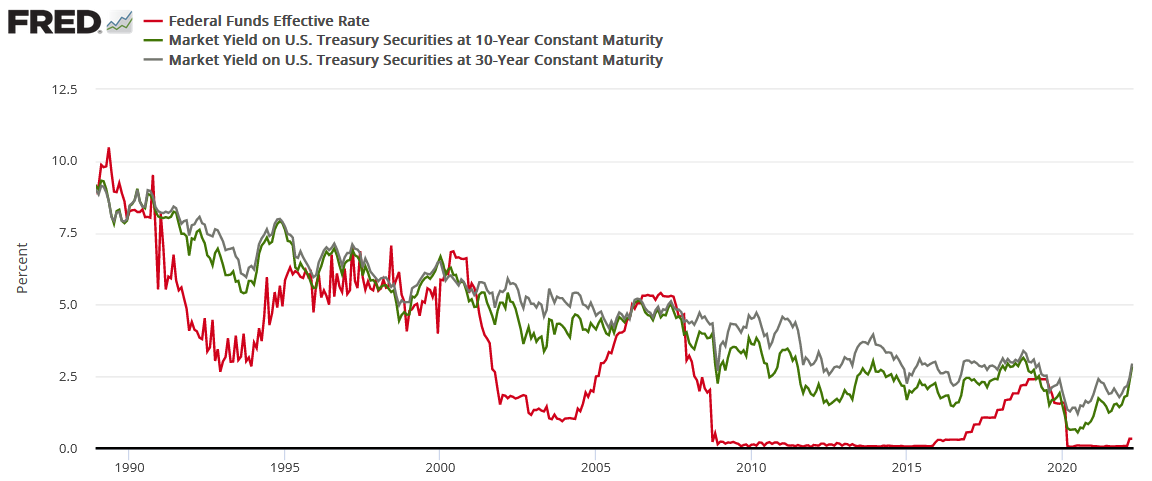
To explain, the red line above tracks the U.S. federal funds rate, while the green and gray lines above track the U.S. 10-Year and 30-Year Treasury yields. If you analyze the connection, you can see that the latter two often take their orders from the former. In a nutshell: when the Fed raises interest rates, it takes several hikes of 0.25% before long-term yields rollover. For example:
- In 2018, the U.S. 10-Year Treasury yield peaked after ~9 rate hikes.
- In 2006, the U.S. 10-Year Treasury yield peaked after ~17 rate hikes.
- In 2000, the U.S. 10-Year Treasury yield peaked after ~7 rate hikes.
- In 1994, the U.S. 10-Year Treasury yield peaked after ~12 rate hikes.
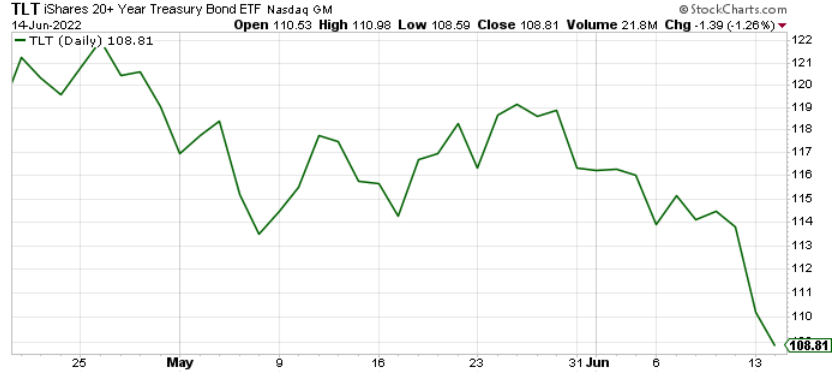
For context, I'm prioritizing the U.S. 10-Year Treasury yield because its real yield is what we use to value gold. However, if you focus your attention on the red and gray lines above, you can see that the 10-and-30-year nominal yields have a tight relationship. As a result, it's an ominous medium-term sign for TLT.
Thus, with modern history showcasing that the U.S. 10-Year Treasury yield doesn't peak until the Fed is well within its rate hike cycle, please remember that the Fed has only hiked once. Therefore,with seven rate hikes as the minimum to elicit a peak over the last ~28 years, the U.S. 10-Year Treasury yield should have room to run, and this is bullish for real yields and bearish for gold.
As such, with the prediction proving prescient, the Treasury benchmark has behaved as expected.
Please see below:
In addition, TLT has gone in the opposite direction:
More importantly, the U.S. 10-Year breakeven inflation rate has also suffered amid the hawkish re-pricings, ending the Jun. 14 session at 2.60%.
Please see below:
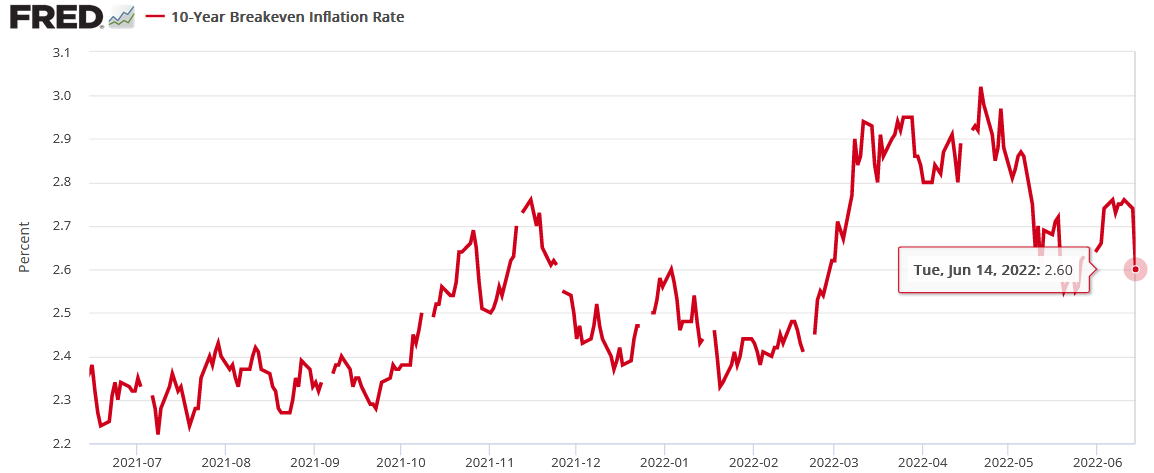
Therefore, the U.S. 10-Year real yield hit another 2022 high of 0.89%,and the PMs’ medium-term fundamental outlooks remain profoundly bearish.
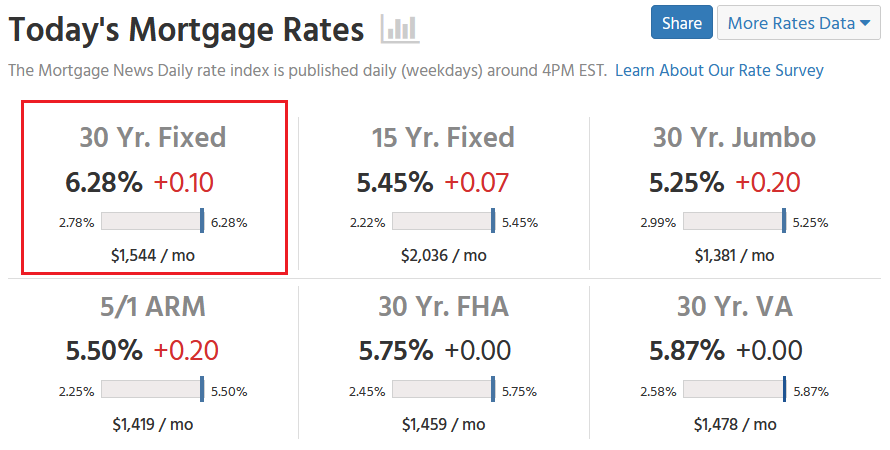
Also, the tremors in the bond market matter because they spread throughout the real economy. Thus, the implications of higher interest rates should help underwrite the next U.S. recession. Case in point: Mortgage News Daily reported on Jun. 14 that the 30-year fixed mortgage rate “moved above 6% yesterday for the first time since 2008.”
Moreover: “Today was just an addendum by comparison, but an unpleasant one in which rates moved even higher into the 6% range” the report stated. “The average lender is quoting top tier 30-yr fixed rates in the 6.25-6.375% range.”
Please see below:
 Source: Mortgage News Daily
In addition:
“The fate of the current trend will be determined by the Fed tomorrow – at least in the short term. There are several avenues through which the Fed could surprise the market, but it's worth noting that some of those surprises could be good for rates as well. Either way, expect a substantial amount of volatility tomorrow afternoon starting at 2pm.”
Inflation and More Inflation
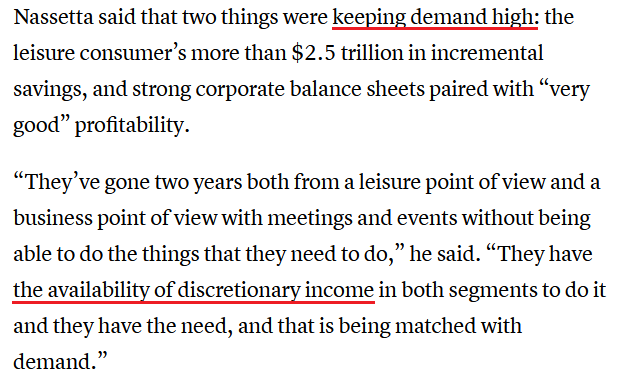
While I’ve been warning for months that inflation would showcase its might, investors have awoken to the harsh realities. Moreover, Hilton CEO Chris Nassetta said on Jun. 9 that the hotel chain will “have the biggest summer we’ve ever seen in our 103-year history this summer.”
“The price has gone up for everything, so we’re not different than when you go to a gas pump or the grocery store or any other aspect of life; it’s discretionary.”
Moreover, while I warned on numerous occasions that U.S. consumers were in better shape than many predicted, Nassetta noted that demand for accommodations is fueling the price increases.
Please see below:
 Source: CNBC
Likewise, Marriott CEO Tony Capuano added that over Memorial Day weekend the company’s revenue per available room increased by ~25% versus 2019. “I think as long as we’re delivering on service, which can be challenged in markets where labor is difficult, we continue to see really remarkable pricing,” he said.
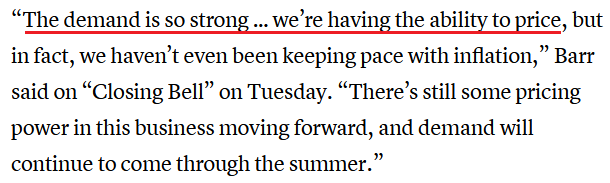
Making three of a kind, IHG Hotels & Resorts CEO Keith Barr said robust demand should fuel more price increases in the summer months.
Please see below:
 Source: CNBC
Therefore, while I continuously warned that market participants underestimated the demand side of the equation, they’re waking up to the reality that inflation won’t abate on its own. As a result, the ball is in the Fed’s court, and we know how it usually ends.
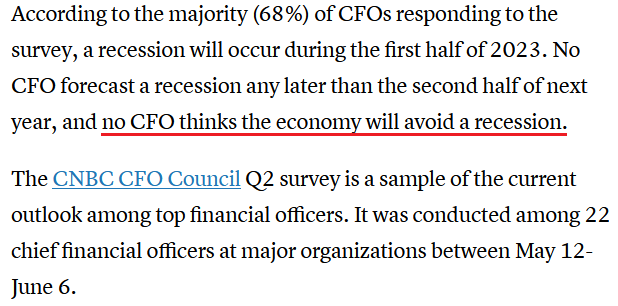
To that point, CNBC released its CFO Council Survey on Jun. 9. An excerpt read:
“Over 40% of chief financial officers cite inflation as the No. 1 external risk to their business” and “almost one-quarter (23%) of CFOs cite Federal Reserve policy as the biggest risk factor.”
As a result, our analysis is now the consensus.
Please see below:
 Source: CNBC
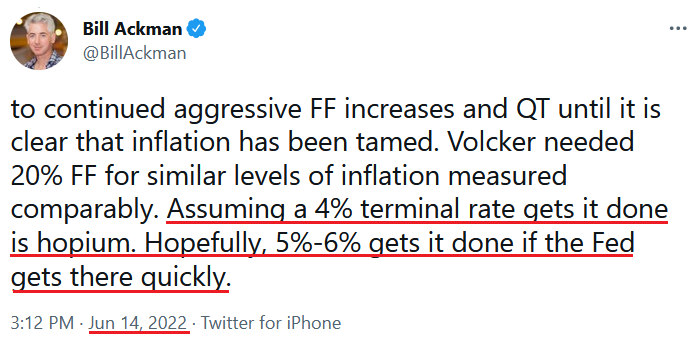
On top of that, I noted previously that billionaire hedge fund manager Bill Ackman shares our view of how demand destruction eventually cools inflation. In a nutshell: the Fed must do the heavy lifting, as patience will only embolden commodity investors and exacerbate the inflationary spiral.
Furthermore, Ackman added on Jun. 14 that “The [Fed] has allowed inflation to get out of control. Equity and credit markets have therefore lost confidence in the Fed. Market confidence can be restored if the Fed takes aggressive action with 75 bps tomorrow and in July, and a commitment to continued aggressive [federal funds rate] FF increases and QT until it is clear that inflation has been tamed.”
As a result, while I’ve long warned that nearly 70 years of data shows the U.S. federal funds rate needs to rise above the year-over-year (YoY) percentage change in the headline Consumer Price Index (CPI) to curb inflation, Ackman expects a similar outcome.
A Potential Short Squeeze
With the recent carnage across the financial markets rattling the bulls, sentiment and positioning are extremely stretched. Therefore, while a ‘sell the rumor, buy the news’ event may unfold, it’s prudent to stay focused on the S&P 500 and the GDXJ ETF’s medium-term downtrends.
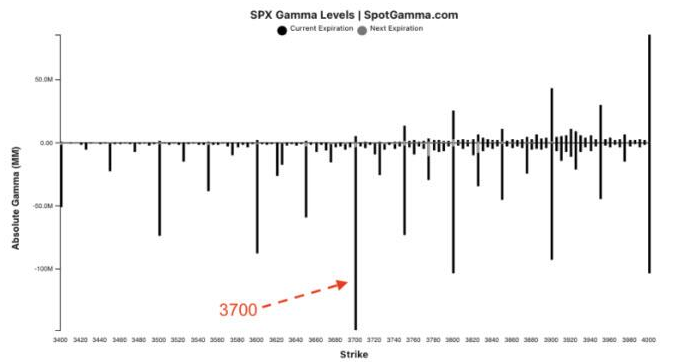
For example, a heavy dose of S&P 500 put options expire on Jun. 17, and dealers may want to push the market higher to avoid paying out. Moreover, SpotGamma notes that 3,700+ is where most strike prices land, so a short-term squeeze reduces dealers’ potential losses.
Please see below:
Second, Nomura's Cross-Asset Macro Strategist Charlie McElligott noted that CTAs (quite often quant investors) have estimated net-short positions near the low-end of the historical range. As a result, the algorithms could cover and fuel a short-term spike.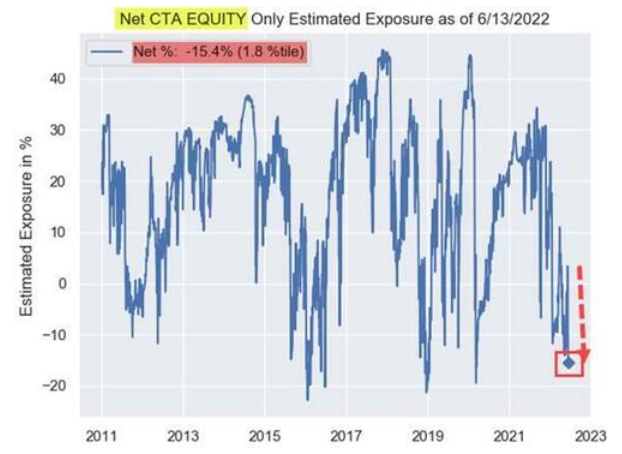 Source: Nomura
Finally, the liquidation frenzy (margin calls) that erupted recently coincided with hedge funds going on the largest two-day selling spree on record. If you analyze the chart below, you can see that Goldman Sachs’ prime brokerage data shows the z-score of combined net dollars sold on Jun. 10 and Jun. 13 exceeded the sell-off following the collapse of Lehman Brothers in 2008.
Thus, while it’s far from a sure thing, it’s prudent to note how these variables may impact the short-term price action.
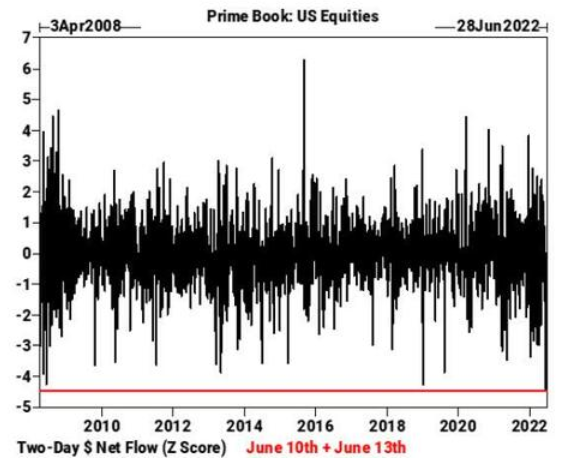 Source: Goldman Sachs
The Bottom Line
Volatile moves in interest rates have the potential to turn day into night. Moreover, when earthquakes cause sharp swings in asset prices and mortgage rates, we move closer to a U.S. recession. Therefore, while liquidations alone are profoundly bearish for the PMs, the U.S. 10-Year real yield has become unhinged, and the USD Index is gunning for new 2022 highs. As such, storm clouds are growing darker by the day.
In conclusion, the PMs declined on Jun. 14, and the GDXJ ETF underperformed once again (and profits on our short positions increased once again). Moreover, while positioning and sentiment may elicit a short-term relief rally, Fed Chairman Jerome Powell could channel a more hawkish tone and create the opposite. Either way, while the day-to-day is extremely difficult to predict, the S&P 500 and the PMs should confront lower prices in the months ahead.
Technically Speaking
It’s the Fed’s decision day, so we can expect to see lots of volatility in both directions, not only after the interest rate decision and during the following conference, but also beforehand, when investors try to guess what the Fed will do and say.
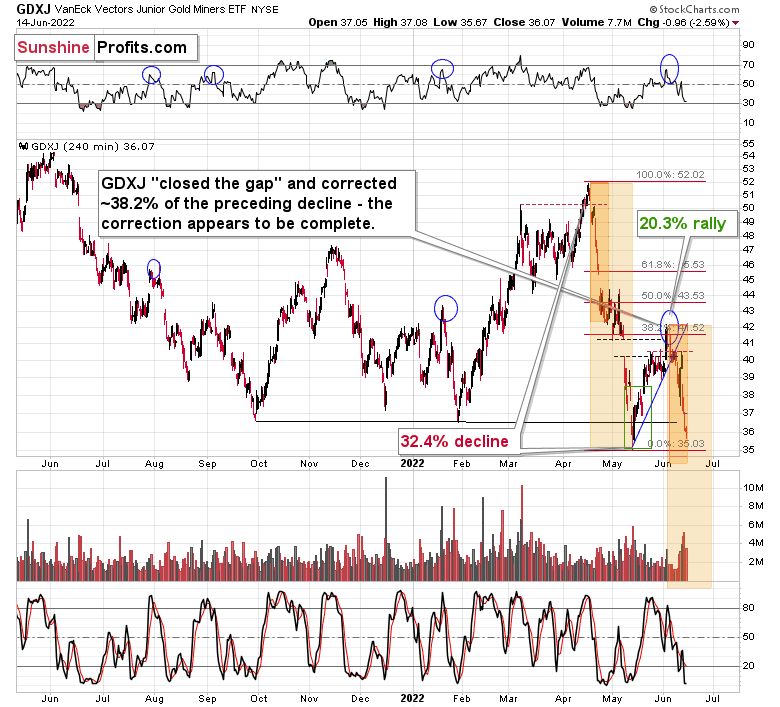
Yesterday’s close in the GDXJ was the second-lowest close that we saw this year. Junior miners also broke – once again – below the early-2022 and late-2021 lows. Will this breakdown be completed?
Eventually? That’s extremely likely. This week? It’s still likely, but it’s not as clear.
You see, even if the Fed hikes the rates by 0.75%, we could see an immediate decline, but that is then followed by a corrective rally, based on the “hey, at least it’s not 1%” approach and the fact that junior miners are so close to their previous lows.
What’s a trader to do given the above possibility?
Naturally, everyone will make the decision themselves, but in my opinion, what I wrote yesterday about the downside targets, remains intact. It is not the point to catch all the tiny corrections, but to focus on the ones that provide very good risk-to-reward ratios.
Consequently, I don’t plan to exit the short position even in the case of an immediate-term reversal or a rally. The analogies to 2008 indicate that it might be a good idea to do so when the GDXJ is trading close to the $27 level and when gold is trading close to its 2021 lows (below $1,700).
In other words, if gold declines to $1,650-1,690 today (and yes, that’s possible), then I will consider temporarily exiting the short position, but if that doesn’t happen, then I’ll probably not change the current position and I’ll simply let profits grow over time.
Naturally, as always, I’ll keep you – my subscribers – informed.
Overview of the Upcoming Part of the Decline
- It seems to me that the short-term rally in the precious metals market is over.
- We’re likely to (if not immediately, then soon) see another big slide, perhaps close to the 2021 lows ($1,650 - $1,700).
- If we see a situation where miners slide in a meaningful and volatile way while silver doesn’t (it just declines moderately), I plan to – once again – switch from short positions in miners to short positions in silver. At this time, it’s too early to say at what price levels this could take place and if we get this kind of opportunity at all – perhaps with gold prices close to $1,600.
- I plan to exit all remaining short positions once gold shows substantial strength relative to the USD Index while the latter is still rallying. This may be the case with gold close to $1,400. I expect silver to fall the hardest in the final part of the move. This moment (when gold performs very strongly against the rallying USD and miners are strong relative to gold after its substantial decline) is likely to be the best entry point for long-term investments, in my view. This can also happen with gold close to $1,400, but at the moment it’s too early to say with certainty.
- The above is based on the information available today, and it might change in the following days/weeks.
You will find my general overview of the outlook for gold on the chart below:
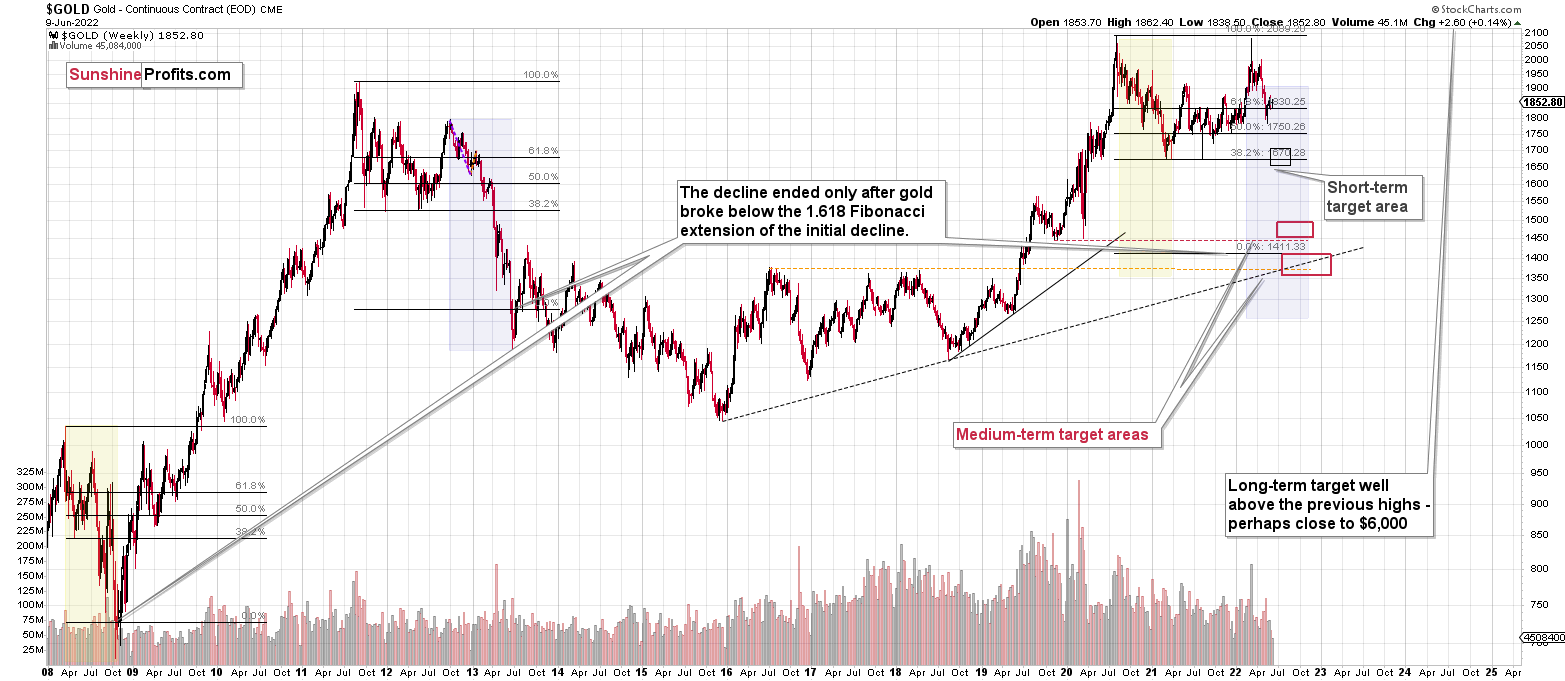
Please note that the above timing details are relatively broad and “for general overview only” – so that you know more or less what I think and how volatile I think the moves are likely to be – on an approximate basis. These time targets are not binding or clear enough for me to think that they should be used for purchasing options, warrants, or similar instruments.
Summary
Summing up, it seems to me that the short-term rally in the precious metals market is over, and the decline will now continue.
I previously wrote that the profits from the previous long position (congratulations once again) were likely to further enhance the profits on this huge decline, and that’s exactly what happened. The profit potential with regard to the upcoming gargantuan decline remains huge.
As investors are starting to wake up to reality, the precious metals sector (particularly junior mining stocks) is declining sharply. Here are the key aspects of the reality that market participants have ignored:
- rising real interest rates,
- rising USD Index values.
Both of the aforementioned are the two most important fundamental drivers of the gold price. Since neither the USD Index nor real interest rates are likely to stop rising anytime soon (especially now that inflation has become highly political), the gold price is likely to fall sooner or later. Given the analogy to 2012 in gold, silver, and mining stocks, “sooner” is the more likely outcome.
After the final sell-off (that takes gold to about $1,350-$1,500), I expect the precious metals to rally significantly. The final part of the decline might take as little as 1-5 weeks, so it's important to stay alert to any changes.
As always, we'll keep you – our subscribers – informed.
To summarize:
Trading capital (supplementary part of the portfolio; our opinion): Full speculative short positions (300% of the full position) in junior mining stocks are justified from the risk to reward point of view with the following binding exit profit-take price levels:
Mining stocks (price levels for the GDXJ ETF): binding profit-take exit price: $27.32; stop-loss: none (the volatility is too big to justify a stop-loss order in case of this particular trade)
Alternatively, if one seeks leverage, we’re providing the binding profit-take levels for the JDST (2x leveraged). The binding profit-take level for the JDST: $18.35; stop-loss for the JDST: none (the volatility is too big to justify a SL order in case of this particular trade).
For-your-information targets (our opinion; we continue to think that mining stocks are the preferred way of taking advantage of the upcoming price move, but if for whatever reason one wants / has to use silver or gold for this trade, we are providing the details anyway.):
Silver futures downside profit-take exit price: $17.22
SLV profit-take exit price: $16.22
ZSL profit-take exit price: $41.47
Gold futures downside profit-take exit price: $1,706
HGD.TO – alternative (Canadian) 2x inverse leveraged gold stocks ETF – the upside profit-take exit price: $11.87
HZD.TO – alternative (Canadian) 2x inverse leveraged silver ETF – the upside profit-take exit price: $31.87
Long-term capital (core part of the portfolio; our opinion): No positions (in other words: cash)
Insurance capital (core part of the portfolio; our opinion): Full position
Whether you’ve already subscribed or not, we encourage you to find out how to make the most of our alerts and read our replies to the most common alert-and-gold-trading-related-questions.
Please note that we describe the situation for the day that the alert is posted in the trading section. In other words, if we are writing about a speculative position, it means that it is up-to-date on the day it was posted. We are also featuring the initial target prices to decide whether keeping a position on a given day is in tune with your approach (some moves are too small for medium-term traders, and some might appear too big for day-traders).
Additionally, you might want to read why our stop-loss orders are usually relatively far from the current price.
Please note that a full position doesn't mean using all of the capital for a given trade. You will find details on our thoughts on gold portfolio structuring in the Key Insights section on our website.
As a reminder - "initial target price" means exactly that - an "initial" one. It's not a price level at which we suggest closing positions. If this becomes the case (as it did in the previous trade), we will refer to these levels as levels of exit orders (exactly as we've done previously). Stop-loss levels, however, are naturally not "initial", but something that, in our opinion, might be entered as an order.
Since it is impossible to synchronize target prices and stop-loss levels for all the ETFs and ETNs with the main markets that we provide these levels for (gold, silver and mining stocks - the GDX ETF), the stop-loss levels and target prices for other ETNs and ETF (among other: UGL, GLL, AGQ, ZSL, NUGT, DUST, JNUG, JDST) are provided as supplementary, and not as "final". This means that if a stop-loss or a target level is reached for any of the "additional instruments" (GLL for instance), but not for the "main instrument" (gold in this case), we will view positions in both gold and GLL as still open and the stop-loss for GLL would have to be moved lower. On the other hand, if gold moves to a stop-loss level but GLL doesn't, then we will view both positions (in gold and GLL) as closed. In other words, since it's not possible to be 100% certain that each related instrument moves to a given level when the underlying instrument does, we can't provide levels that would be binding. The levels that we do provide are our best estimate of the levels that will correspond to the levels in the underlying assets, but it will be the underlying assets that one will need to focus on regarding the signs pointing to closing a given position or keeping it open. We might adjust the levels in the "additional instruments" without adjusting the levels in the "main instruments", which will simply mean that we have improved our estimation of these levels, not that we changed our outlook on the markets. We are already working on a tool that would update these levels daily for the most popular ETFs, ETNs and individual mining stocks.
Our preferred ways to invest in and to trade gold along with the reasoning can be found in the how to buy gold section. Furthermore, our preferred ETFs and ETNs can be found in our Gold & Silver ETF Ranking.
As a reminder, Gold & Silver Trading Alerts are posted before or on each trading day (we usually post them before the opening bell, but we don't promise doing that each day). If there's anything urgent, we will send you an additional small alert before posting the main one.
Thank you.
Przemyslaw Radomski, CFAFounder, Editor-in-chief

