

Briefly: in our opinion, full (300% of the regular position size) speculative short positions in junior mining stocks are justified from the risk/reward point of view at the moment of publishing this Alert.
After yesterday’s huge slide in the PMs (GDXJ declined by over 8%!) and a sizable increase in our short positions in junior miners, gold and silver are moving back and forth, gathering strength for the next move. Or waiting for the next trigger.
They are likely to get it tomorrow (Wednesday, June 15), as the Fed is about to make another interest rate decision. The word got out yesterday that the Fed might hike interest rates by 0.75% instead of just 0.5%, and the markets reacted accordingly. Stocks and PMs fell, while the USD Index rallied.
The best part is that you knew about the bigger rate hike before almost everyone else – I wrote about that in the extra analysis that I posted/sent out on Saturday. Quoting:
The next interest rate decision is this Wednesday, and it’s probably going to be very interesting. I wouldn’t be surprised if we saw a rate hike by more than 0.5% - for example by 0.75%. This might be enough to send a message to the market that they are serious about the inflation and have positive political implications. Whether that happens or not, the following conference will likely aim to rebuild investors’ confidence in the Fed. It might or might not work with regard to confidence, but it should be enough to trigger declines in the markets (including PMs) – after all that’s how hawkish surprises work.
Okay, so, the precious metals declined significantly, and now they paused. What’s next?
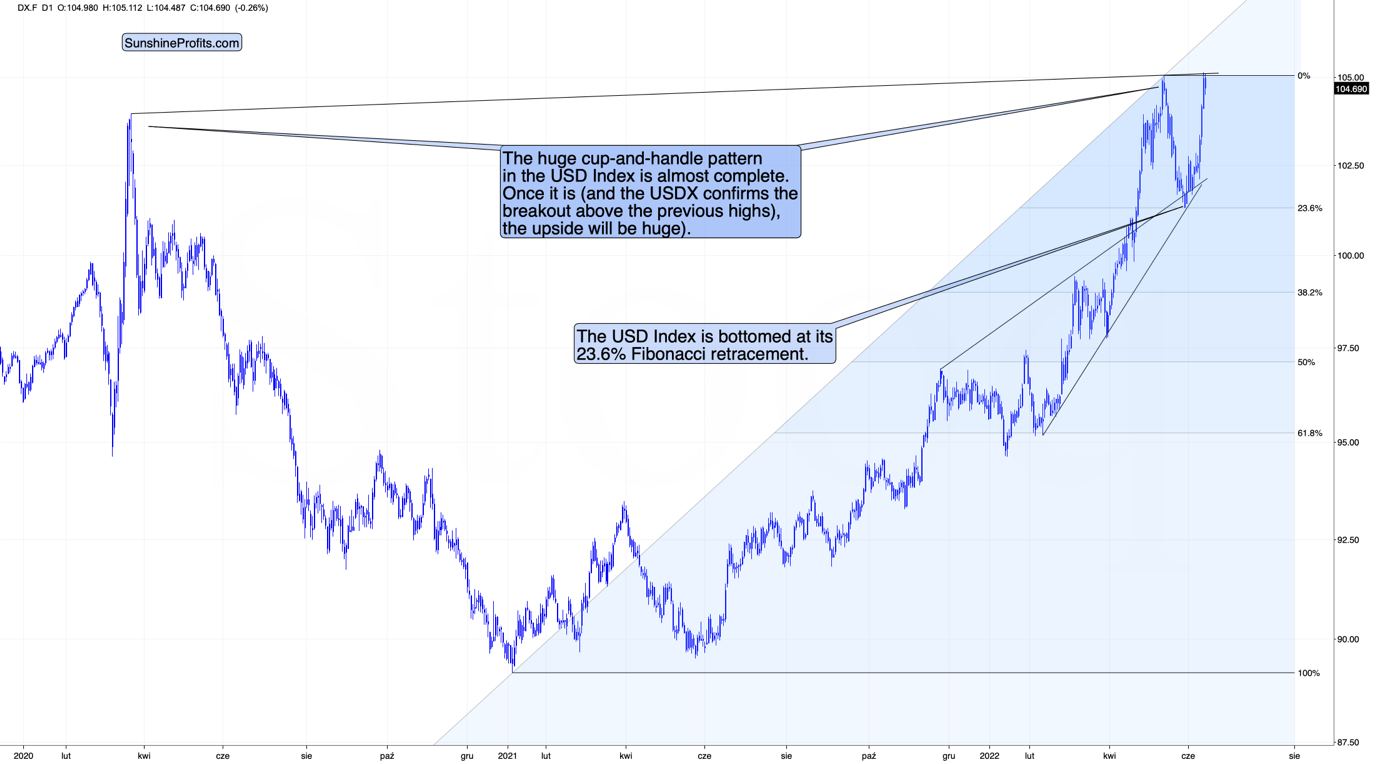
Well, they might take a breather today, but since the interest rate decision is tomorrow and – in my view – a 0.75% rate hike is indeed likely along with some hawkish rhetoric, the markets might tumble even more (and the USDX would be likely to rally further).
While in case of the USDX it will likely imply a breakout above the big cup-and-handle pattern, in case of the precious metals sector, it would likely open the way to another huge wave down.
In today’s analysis, however, I’d like to step back from my usual day-to-day comments (my previous thoughts on the market remain up-to-date) and feature a specific lesson from the 2008 decline that might be useful during the current slide.
To clarify, there are no guarantees that history will repeat itself, and I don’t guarantee any kind of performance, but history does tend to rhyme, so what we’ve seen so far might be a useful indication of what’s next.
First, let me emphasize that gold stocks are declining similarly to how they did in 2008.
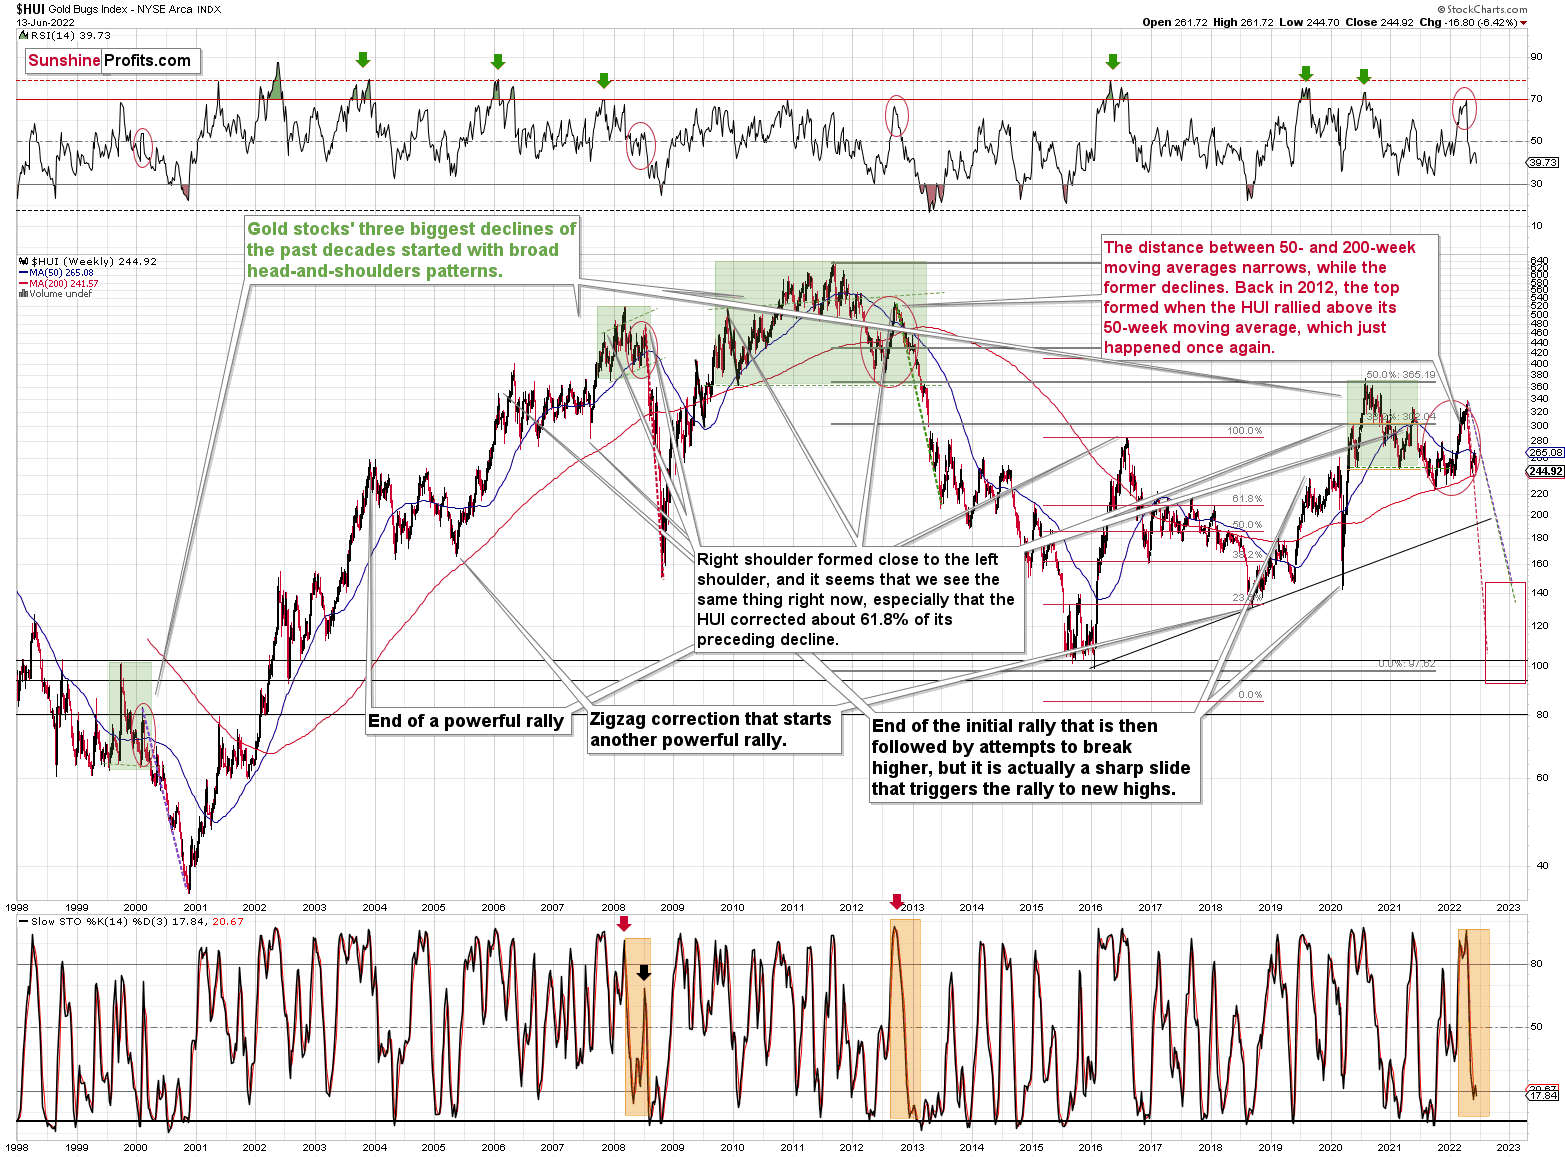
The Russian invasion triggered a rally, which was already erased, and if it wasn’t for it, the self-similarity would be very clear (note the head-and-shoulders patterns marked with green). Since the latter happened, it’s not as clear, but it seems that it’s still present. At least that’s what the pace of the current decline suggests.
I used a red dashed line to represent the 2008 decline, and copied it to the current situation. They are very similar. We even saw a corrective upswing from more or less the 200-week moving average (red line), just like what happened in 2008.
All right, let’s zoom in and see how mining stocks declined in 2008.

Back then, the GDXJ ETF was not yet trading, so I’m using the GDX ETF as a short-term proxy here.
The decline took about 3 months, and it erased about 70% of the miners’ value. The biggest part of the decline happened in the final month, though.
However, the really interesting thing about that decline – that might also be very useful this time – is that there were five very short-term declines that all took the GDX about 30% lower.
I marked those declines with red rectangles. After that, a corrective upswing started. During those corrective upswings, the GDX rallied by 14.8-41.6%. The biggest corrective upswing (where GDX rallied by 41.6%) was triggered by a huge rally in gold, and since I don’t expect to see anything similar this year, it could be the case that this correction size is an outlier. Not paying attention to the outlier, we get corrections of between 14.8% and 25.1%.
The interesting thing was that each corrective upswing was shorter (faster) than the preceding one.
The first one took 12 trading days. The second one took seven trading days. The third one took 2 trading days, and the fourth and final one took just 1 trading day.
Fast forward to the current situation. Let’s take a look at the GDXJ ETF.
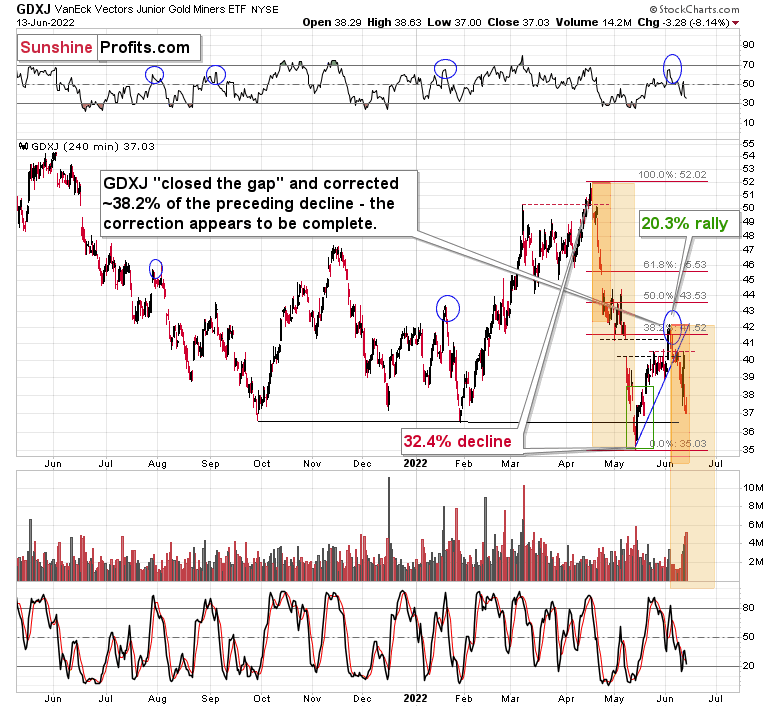
The GDXJ ETF declined by 32.4% and then corrected – it rallied by about 20.3%. The corrective upswing took 14 trading days.
The above is in perfect tune with the previous patterns seen in the GDX during the 2008 slide.
What does it tell us? It indicates that history can be rhymed, and while it will not be identical, we should pay attention to the indicators that worked in 2008. The next corrective upswing (a notable one, that is) might start when the GDXJ ETF declines by about 29-35% from its recent top. To clarify, I don’t claim that the above technique would be able to detect all corrective upswings, or that I aim to trade all of them. For instance, in my view, it was a good idea to enter a long position on May 12 and switch to a short position on May 26, but I wasn’t aiming to catch the intraday moves.
GDXJ could also decline a bit more than 29-35%, as let’s keep in mind that previous statistics are based on the GDX ETF and we are discussing the GDXJ here, and the latter is likely to decline even more than GDX as juniors are more correlated with the general stock market (and the latter is likely to slide).
So, let’s say that the GDXJ might decline between 29% and 40% from the recent high before triggering another notable corrective upswing (one that could take between 5 and 10 trading days based on how long the last one took and how big those corrections were in 2008).
The recent high was formed with the GDXJ ETF at $42.19. Applying the above-mentioned percentages to this price provides us with $24.78-29.32.
Now, is there any meaningful support level in this area that could stop the decline?
Yes!
The late-March 2020 low is at $26.62, and it provides significant short-term support within the analogy-based target area.
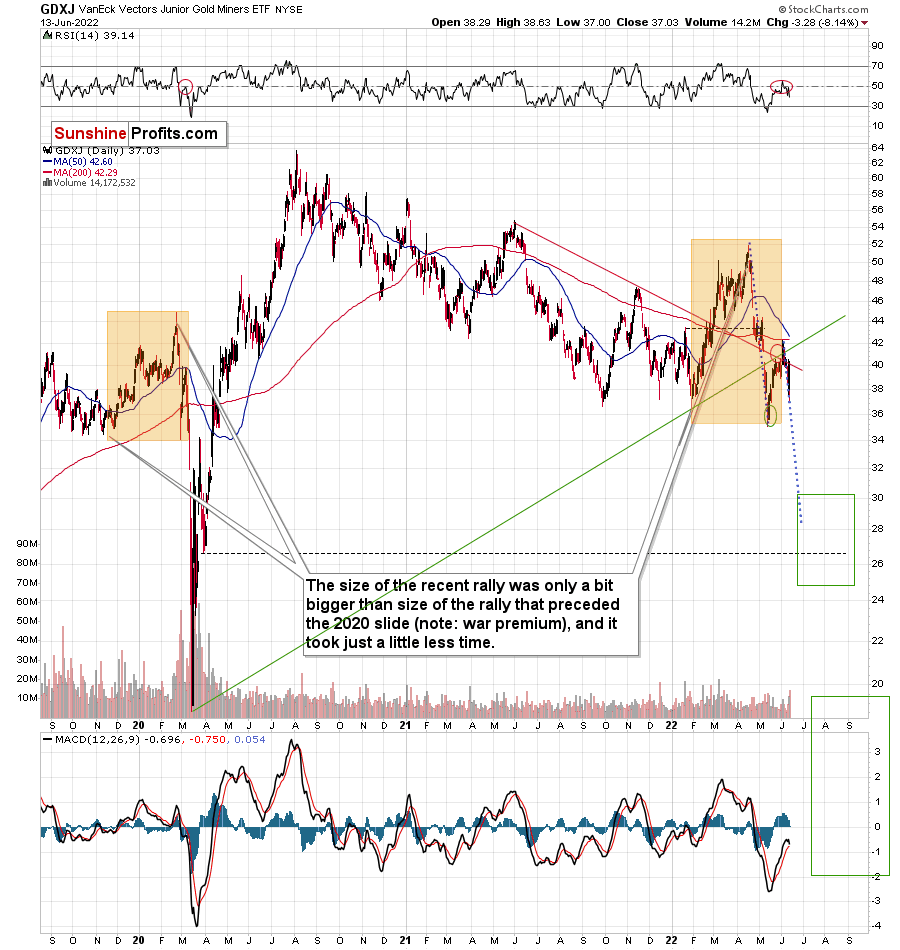
Additionally, the above corresponds – more or less – to the size of the decline that would match the size of the April-May decline. It would be only somewhat bigger.
Let’s keep in mind that gold stocks don’t necessarily move on their own, but rather move along with gold.
In the case of gold, a repeat of the April-May decline would imply a move to very strong support – the mid-2020 and 2021 lows. Prices below $1,700 stopped gold’s declines several times, and that would make at least a rebound likely once it’s reached that level.
Now, since the general stock market is about to slide, junior miners might be affected even more than gold, so it would make sense for one to expect them to decline somewhat more than gold (compared to what happened in April and May).
Consequently, the near-term (yes) target for the GDXJ at about $27 appears to make sense, and it seems that profits from the current short positions in the junior mining stocks will become even bigger soon.
Having said that, let’s take a look at the markets from a more fundamental point of view.
Blood on the Street
While I’ve been warning for months that raging inflation would elicit a raging reversal in risk-on sentiment, the bloodbath intensified on Jun. 13. With stocks battered, Bitcoin crushed, and the GDXJ ETF sinking by more than 8%, the technicals and the fundamentals have been the perfect pair in predicting these crashes.
Regarding the latter, I wrote on Oct. 26, 2021:
Originally, the Fed forecasted that it wouldn’t have to taper its asset purchases until well into 2022. However, surging inflation pulled that forecast forward. Now, the Fed forecasts that it won’t have to raise interest rates until well into 2023. However, surging inflation will likely pull that forecast forward as well.
Thus, with the hawkish realities taking a turn for the worse, the Wall Street Journal (WSJ) – the Fed’s unofficial mouthpiece – reported on Jun. 13 that a 75-basis-point rate hike by the FOMC may materialize on Wednesday.
Please see below:
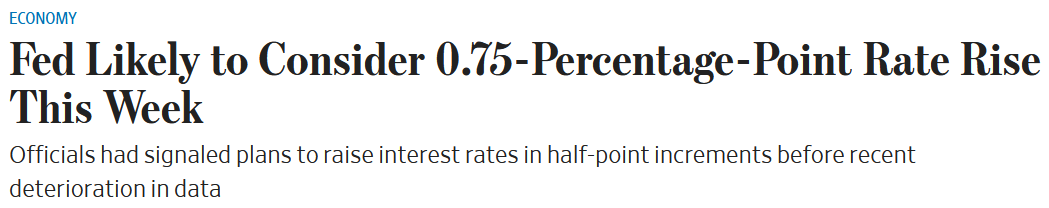 Source: WSJ
In response, the probability of a 75-basis-point increase this week soared to 85% on Jun. 13. As a result, the Fed may be in panic mode.
Please see below:
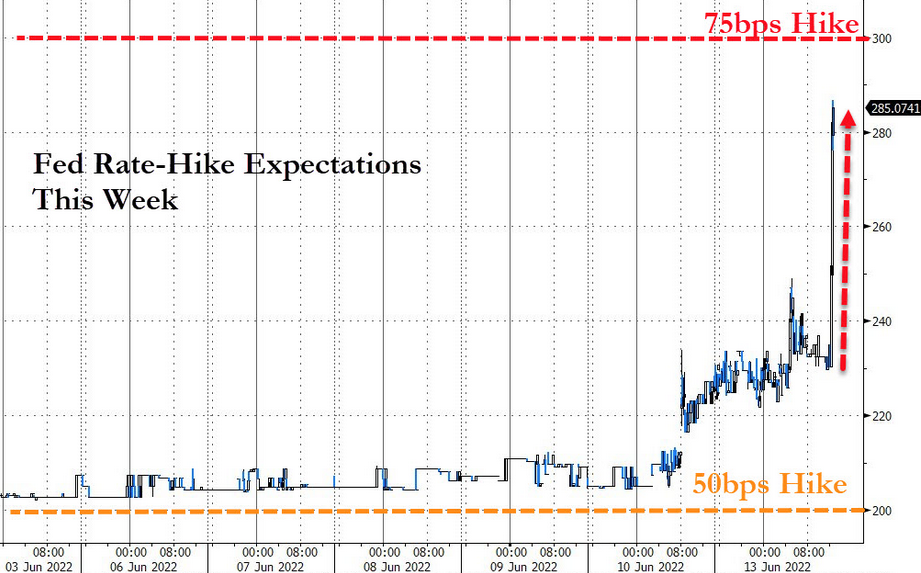 Source: Bloomberg/Zero Hedge
Furthermore, the fundamental carnage didn’t stop there. With bond investors responding to all of the above, U.S. Treasury yields surged on Jun. 13. For context, the 2-10, 3-10, 5-10, and 7-10 curves are inverted (recession signals), and the U.S. 2-Year Treasury yield hit its highest level since 2007.
Please see below:
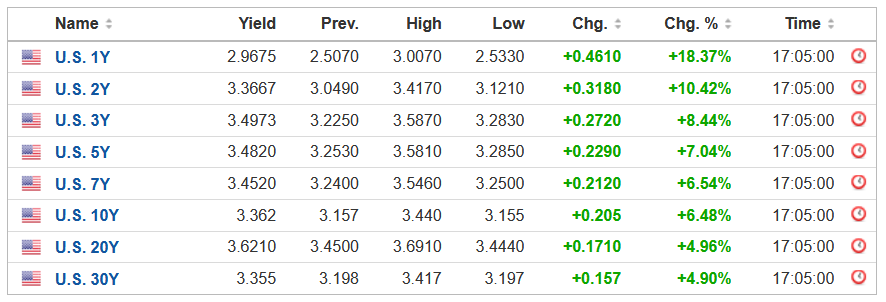 Source: Investing.com
On top of that, with the U.S. 10-Year Treasury yield ending the day at 3.36% – a new 2022 high – and the U.S. 10-Year breakeven inflation rate falling to 2.74%, the U.S. 10-Year real yield hit a new 2022 high of 0.62%.
Thus, while gold remains relatively resilient despite the bearish developments, silver and mining stocks’ prices reflect the fundamental calamities I warned about on Jan. 12. I wrote:
PMs are less volatile than speculative assets. However, it's important to remember that gold, silver, and mining stocks peaked amid the liquidity-fueled surge in the summer of 2020. Likewise, their uprisings coincided with real interest rates that were at all-time lows at the time.
Conversely, with the Fed's liquidity drain already unfolding and real interest rates poised to rise in the coming months, the PMs should suffer from the likely re-pricings. For example, when the U.S. 10-Year real yield was at 0% or higher from June 2013 until October 2018, gold was stuck below $1,400 during that timeframe and actually fell below $1,100. As a result, if the Fed pushes its hawkish chips into the middle, don't be surprised if the PMs fold in 2022.
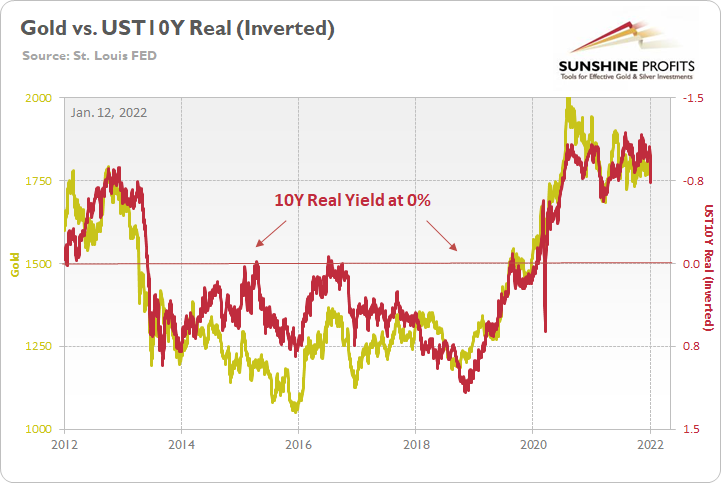
Thus, with the yellow metal behaving like it’s 2011-2012 all over again, it’s likely only a matter of time before a profound drawdown occurs. For your reference, gold and the U.S. 10-Year real yield have had a daily correlation of -0.91 since Jan. 1, 2007.
For more context, I wrote on Apr. 11:
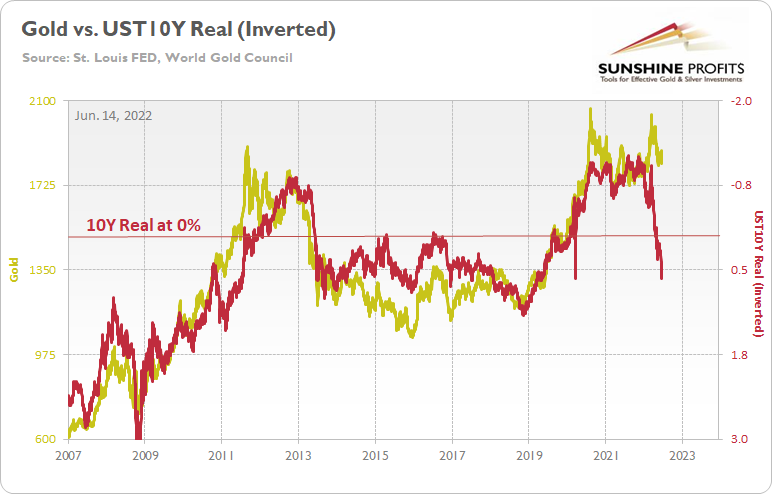
To explain, the gold line above tracks the price tallied by the World Gold Council, while the red line above tracks the inverted U.S. 10-Year real yield. For context, inverted means that the latter's scale is flipped upside down and that a rising red line represents a falling U.S. 10-Year real yield, while a falling red line represents a rising U.S. 10-Year real yield.
If you analyze the left side of the chart, you can see that the U.S. 10-Year real yield soared and gold plunged during the global financial crisis (GFC). However, when the Fed launched QE and the U.S. 10-Year real yield sank to an all-time low, gold hit a new all-time high along the way.
Furthermore, the current situation is a spitting image. When Fed Chairman Jerome Powell performed a dovish pivot in late 2018, the U.S. 10-Year real yield suffered. Then, when the Fed fired its liquidity bazooka in March 2020, it pushed the metric to another all-time low. And surprise, surprise, gold hit another all-time high.
However, with the Fed normalizing policy, the U.S. 10-Year real yield has surged in recent weeks. Moreover, the Fed needs to push the metric above 0% to curb inflation.
Thus, it's likely only a matter of time until the milestone is achieved. In addition, a U.S. 10-Year real yield of 0% implies a gold price of $1,500, and while the current narrative suggests otherwise, is this time really different?
A Trip Down Memory Lane
While many investors rely on the mantra of ‘don’t fight the Fed,’ the implications go both ways. Therefore, when the liquidity drain began, history highlighted that storm clouds were on the horizon. For example, I added on Oct. 26, 2021:
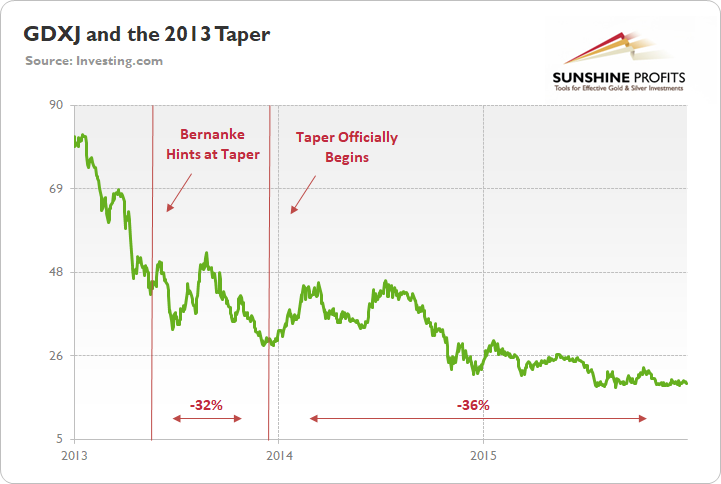
To explain, the green line above tracks the GDXJ ETF from the beginning of 2013 to the end of 2015. If you analyze the left side of the chart, you can see that when Fed Chairman Ben Bernanke hinted at tapering on May 22, 2013, the GDXJ ETF declined by 32% from May 22 until the taper began on Dec. 18.
Moreover, the onslaught didn’t end there. Once the taper officially began, the GDXJ ETF enjoyed a relief rally (similar to what we’re witnessing now), as long-term interest rates declined and the PMs assumed that the worst was in the rearview.
However, as the liquidity drain caught up to the junior miners over the medium term, the GDXJ ETF declined by another 36% from when the taper was announced on Dec. 18, 2013 until the end of 2015.
Is the Selling Over?
While I've noted the 'buy the dip' crowds' foolhardy attempts to manufacture a bull market, I warned on May 19 that we were far from a medium-term bottom. I wrote:
While Fed officials realize that inflation will only subside if commodity and stock prices fall, a near 20% peak-to-trough decline in the S&P 500 still hasn’t spooked market participants. Moreover, while some claim that sentiment is extremely bearish on Wall Street, the reality is that no one fears the Fed.
Please see below:
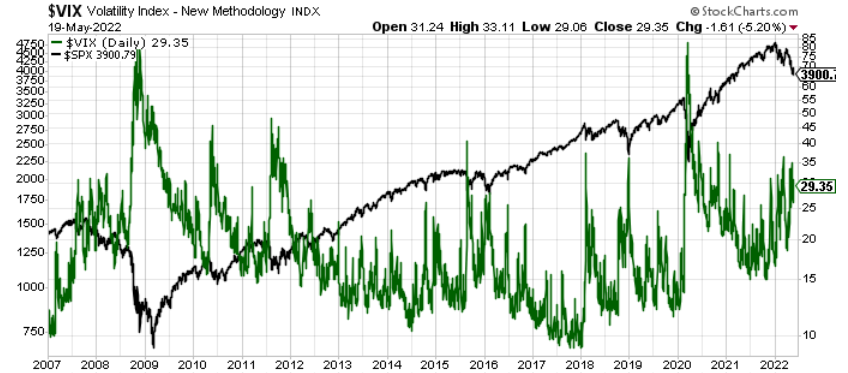
To explain, the black line above tracks the S&P 500, while the green line above tracks the Cboe Volatility Index (VIX). If you analyze the relationship, notice how material spikes in the VIX often mark bottoms for the S&P 500. In a nutshell: when true fear is present, investors rush to buy put options (downside hedges) at any cost, and volatility skyrockets. Therefore, panic is what often creates long-term bottoms.
As such, while the VIX soared by nearly 23% on Jun. 13, it still hasn't cracked 40. Moreover, I noted previously that Morgan Stanley's Chief U.S. Equity Strategist Mike Wilson told clients that the S&P 500's "price remains wrong with the equity risk premium at 290 [basis points] bps" versus his fair market value of 345 bps. As a result, more risk re-ratings should "take the S&P toward 3,400 by mid-late August."
Please see below:
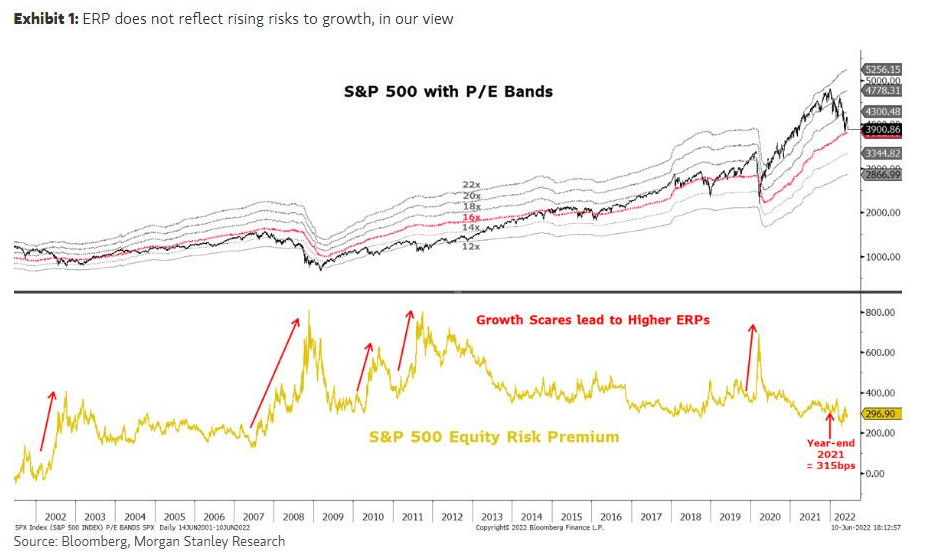
To explain, the black line at the top half of the chart tracks the S&P 500, while the various bands represent potential prices given forward price-to-earnings (P/E) multiples that range from 12x to 22x. For context, this data was compiled before the sell-off on Jun. 13, but the implications are important.
If you analyze the relationship, you can see that bear market bottoms in 2018 and 2015/2016 occurred at 14x. Moreover, bear market bottoms in 2008 and 2011/2012 occurred at 12x. Therefore, with the current P/E at roughly 16x, there is still room for further downside.
More importantly, please focus your attention on the yellow line at the bottom half of the chart. It represents the equity risk premium (ERP) that Wilson referenced. Notice how large sell-offs coincide with sharp spikes in the ERP. Well, if you turn to the right side of the chart, you can see that the ERP is/was in la-la land. Again, the ERP may have increased on Jun. 13. However, the metric needs to move materially higher to reach levels consistent with medium-term bottoms. As a result, more downside should confront the S&P 500 in the coming weeks.
To that point, the ERP and VIX data highlight investors’ uninformed belief that the Fed is bluffing. However, it seems like the permabulls and the permabears are learning this lesson the hard way. I wrote on May 25:
A decade of dovish pivots has left a generation of investors believing that the central bank is all talk and no action. However, with inflation at levels unseen in 40+ years, Powell is not out of ammunition, and the Fed pivot crowd should suffer profound disappointment as the drama unfolds.
The bottom line? We’ve officially entered the monetary version of The Boy Who Cried Wolf. With Fed officials running to the rescue each time the financial markets show signs of stress, investors are programmed to ignore their hawkish threats. However, while these post-GFC pivots occurred with inflation perched near 2%, investors are so steadfast in their belief that they ignore the climactic consequences of unanchored inflation.
Political Pressures
With inflation reducing Americans’ living standards, I warned on numerous occasions that inflation is political and that lawmakers will prioritize votes over market multiples. To that point, The Washington Post and George Mason University’s Schar School of Policy and Government released their latest poll on Jun. 9. The report revealed:
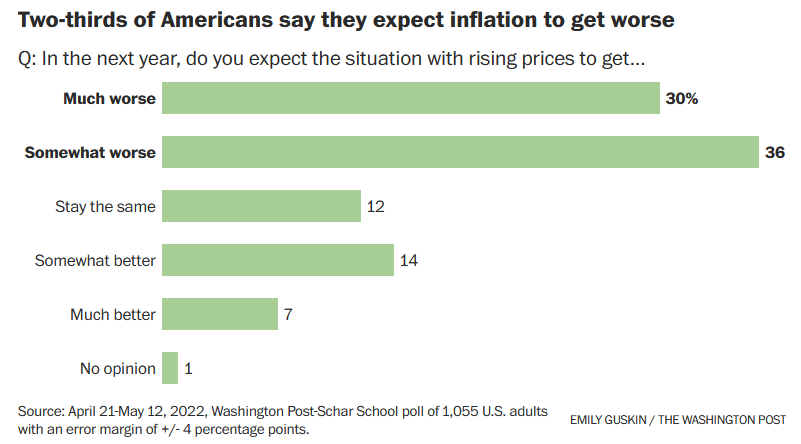
“Inflation takes center stage as a leading economic and political hurdle for the Biden administration. After months of dismissing price hikes as a short-term shock, the Federal Reserve recently began raising interest rates in hopes of cooling the economy enough to temper inflation.
“Even so, two-thirds of Americans (66 percent) expect inflation to get worse in the coming year, while 21 percent expect it to get better and 12 percent think it will stay the same, the poll finds.”
Please see below:
In addition:
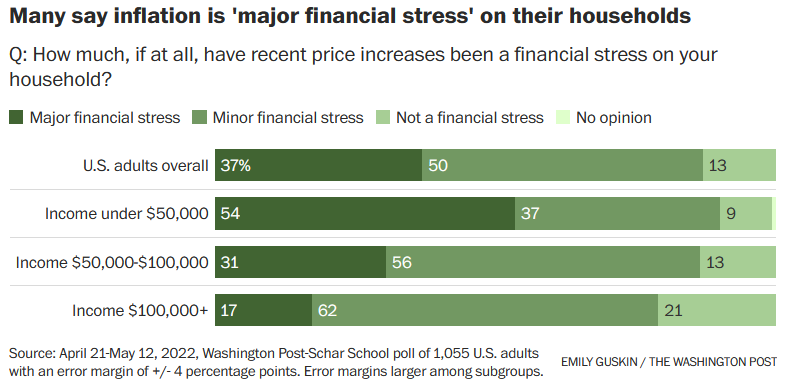
“More than a third of Americans say recent price increases have been a major financial stress on their households, with concerns peaking among lower-income households: A 54 percent majority of people with household incomes below $50,000 say rising prices are a “major financial stress,” compared with 31 percent of those with incomes between $50,000 and $100,000 and 17 percent of those with incomes of $100,000 or more.”
Please see below:
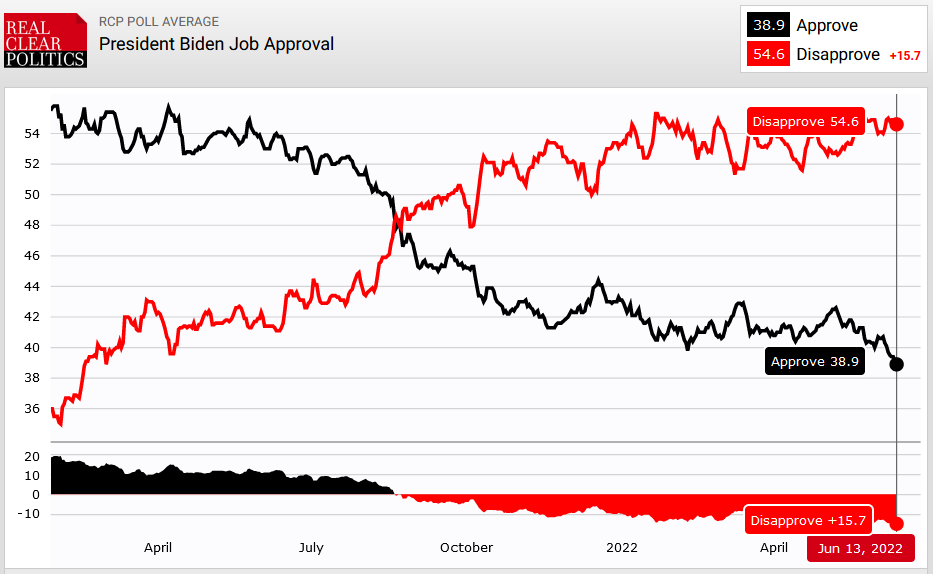
Furthermore, the latest data from RealClearPolitics – which averages the results from numerous political polls – found that a record low 38.9% approve of Biden’s performance as President. Likewise, 54.6% disapprove, which is near a record high. As a result, the pressure continues to mount on Biden and Powell to solve their inflation conundrum.
The Bottom Line
With the bond market on a warpath and the probability of a 75-basis-point rate hike this week soaring, carnage erupted on Wall Street. Moreover, with investors assuming that inflation would simply evaporate on its own – which has never happened – the realities of what it takes to deal with the problem hit home for many investors. However, with most assets still far from their fundamental fair values, more downside should materialize before long-term buying opportunities emerge.
In conclusion, the PMs plunged on Jun. 13, and the GDXJ ETF suffered the brunt of investors’ wrath. Moreover, with the U.S. 10-Year real yield hitting a new 2022 high, the PMs’ medium-term fundamental outlooks remain profoundly bearish. As a result, our short position should reap more profits as the liquidity drain continues.
Naturally, as always, I’ll keep you – my subscribers – informed.
Overview of the Upcoming Part of the Decline
- It seems to me that the short-term rally in the precious metals market is either over or very close to being over. It’s so close to being over that I think it’s already a good idea to be shorting junior mining stocks.
- We’re likely to (if not immediately, then soon) see another big slide, perhaps close to the 2021 lows ($1,650 - $1,700).
- If we see a situation where miners slide in a meaningful and volatile way while silver doesn’t (it just declines moderately), I plan to – once again – switch from short positions in miners to short positions in silver. At this time, it’s too early to say at what price levels this could take place and if we get this kind of opportunity at all – perhaps with gold prices close to $1,600.
- I plan to exit all remaining short positions once gold shows substantial strength relative to the USD Index while the latter is still rallying. This may be the case with gold close to $1,400. I expect silver to fall the hardest in the final part of the move. This moment (when gold performs very strongly against the rallying USD and miners are strong relative to gold after its substantial decline) is likely to be the best entry point for long-term investments, in my view. This can also happen with gold close to $1,400, but at the moment it’s too early to say with certainty.
- The above is based on the information available today, and it might change in the following days/weeks.
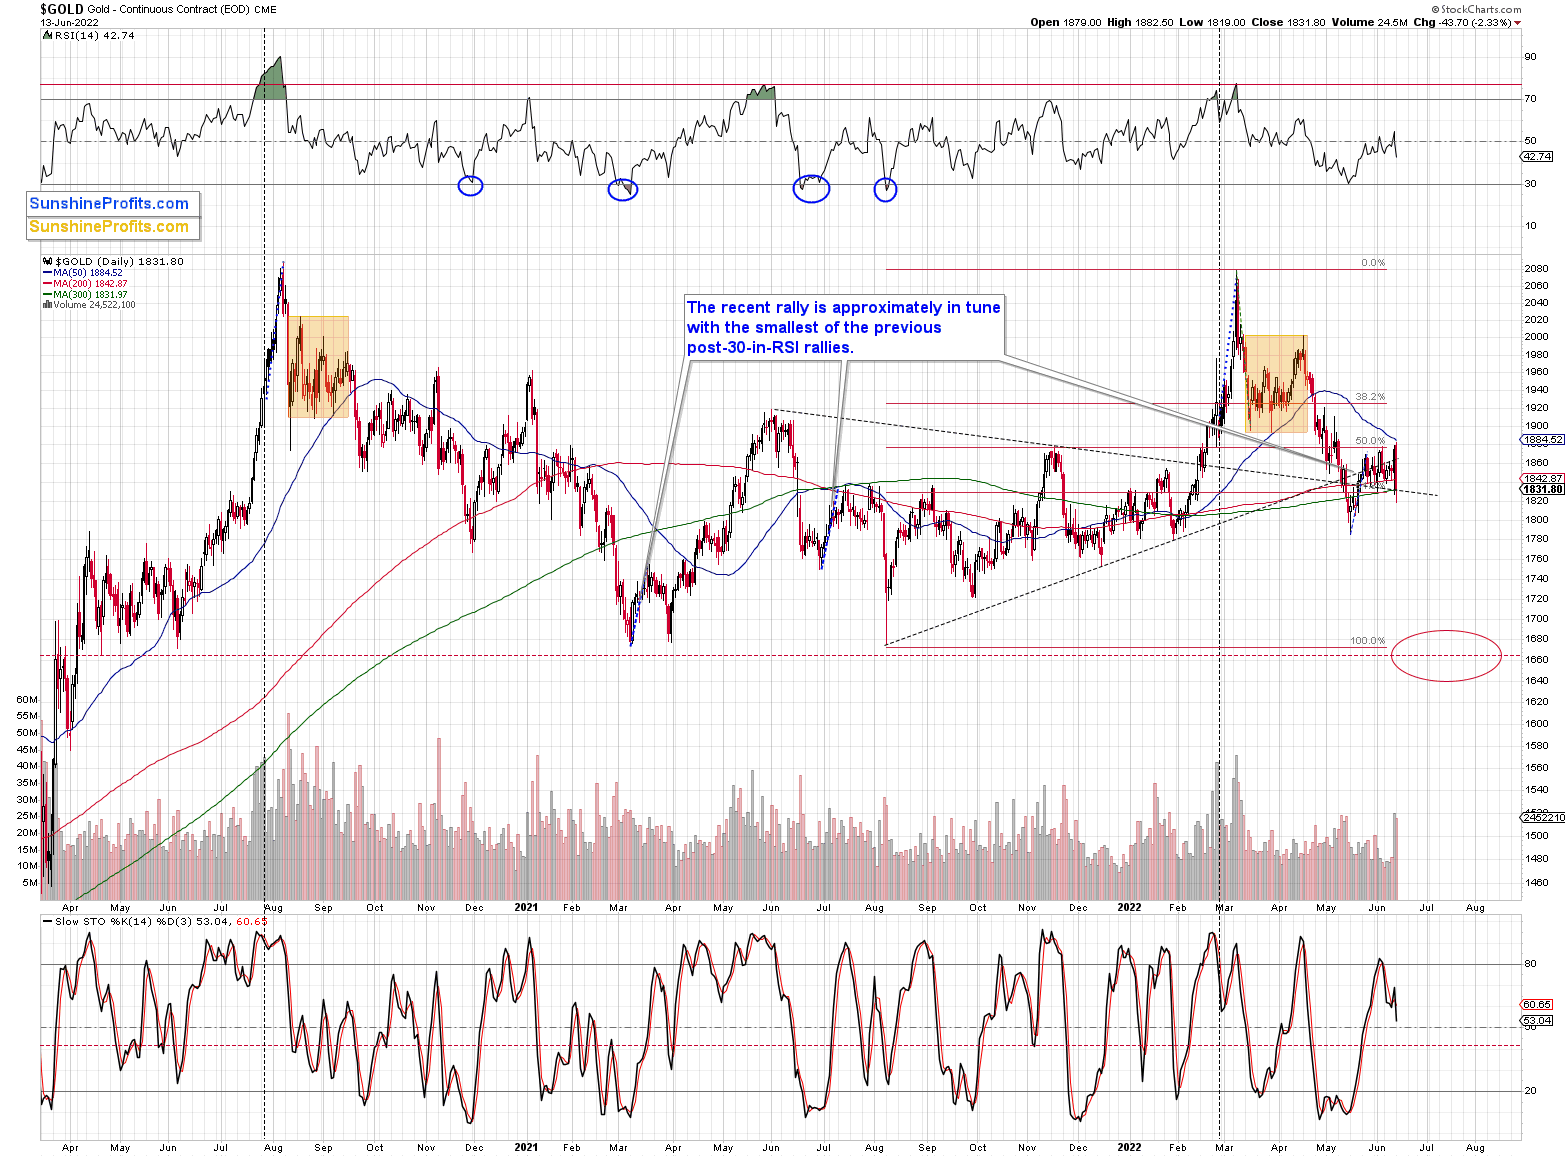
You will find my general overview of the outlook for gold on the chart below:
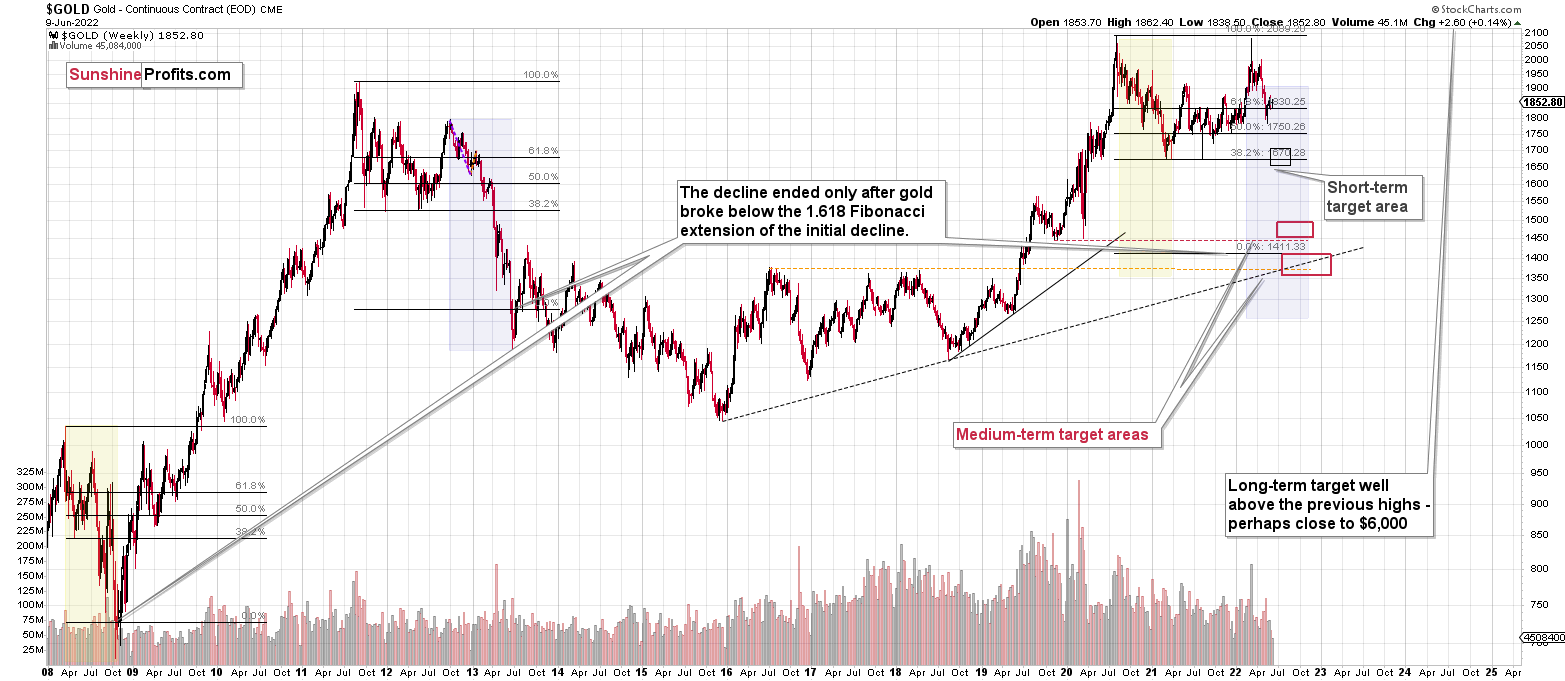
Please note that the above timing details are relatively broad and “for general overview only” – so that you know more or less what I think and how volatile I think the moves are likely to be – on an approximate basis. These time targets are not binding or clear enough for me to think that they should be used for purchasing options, warrants, or similar instruments.
Summary
Summing up, it seems to me that the short-term rally in the precious metals market is either over or close to being over. In fact, it’s so close to being over that I think it’s already a good idea to be shorting junior mining stocks. The profits that we already have in this short trade, are likely to increase substantially in my view.
I previously wrote that the profits from the previous long position (congratulations once again) were likely to further enhance the profits on this huge decline, and that’s exactly what happened. The profit potential with regard to the upcoming gargantuan decline remains huge.
As investors are starting to wake up to reality, the precious metals sector (particularly junior mining stocks) is declining sharply. Here are the key aspects of the reality that market participants have ignored:
- rising real interest rates,
- rising USD Index values.
Both of the aforementioned are the two most important fundamental drivers of the gold price. Since neither the USD Index nor real interest rates are likely to stop rising anytime soon (especially now that inflation has become highly political), the gold price is likely to fall sooner or later. Given the analogy to 2012 in gold, silver, and mining stocks, “sooner” is the more likely outcome.
After the final sell-off (that takes gold to about $1,350-$1,500), I expect the precious metals to rally significantly. The final part of the decline might take as little as 1-5 weeks, so it's important to stay alert to any changes.
As always, we'll keep you – our subscribers – informed.
To summarize:
Trading capital (supplementary part of the portfolio; our opinion): Full speculative short positions (300% of the full position) in junior mining stocks are justified from the risk to reward point of view with the following binding exit profit-take price levels:
Mining stocks (price levels for the GDXJ ETF): binding profit-take exit price: $27.32; stop-loss: none (the volatility is too big to justify a stop-loss order in case of this particular trade)
Alternatively, if one seeks leverage, we’re providing the binding profit-take levels for the JDST (2x leveraged). The binding profit-take level for the JDST: $19.87; stop-loss for the JDST: none (the volatility is too big to justify a SL order in case of this particular trade).
For-your-information targets (our opinion; we continue to think that mining stocks are the preferred way of taking advantage of the upcoming price move, but if for whatever reason one wants / has to use silver or gold for this trade, we are providing the details anyway.):
Silver futures downside profit-take exit price: $17.22
SLV profit-take exit price: $16.22
ZSL profit-take exit price: $41.87
Gold futures downside profit-take exit price: $1,706
HGD.TO – alternative (Canadian) 2x inverse leveraged gold stocks ETF – the upside profit-take exit price: $11.87
HZD.TO – alternative (Canadian) 2x inverse leveraged silver ETF – the upside profit-take exit price: $31.87
Long-term capital (core part of the portfolio; our opinion): No positions (in other words: cash)
Insurance capital (core part of the portfolio; our opinion): Full position
Whether you’ve already subscribed or not, we encourage you to find out how to make the most of our alerts and read our replies to the most common alert-and-gold-trading-related-questions.
Please note that we describe the situation for the day that the alert is posted in the trading section. In other words, if we are writing about a speculative position, it means that it is up-to-date on the day it was posted. We are also featuring the initial target prices to decide whether keeping a position on a given day is in tune with your approach (some moves are too small for medium-term traders, and some might appear too big for day-traders).
Additionally, you might want to read why our stop-loss orders are usually relatively far from the current price.
Please note that a full position doesn't mean using all of the capital for a given trade. You will find details on our thoughts on gold portfolio structuring in the Key Insights section on our website.
As a reminder - "initial target price" means exactly that - an "initial" one. It's not a price level at which we suggest closing positions. If this becomes the case (as it did in the previous trade), we will refer to these levels as levels of exit orders (exactly as we've done previously). Stop-loss levels, however, are naturally not "initial", but something that, in our opinion, might be entered as an order.
Since it is impossible to synchronize target prices and stop-loss levels for all the ETFs and ETNs with the main markets that we provide these levels for (gold, silver and mining stocks - the GDX ETF), the stop-loss levels and target prices for other ETNs and ETF (among other: UGL, GLL, AGQ, ZSL, NUGT, DUST, JNUG, JDST) are provided as supplementary, and not as "final". This means that if a stop-loss or a target level is reached for any of the "additional instruments" (GLL for instance), but not for the "main instrument" (gold in this case), we will view positions in both gold and GLL as still open and the stop-loss for GLL would have to be moved lower. On the other hand, if gold moves to a stop-loss level but GLL doesn't, then we will view both positions (in gold and GLL) as closed. In other words, since it's not possible to be 100% certain that each related instrument moves to a given level when the underlying instrument does, we can't provide levels that would be binding. The levels that we do provide are our best estimate of the levels that will correspond to the levels in the underlying assets, but it will be the underlying assets that one will need to focus on regarding the signs pointing to closing a given position or keeping it open. We might adjust the levels in the "additional instruments" without adjusting the levels in the "main instruments", which will simply mean that we have improved our estimation of these levels, not that we changed our outlook on the markets. We are already working on a tool that would update these levels daily for the most popular ETFs, ETNs and individual mining stocks.
Our preferred ways to invest in and to trade gold along with the reasoning can be found in the how to buy gold section. Furthermore, our preferred ETFs and ETNs can be found in our Gold & Silver ETF Ranking.
As a reminder, Gold & Silver Trading Alerts are posted before or on each trading day (we usually post them before the opening bell, but we don't promise doing that each day). If there's anything urgent, we will send you an additional small alert before posting the main one.
Thank you.
Przemyslaw Radomski, CFA
Founder, Editor-in-chief

