

Briefly: in our opinion, full (200% of the regular size of the position) speculative short positions in gold, silver and mining stocks are justified from the risk/reward perspective at the moment of publishing this alert.
In the past several analyses, we emphasized the boring nature of the current situation in the precious metals market and its implications. Friday’s session took it to the extreme as virtually nothing happened during the session. At the first sight. Those, who look beyond the usually analyzed aspects, have noticed an important breakdown in one part of the precious metals market and they see that PMs are on a verge of making an even more profound breakthrough. Analogous breakthrough meant a critical and potentially lucrative move in the past… What are the PMs really telling us?
Let’s start with a brief look at gold, silver and mining stocks.
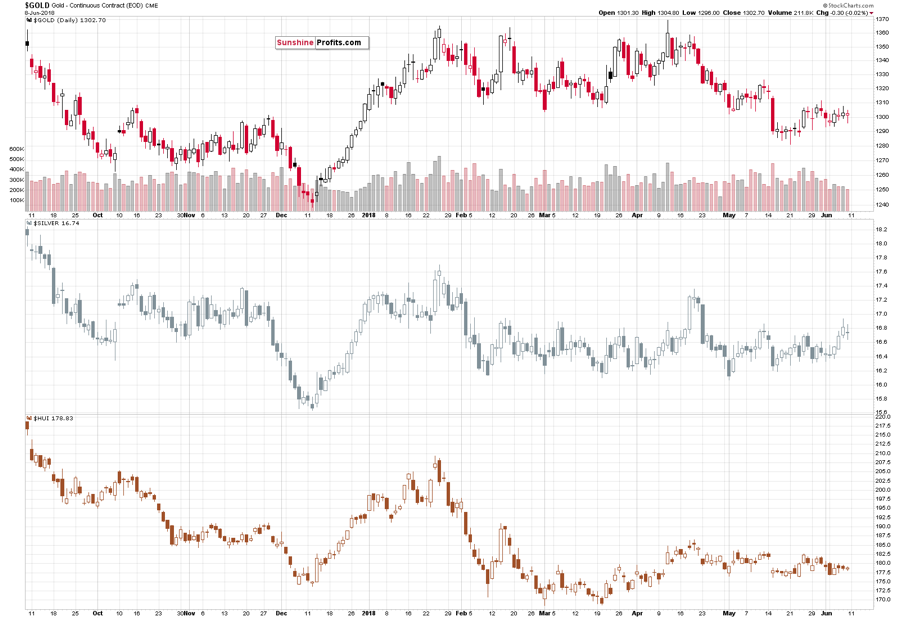
As you can see above, nothing really changed yesterday and thus what we wrote about the precious metals in Friday's Alert remains up-to-date. Consequently, instead of repeating the quite sizable analysis, we’ll focus on what’s new and what we didn’t feature previously. Let’s start with the new.
Silver Stocks’ Breakdown
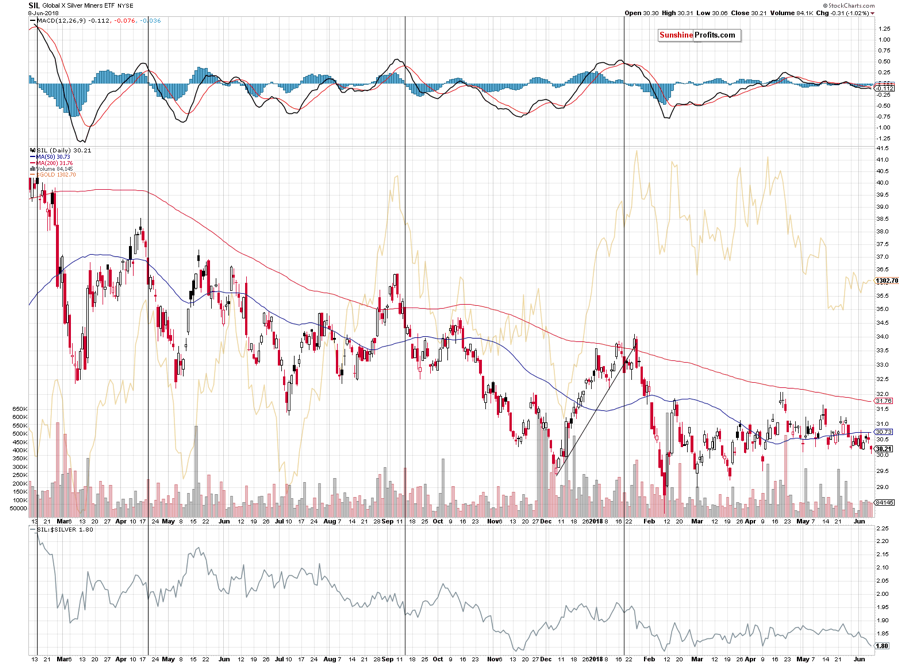
The silver miners moved lower on Friday and ended the week at a new low. At the same time, they formed a new monthly low and closed below the lowest closing price of May. In fact, yesterday’s close was the lowest in almost 2 months.
We saw a similar sign in early June and the implications were already bearish back then. Since that time, however, silver miners moved a bit higher initially, but ended the week confirming the previous breakdown below the May lows. This means that the bearish implications that we had seen are now even more bearish.
Having said the above, let’s move to what we didn’t feature previously, but that’s not a signal on its own yet.
Gold Stocks: On the Verge
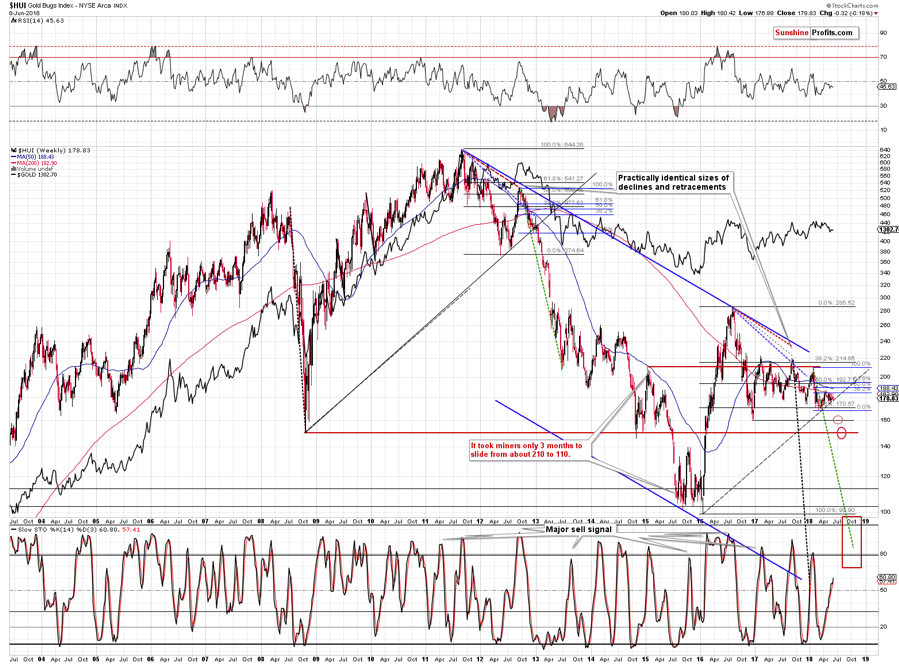
Let’s start the discussion by looking at the rising dashed support line that’s based on the 2016 low and the 2018 low. Gold stocks are practically right at this support line and breaking it is likely to trigger a bigger move lower as that’s how important support lines work in general. The above is an important line, because it’s based on important bottoms (both are yearly lows).
But, there’s much more to this line than just the above. Namely, we saw something similar in late 2012 and early 2013. The HUI Index moved to the important rising support line that was based on major bottoms and it consolidated above it. That’s more or less what we’re seeing at this time. The key thing is what happened next in 2013 and what happened next was the biggest decline in years. The pause at the rising support line was the final stop before the biggest dive. It seems that mining stocks are in the final part of preparing to do the same.
The striking thing about the above analogy is that it’s confirmed by slope of the support line. We copied the current (dashed) support line to the 2008 bottom and if you didn’t notice it previously, it only confirms just how similar both lines are. Speaking of slopes, if you look at the purple dashed lines that start at the 2011 and 2016 tops (they are identical to emphasize the very similar shape of the post-top action), you’ll see that extending them causes them to cross the above-mentioned rising support line practically right at the moment when the decline accelerated. That’s right, it means that it should start any day now.
There are no implications for the next day or a few of them, but the consequences for the following weeks and months are extremely bearish, especially as what we described today is only an addition to multiple other bearish factors that we had described in the previous alerts.
Having said the above, let’s take a look at the currency sector.
The USD Correction
In short, the situation is generally unchanged. The USD Index appears to be ending its corrective downswing and we can make analogous statements about the euro and the yen. In general, we have very little to add to what we wrote in our Friday’s Alert, but since we specifically promised to keep you updated on the situation on the forex market, we’ll provide the entire analysis once again and follow-up with a note on small changes.
In recent alerts, we wrote the following:
In the previous alerts, we discussed that the USD Index was likely to correct after (almost) reaching the resistance at the level of 95. That’s what happening and the question is when and at what price levels is the corrective downswing likely to end. To answer this question, let’s start with looking at the context.
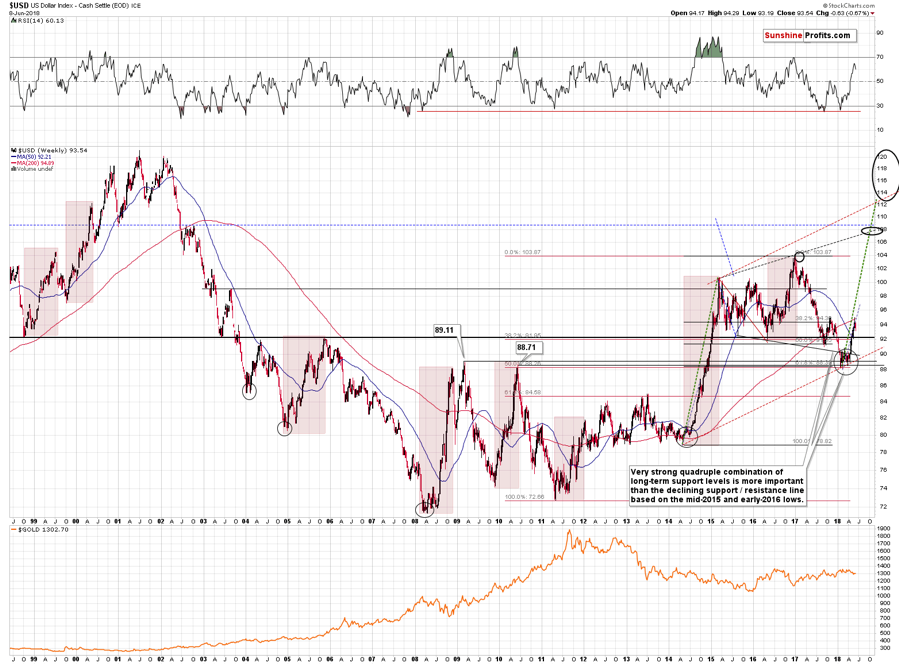
The key context is that the USD Index is soaring just as it did in 2014, 2008, and 2010. If there was very significant similarity for weeks, then one should expect to see similarity in the future, at least in the next few weeks. On a side note, the self-similar patterns are a great tool, but their limitation is that it’s hard to predict when the price moves stop being aligned. Consequently, while the near-term predictions based on it are very useful, making very long-term calls can be less effective. There’s simply more time for the patterns to diverge, so the chance for it increases. That’s why we are not married to the idea of USDX reaching 113 or so based on the similarity to the 2014-2015 rally and we view a move to 107 or so, or even to 118-120 as possible. Since all these outcomes mean substantial gains, the medium-term outlook is bullish either way.
But, moving back to the short-term implications, there’s also the issue of recency that one should take into account. What happened last week is easier to recall than what happened several weeks before. For instance, your Editor practiced smithing (it turns out that arrow heads make quite nice pendants) a few weeks ago and while it all seemed familiar a few days later, it no longer does.
In case of the capital markets, the above effect means that what happened more recently is more likely to be similar to what happens currently. Investors recall the recent events more easily whether that is done consciously or subconsciously. To a small extent, their emotional reactions are also more likely to be aligned with what happened recently than with what happened a long time ago. On the fundamental front, the current developments are also more similar to what happened recently than to what happened many years ago.
Therefore, it seems justified to attribute greater importance to the analogy to what happened recently than to what happened some time ago. In case of the above USD Index chart, this means that the analogy to 2014-2015 seems more important than the analogies to 2008 and 2010.
Consequently, let’s see what happened in the former period in order to see what’s likely to happen now.
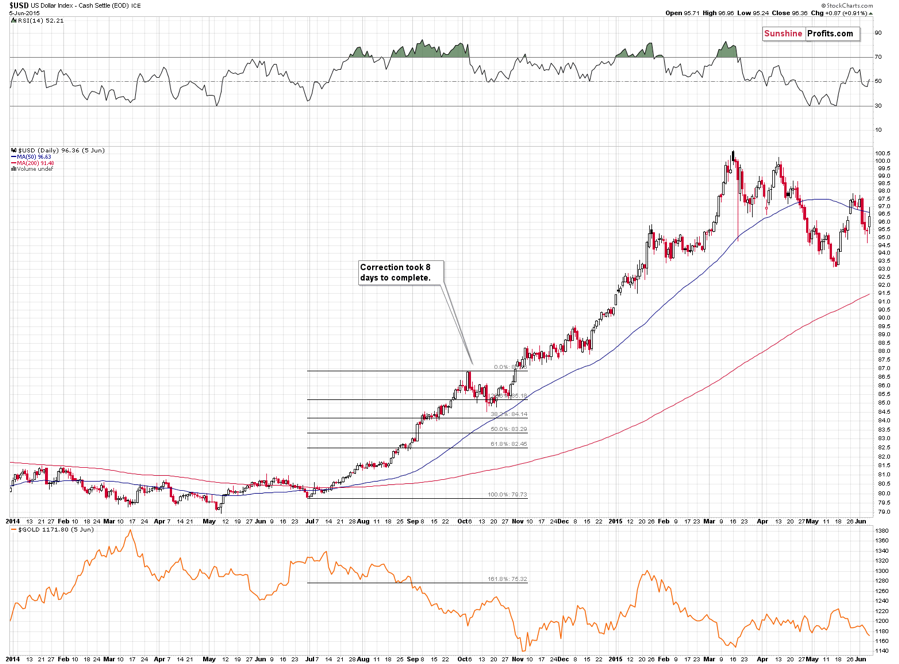
The first correction that we saw during the above big rally took place in October 2014 and it took 8 trading days.
During this correction, the USD moved to about the 23.6% Fibonacci retracement (not the most popular retracement, but it can work during the strongest bull markets). Precisely, USD moved below it on an intraday basis, and closed the session very close to it.
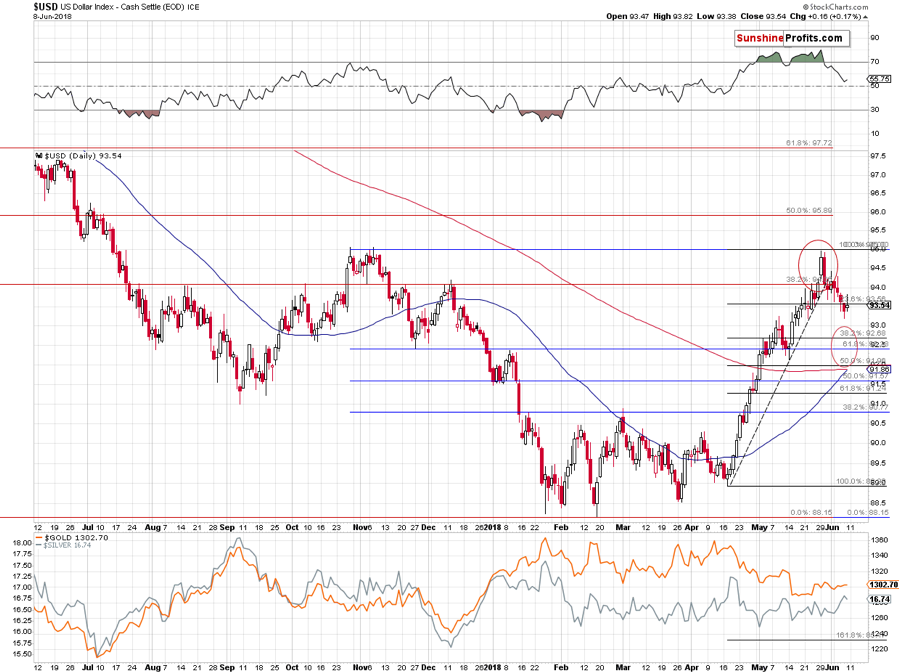
Now, the USD Index is after 8 days of correction and the bottom seems to have formed on its 7th day. Precisely, USD moved below it on an intraday basis, and close the session very close to it. Sounds familiar? Indeed, it’s what ended the correction in 2014 and started another powerful upswing.
The bottom formed after only 7 days this time, not 8, but the preceding rally was also quicker than in 2014, so it all seems to fit almost perfectly.
Moreover, back in 2014, the final bottom took place when USD closed the session a bit below the 23.6% Fibonacci retracement and that was exactly the case on Thursday.
Therefore, while the above chart features a target area that we view as the maximum of the likely downside targets (maximum meaning the furthest price drop), it seems more likely that the bottom for this corrective downswing was reached on Thursday.
All in all, it seems that the USD upswing will resume any day now.
As previously, before summarizing, we would like to examine the situation in the two biggest components of the USD Index. The latter is the weighted average of currency exchange rates and the two biggest components are the euro and the yen.
The Euro Index
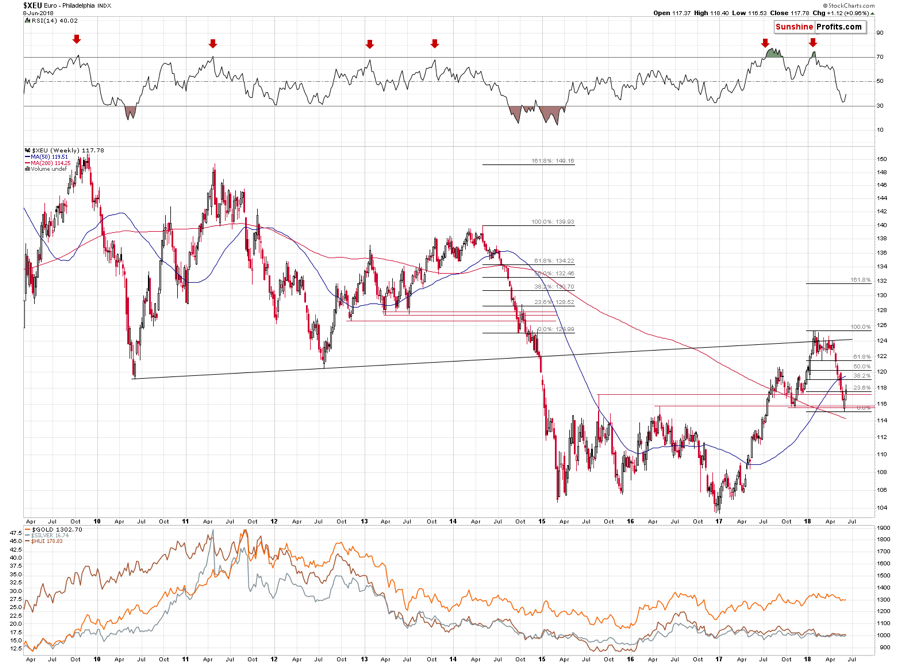
EUR/USD’s weight in the index is over 50%, so it’s no wonder that the two move in tandem at practically all times. It’s also no wonder that just as the 2014 move in the USDX is similar to what happened recently, it’s also similar in case of the euro. The analysis of the latter actually provides us with some additional confirmations.
Similarly to the USDX, the euro corrected a bit above the 23.6% Fibonacci retracement before turning south again, but there is actually another similarity. The correction that we saw in the late 2014 started when euro moved below the previous lows and the correction ended once the European currency moved back above them. We marked the support levels created by the previous lows with red.
The same thing happened recently – euro started its brief upswing once it moved below the late-2017 low and both: 2015 and 2016 highs. It’s now back above them.
The history tends to rhyme and in case of the euro the current verse appears very bearish.
The Japanese Yen
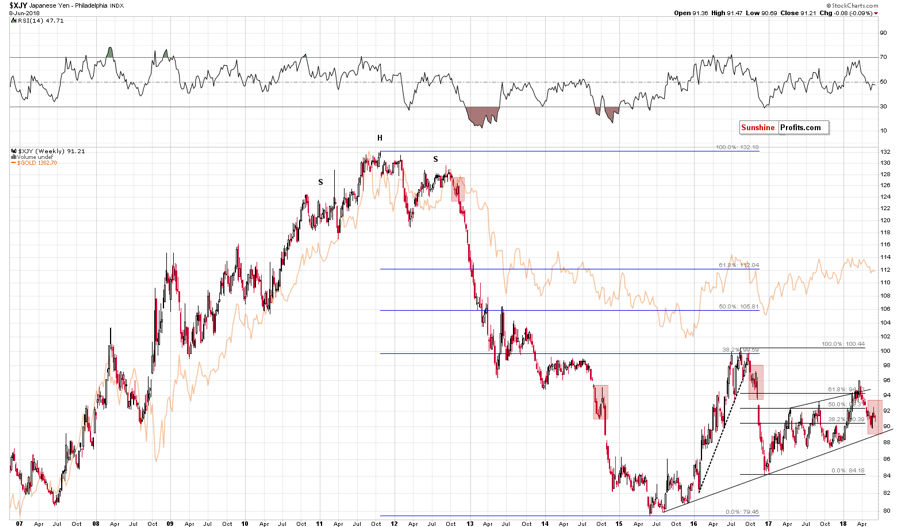
The link to what happened in 2014 is visible in case of the Japanese currency, but it’s not as clear as in case of the euro. But, there is something else that makes the outlook bearish for the following weeks and – possibly – months. The way that the yen corrected after sizable, short-term declines is quite similar to what we already saw previously.
The key is when we saw it. In late 2012, in late 2014 and in late 2016. In all these cases a big decline followed shortly thereafter, and by big, we mean enormous. These were the three biggest declines of the past decade and if this analogy is not bearish, then we don’t know what is.
Also, while it’s not late 2018 yet, the current year still seems in tune with the pattern in which yen slides every other year since 2012.
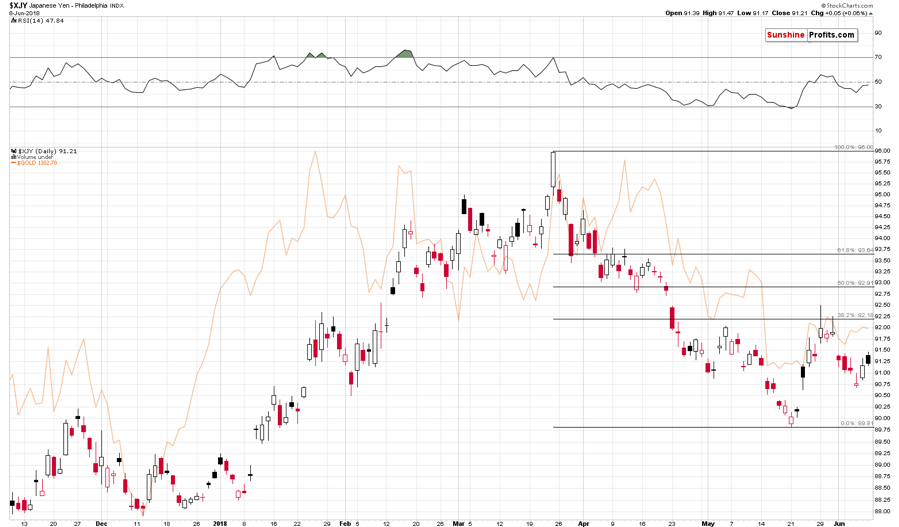
From the short-term point of view, the corrective rally in the yen appears to be over as the currency moved to its 38.2% Fibonacci retracement in late May and failed to break above it. That’s a perfectly natural reaction of a market that declined quite fast but remains in a strong downtrend. If the downtrend was not as strong, the price would have likely corrected to 50% or even 61.8% Fibonacci retracement – but it didn’t.
What does it all mean? That the Japanese yen may be ready for another downswing and if it moves below its May low, it’s likely to slide very fast, just as it did in 2012, 2014, and 2016. This means higher USD and likely lower precious metals prices.
This week will be hot as there will be Fed, European Central Bank, and Bank of Japan meetings, so we may see some short-term volatility. If it wasn’t for them, we would most likely be writing about opening trading positions on the forex market today. More precisely, we would have opened them on Friday.
On an administrative note, as you’ve noticed, today’s alert included quite a lot of forex details, which are normally part of the Forex Trading Alerts. For the next several days, your Editor will be providing the crude oil and forex analysis and we thought that it would be a pleasant surprise to include the latter right into our Gold & Silver Trading Alerts. So, while we’re not going to include forex trading positions into the normal summary of positions for this type of alert as it might be confusing for some subscribers, we will provide additional information regarding any positions in the forex sections, just like we did today, saying that we would have opened trading positions and are not doing so only in light of possible news-driven volatility next week. Naturally, as you’ve read in the previous alerts and as you’ve noticed yourself, the precious metals sector is currently not really replying to forex market’s moves, so it seems that keeping the position in the PMs intact is the way to go, especially given the bearish confirmations from silver.
Summary
Summing up, nothing really changed on Friday, but it doesn’t mean that the outlook for the precious metals market is unclear. It may be cloudy for the next few days, but it remains very bearish for the following weeks and months and new signals – breakdown in silver stocks, and the stronger-than-ever analogy to the 2012-2013 decline in gold stocks strongly suggest that lower PM prices are just around the corner.
Moreover, let’s keep in mind that a small short-term rally was something quite possible in the light of the analogies to what happened in gold and silver when the market was just as boring as it’s been recently. It seems that we have already seen this small rally. Silver outperformed and miners underperformed, just like they are likely to in the final parts of a rally. Therefore, the outlook for the precious metals sector is bearish.
As always, we’ll keep you – our subscribers – informed.
To summarize:
Trading capital (supplementary part of the portfolio; our opinion): Full short positions (200% of the full position) in gold, silver and mining stocks are justified from the risk/reward perspective with the following stop-loss orders and initial target price levels:
- Gold: initial target price: $1,251; stop-loss: $1,382; initial target price for the DGLD ETN: $48.88; stop-loss for the DGLD ETN $37.48
- Silver: initial target price: $15.73; stop-loss: $18.06; initial target price for the DSLV ETN: $27.58; stop-loss for the DSLV ETN $19.17
- Mining stocks (price levels for the GDX ETF): initial target price: $21.03; stop-loss: $23.54; initial target price for the DUST ETF: $28.88; stop-loss for the DUST ETF $21.16
In case one wants to bet on junior mining stocks' prices (we do not suggest doing so – we think senior mining stocks are more predictable in the case of short-term trades – but if one wants to do it anyway, we provide the details), here are the stop-loss details and initial target prices:
- GDXJ ETF: initial target price: $30.62; stop-loss: $36.14
- JDST ETF: initial target price: $59.68 stop-loss: $40.86
Long-term capital (core part of the portfolio; our opinion): No positions (in other words: cash)
Insurance capital (core part of the portfolio; our opinion): Full position
Plus, you might want to read why our stop-loss orders are usually relatively far from the current price.
=====
Latest Free Trading Alerts:
Stocks traded within a short-term consolidation on Friday, as investors took some profits off the table following recent advance. The broad stock market accelerated its uptrend after breaking above three-week-long consolidation a week ago. Will it continue its uptrend or is this some topping pattern ahead of downward reversal? There are still two possible medium-term scenarios.
Topping Pattern or Just Consolidation?
Crude oil moved significantly lower after topping at long-term retracement levels and since the monthly decline took place on big volume (biggest in almost a year), the black gold should move lower. But instead of moving lower this week, it seems to be forming a weekly bullish reversal. The individual daily volume levels were not low this week, so if the bullish reversal does indeed form, we’ll have a quite reliable bullish signal. Will the monthly bearish sign be invalidated? Will crude oil rally shortly?
Crude Oil: Bullish Weekly Reversal vs. Bearish Monthly Reversal
=====
Hand-picked precious-metals-related links:
PRECIOUS-Gold dips on uncertainty about Fed, U.S.-N.Korea summit
Scientists develop technique to reduce cost, environmental impact of mining precious metal
South African Union Seeks 12,500 Rand Minimum for Gold Miners
=====
In other news:
Trump, Pompeo positive ahead of North Korean summit; officials meet to close differences
Canadian Dollar Hit Hardest as Trade Woes Resurface: Inside G-10
Euro rises despite G7 fracas as investors look to ECB, Fed
Time to kiss easy money goodbye? Five questions for the ECB
Swedish banks told to safeguard cash access despite rise in digital payments
Italian Markets Rally After Finance Minister Commits to Euro
Oil prices slip as U.S. and Russian supplies grow
Swiss Reject Plan That Would Have Revolutionized Banking
Cryptocurrencies Lose $42 Billion After South Korean Bourse Hack
=====
Thank you.
Sincerely,
Przemyslaw Radomski, CFA
Founder, Editor-in-chief, Gold & Silver Fund Manager
Gold & Silver Trading Alerts
Forex Trading Alerts
Oil Investment Updates
Oil Trading Alerts

