

Briefly: in our opinion, full (250% of the regular size of the position) speculative short position in gold, silver, and mining stocks is justified from the risk/reward perspective at the moment of publishing this Alert.
Yesterday's analysis was about gold being so boring that it's actually a strong sell sign. And, well, gold lived to its reputation yesterday. Nothing really happened in the yellow metal and nothing really happened in silver and miners either. In case of miners the "nothing" was very meaningful as it was the third day when the HUI Index - the flagship proxy for gold stocks - closed below the January lows, thus confirming the breakdown. Even though not much happened, the outlook for miners was reinforced and the likelihood of seeing another move lower this week increased further. And while a trigger is not necessary for the decline to take place, it seems that we might see one anyway. What might that be?
The US dollar.
The USD Pressure Is Building
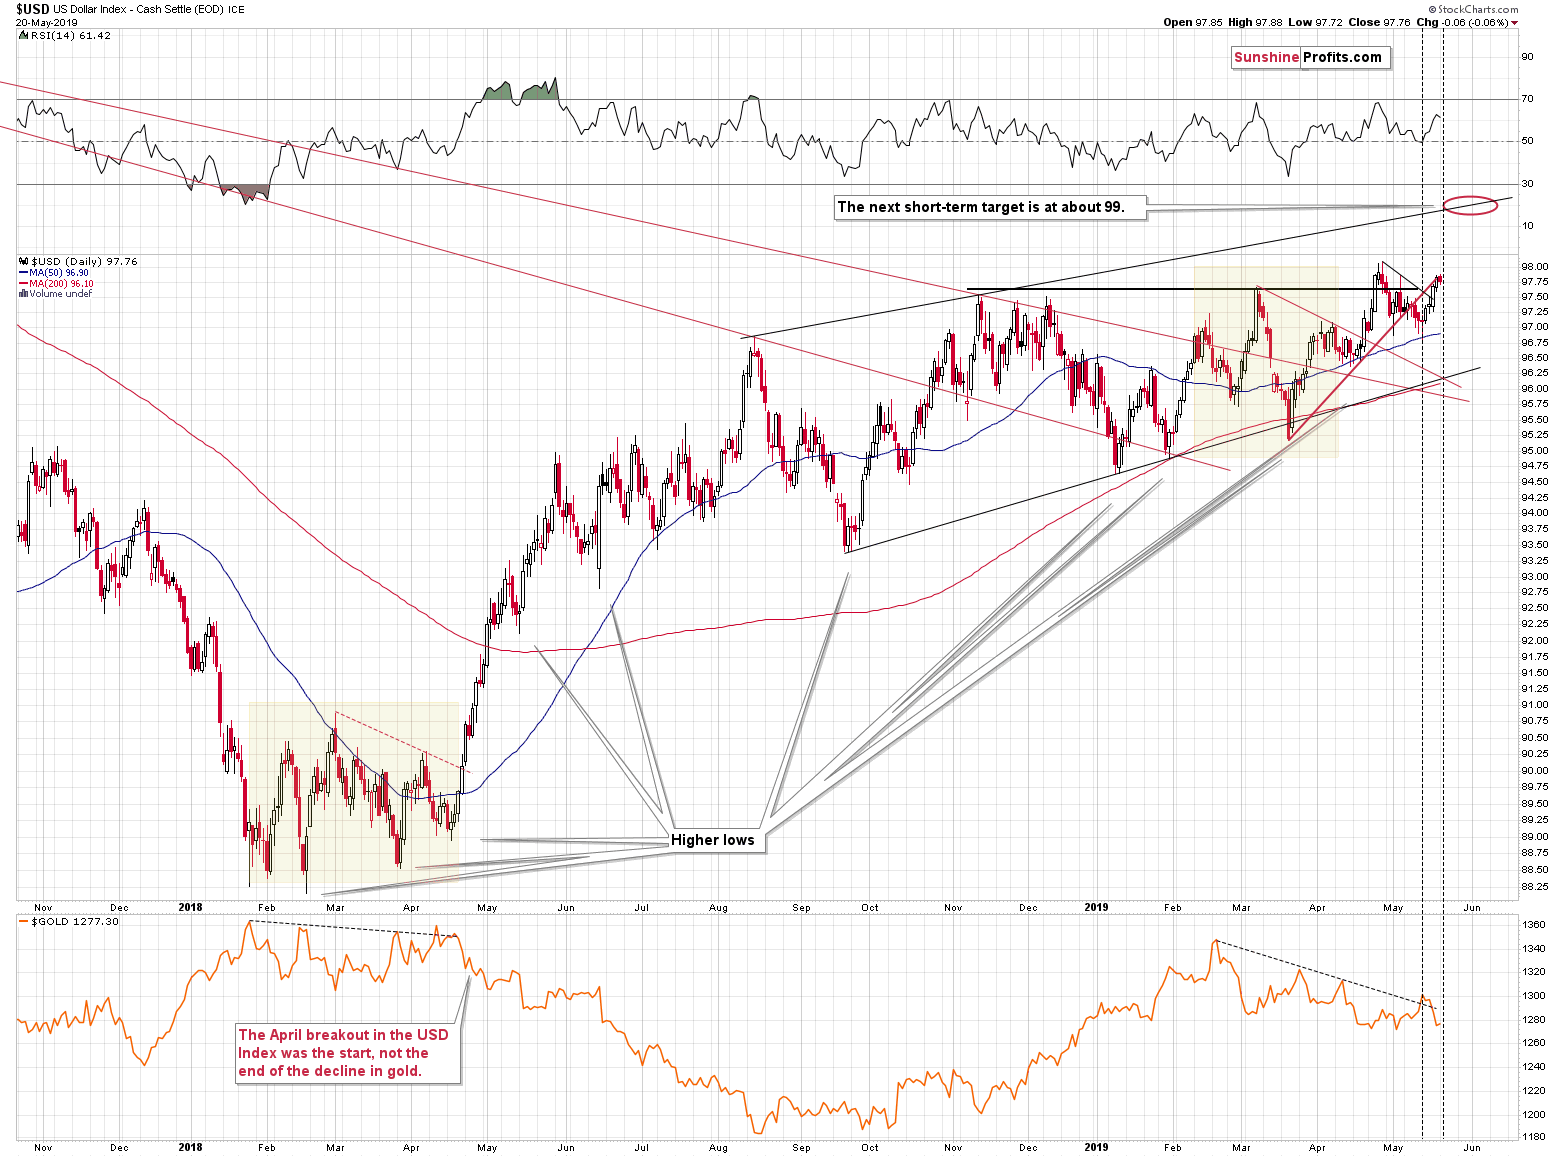
The USD Index reversed at the most recent triangle-vertex based turning point and move above the 2018 highs once again. While we haven't seen a breakout above the April high, yesterday's close was fourth highest close of this year. And that's all taking place while the trade war is on, which should undermine US dollar's appeal. Let's not forget that the Fed turned dovish in late March and this didn't change in the meantime. Yet, the USDX is above the March highs.
This is a very bullish combination and it serves as another confirmation of the short-term nature of the impact that news (especially the ones of geopolitical nature) have on prices. The trend is what really matters and the way to detect the trend is to thoroughly and - as objectively as possible - look at the charts and analyze them in a complex manner.
The USD Index is pushing higher. The trigger that might propel it to new highs (and, quite likely, the 99 level), is the current triangle-vertex-based reversal. It's "current", because it's today. The vertex is based on the rising medium-term support lie based on the September 2018 and January 2019 lows as well as the declining short-term resistance line based on the March and early-April 2019 highs.
The USD has been moving higher recently, only pausing yesterday. So, it might be the case that the little decline yesterday was the only decline that was needed for today's reversal to be bullish. Or it could be the case that we'll see an intraday decline in the USDX that is then reversed and followed by a significant rally in the following part of the week. Either way, it seems that this turning point might be the one thing that pushes the USD Index higher, and this - in turn - can push gold, silver, and mining stocks much lower.
As far as the price moves in the metals and miners are concerned, we wrote practically everything in the opening paragraph, but let's take a more detailed look at what happened.
The Dynamics Across the PMs Sector
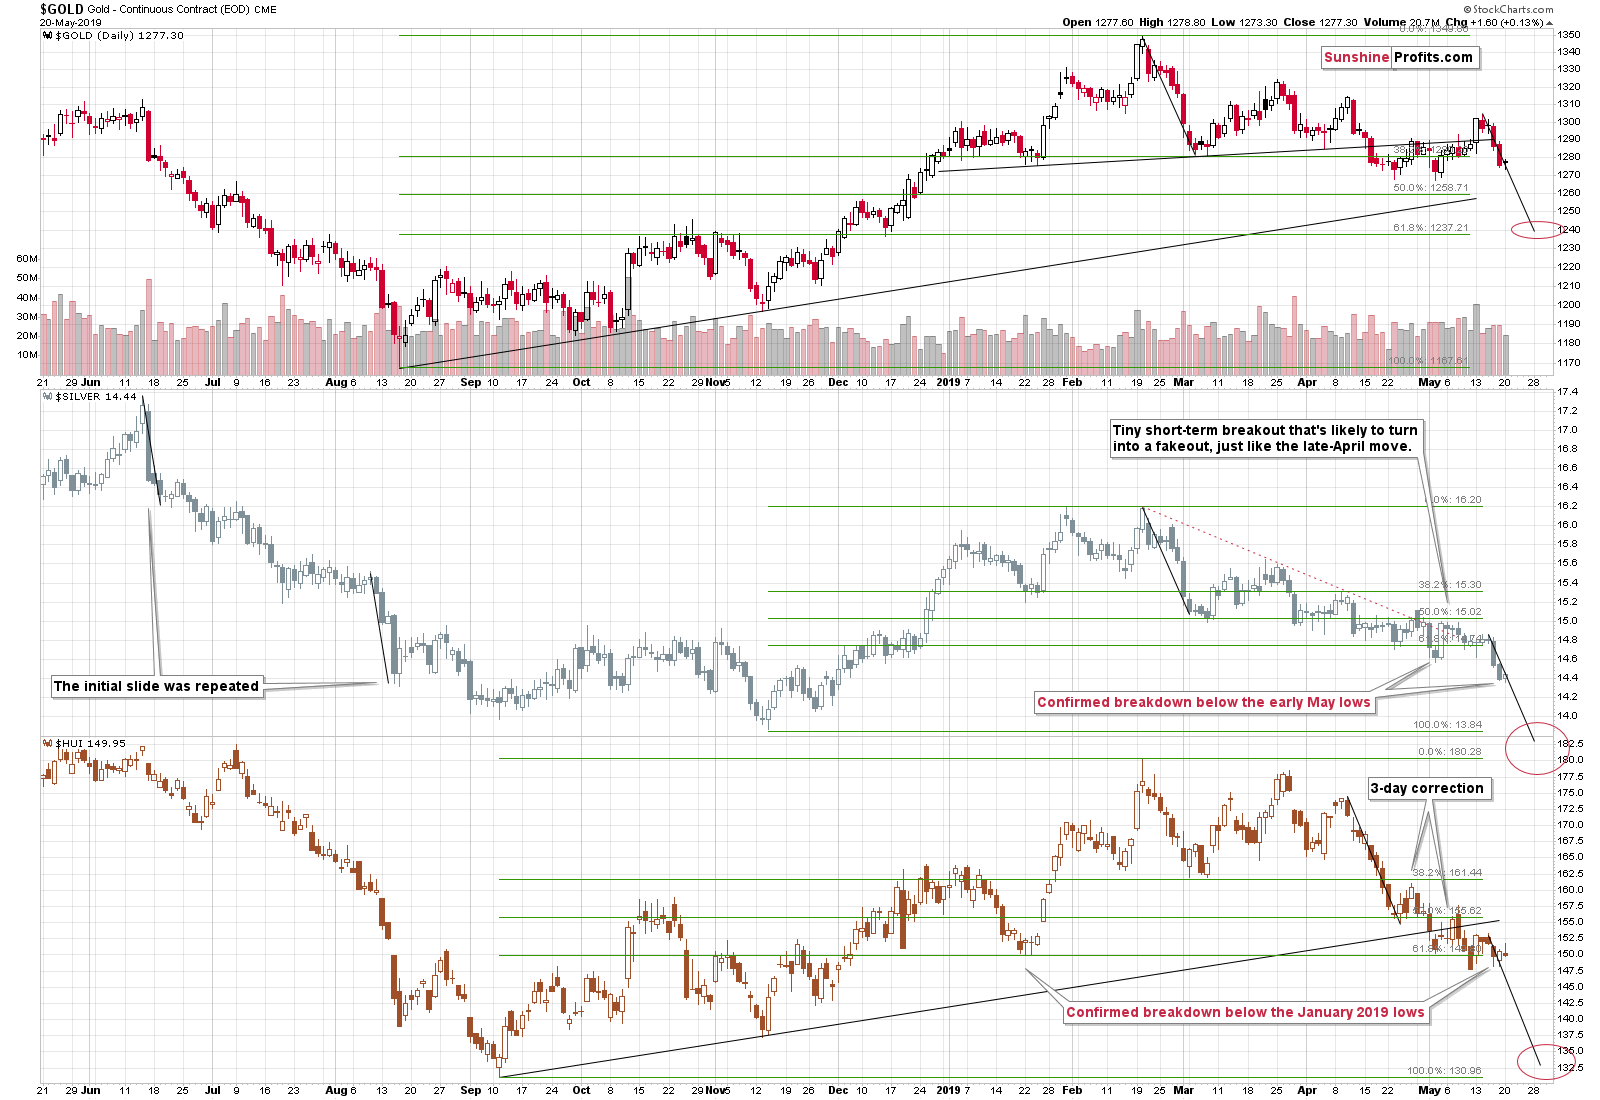
Gold and silver were basically flat and the same goes for mining stocks. The lack of movement in the miners is a bearish development, as it means that the recent breakdown below the January lows was just confirmed. This further increases the odds for the decline's continuation in the upcoming days.
Before summarizing, we would like comment on the platinum price moves, as it was requested by one of our subscribers. We will look at it from two angles: directly and by comparing it with the price of gold. The latter provides a particularly meaningful indication for the following months.
Let's start with the basic price chart.
Platinum in Focus
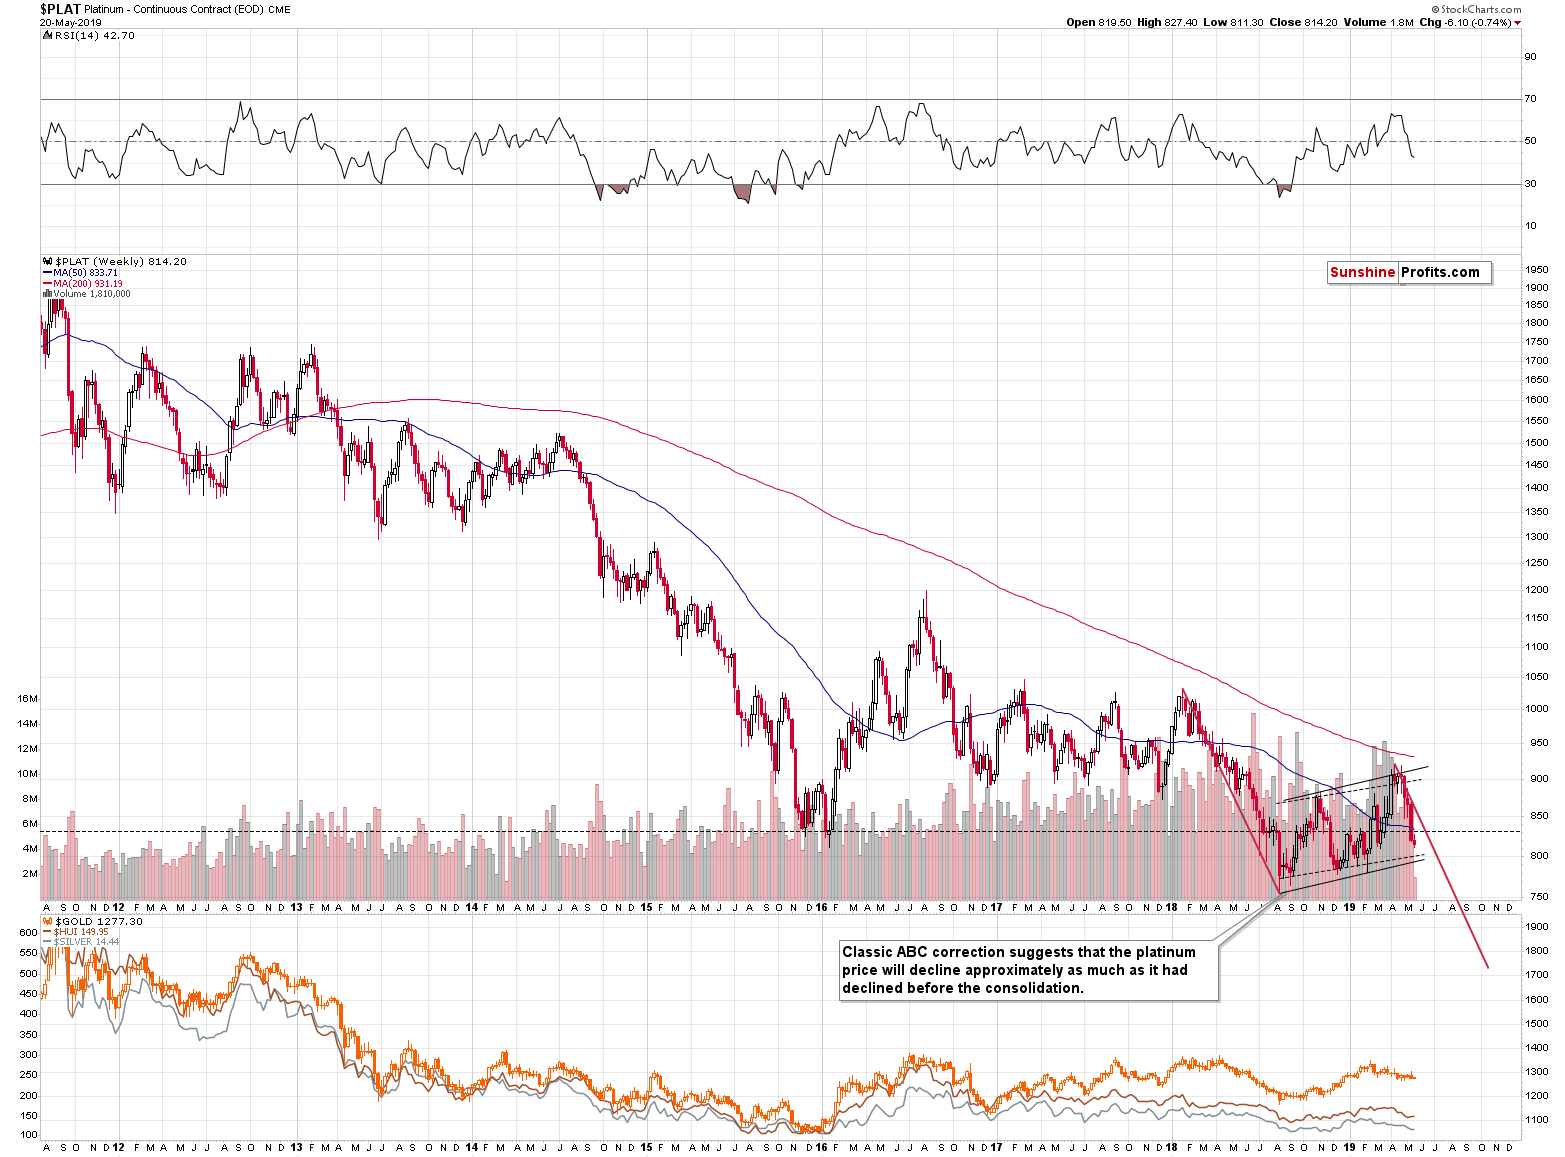
Platinum is once again below its 2015 lows. The previous attempts to break below this level were invalidated, but it seems that this attempt will actually be successful. You're probably wondering what's different about this attempt that makes us think that the result will be different.
The difference comes from the preceding action. This time, the decline was preceded by a huge zigzag correction (also known as the ABC correction, which is a type of a flag formation), which is a classic way for any market to correct a bigger move. Correct - not end.
When platinum was breaking below the 2015 lows last year, the RSI indicator was at - and then a bit below - 30. Right now, it's over 40 - close to the middle of its trading range. Platinum has therefore a lot of room for declines before it becomes oversold.
Flag formations tend to be followed by the price action that's similar to the price moves that preceded it. We used red lines to show what this means. In short, it means a sizable decline to about $675. The time estimate looks at the final quarter of the year, which is in tune with when we expect to see the final bottom in the rest of the precious metals sector.
Platinum is likely bottom at approximately the same time as gold and silver, just as how they bottomed in mid-2013 and late-2015 / early-2016. Consequently, the outlook for platinum confirms our bearish take on gold and silver in the following months.
For now, platinum is still a bit above the $800 level and within the consolidation pattern. Once it breaks below its lower border and moves to new 2019 lows, the breakdown above-mentioned bearish implications will be in full force.
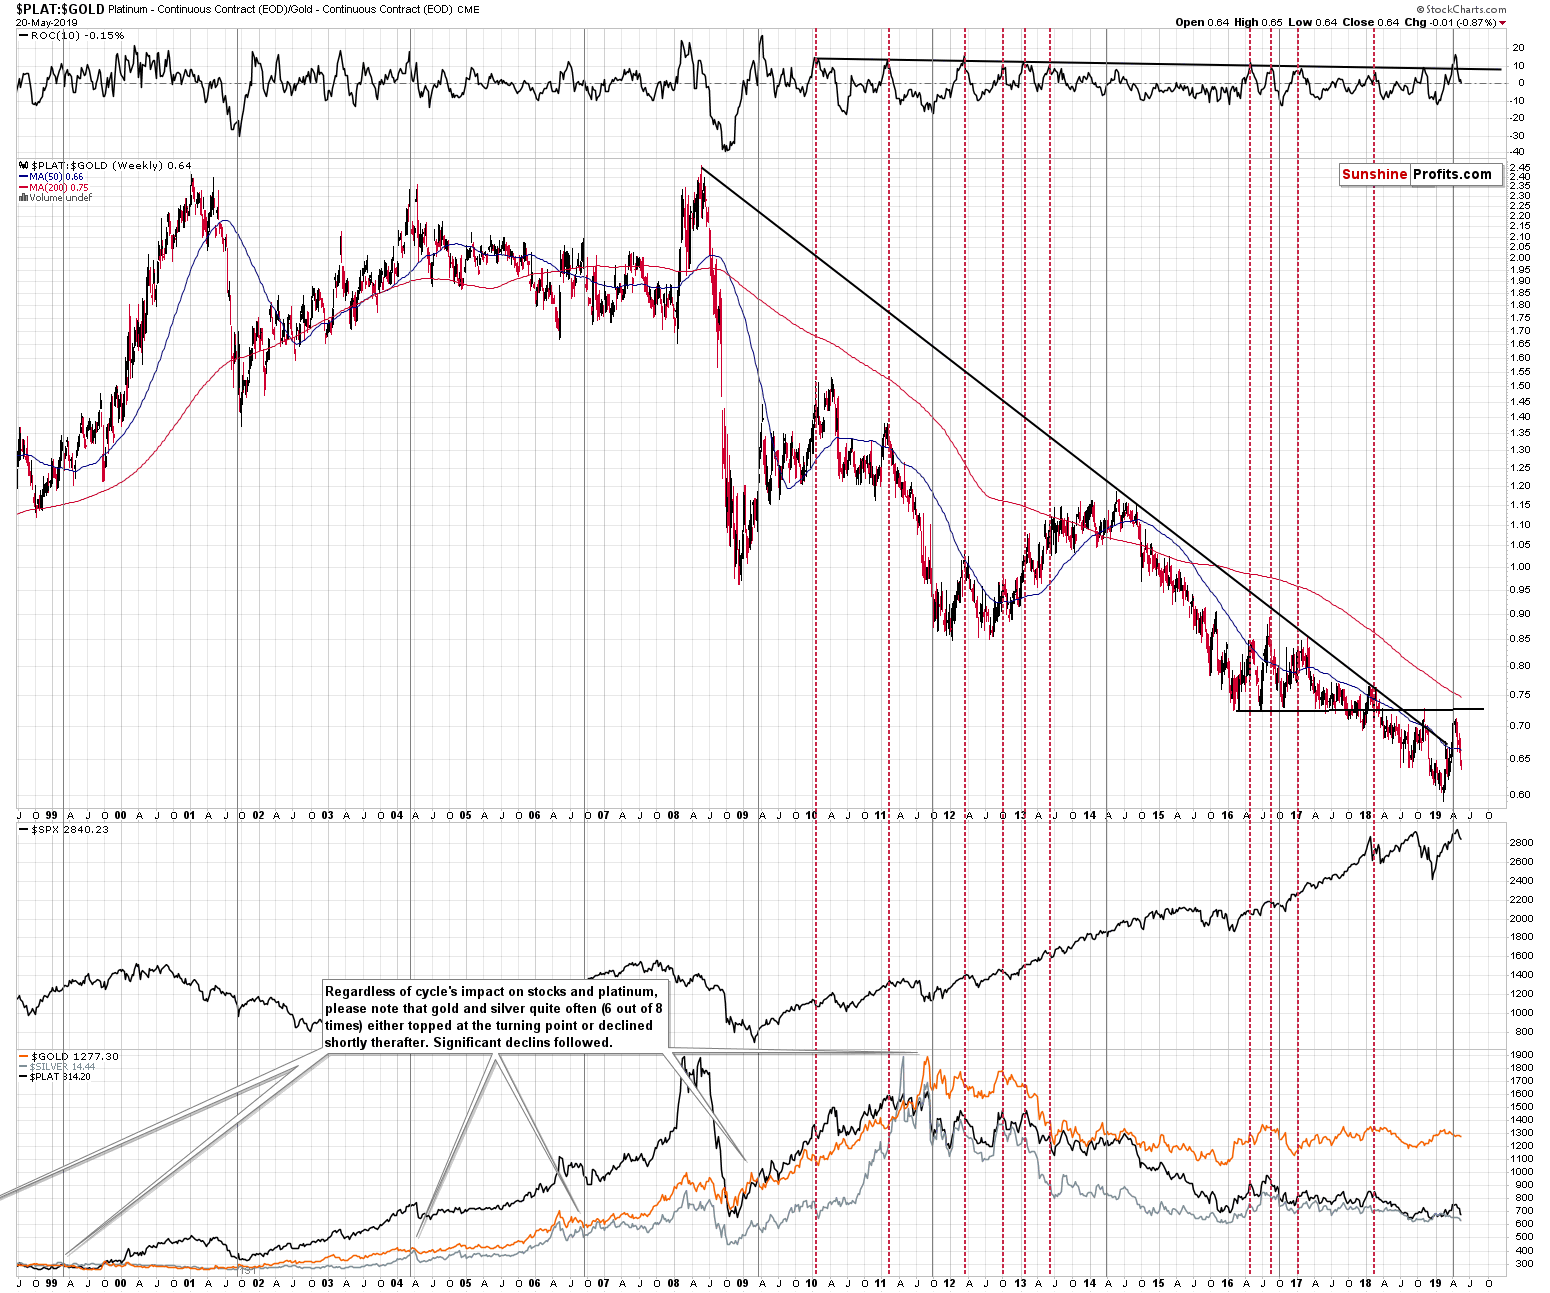
Comparing platinum and gold through the platinum to gold ratio provides us with an additional bearish confirmation.
The reason is the very long-term (over 2 years) cycle in the ratio that also tends to work for other precious metals and for the general stock market. The cyclical turning point was preceded by strong short-term rally in the platinum to gold ratio as well as by the rally in the general stock market. The ratio even temporarily broke above its very long-term declining resistance line.
The cycle worked perfectly. The ratio turned south in a dramatic fashion and it invalidated its earlier breakdown. The breakout turned out to have been a fakeout.
The implications are bearish for gold and silver in both: direct and indirect ways.
Directly, because the long-term cyclical turning points were followed by lower gold and silver prices in the vast majority of cases. The annotation on the chart was put years ago and it said about the 6 out of 8 efficiency. Since that time, we saw two more long-term cycles and they were both followed by lower PM prices. The 2014 turnaround was relatively flat but the 2016 one was quite decisive. Consequently, the up-to-date efficiency for the past 20+ years is actually 8 out of 10 - 80%. The initial follow-up of the current cyclical turning point suggests that the cycle has worked once again.
Indirectly, because the bearish implications for platinum are likely to translate into lower prices for gold and silver as well, as we discussed previously.
So, all in all, the outlook for the platinum price is bearish and it also has bearish implications for the following months in case of gold and silver.
Summary
Summing up, mining stocks confirmed the breakdown to new 2019 lows, which serves as yet another confirmation that the next big move will be to the downside. The situation in the platinum market also has bearish implications, but of more long-term nature. Gold might reach our interim target level of $1,240 shortly and thus we might adjust our trading position also relatively soon (quite possibly this week).
To summarize:
Trading capital (supplementary part of the portfolio; our opinion): Full short position (250% of the full position) in gold, silver, and mining stocks is justified from the risk/reward perspective with the following stop-loss orders and exit profit-take price levels:
- Gold: profit-take exit price: $1,241; stop-loss: $1,357; initial target price for the DGLD ETN: $51.87; stop-loss for the DGLD ETN $39.87
- Silver: profit-take exit price: $13.81; stop-loss: $15.72; initial target price for the DSLV ETN: $39.38; stop-loss for the DSLV ETN $26.97
- Mining stocks (price levels for the GDX ETF): profit-take exit price: $17.61; stop-loss: $24.17; initial target price for the DUST ETF: $34.28; stop-loss for the DUST ETF $15.47
In case one wants to bet on junior mining stocks' prices (we do not suggest doing so - we think senior mining stocks are more predictable in the case of short-term trades - if one wants to do it anyway, we provide the details), here are the stop-loss details and target prices:
- GDXJ ETF: profit-take exit price: $24.71; stop-loss: $35.67
- JDST ETF: profit-take exit price: $78.21 stop-loss: $30.97
Long-term capital (core part of the portfolio; our opinion): No positions (in other words: cash)
Insurance capital (core part of the portfolio; our opinion): Full position
Whether you already subscribed or not, we encourage you to find out how to make the most of our alerts and read our replies to the most common alert-and-gold-trading-related-questions.
Please note that the in the trading section we describe the situation for the day that the alert is posted. In other words, it we are writing about a speculative position, it means that it is up-to-date on the day it was posted. We are also featuring the initial target prices, so that you can decide whether keeping a position on a given day is something that is in tune with your approach (some moves are too small for medium-term traders and some might appear too big for day-traders).
Plus, you might want to read why our stop-loss orders are usually relatively far from the current price.
Please note that a full position doesn't mean using all of the capital for a given trade. You will find details on our thoughts on gold portfolio structuring in the Key Insights section on our website.
As a reminder - "initial target price" means exactly that - an "initial" one, it's not a price level at which we suggest closing positions. If this becomes the case (like it did in the previous trade) we will refer to these levels as levels of exit orders (exactly as we've done previously). Stop-loss levels, however, are naturally not "initial", but something that, in our opinion, might be entered as an order.
Since it is impossible to synchronize target prices and stop-loss levels for all the ETFs and ETNs with the main markets that we provide these levels for (gold, silver and mining stocks - the GDX ETF), the stop-loss levels and target prices for other ETNs and ETF (among other: UGLD, DGLD, USLV, DSLV, NUGT, DUST, JNUG, JDST) are provided as supplementary, and not as "final". This means that if a stop-loss or a target level is reached for any of the "additional instruments" (DGLD for instance), but not for the "main instrument" (gold in this case), we will view positions in both gold and DGLD as still open and the stop-loss for DGLD would have to be moved lower. On the other hand, if gold moves to a stop-loss level but DGLD doesn't, then we will view both positions (in gold and DGLD) as closed. In other words, since it's not possible to be 100% certain that each related instrument moves to a given level when the underlying instrument does, we can't provide levels that would be binding. The levels that we do provide are our best estimate of the levels that will correspond to the levels in the underlying assets, but it will be the underlying assets that one will need to focus on regarding the signs pointing to closing a given position or keeping it open. We might adjust the levels in the "additional instruments" without adjusting the levels in the "main instruments", which will simply mean that we have improved our estimation of these levels, not that we changed our outlook on the markets. We are already working on a tool that would update these levels on a daily basis for the most popular ETFs, ETNs and individual mining stocks.
Our preferred ways to invest in and to trade gold along with the reasoning can be found in the how to buy gold section. Additionally, our preferred ETFs and ETNs can be found in our Gold & Silver ETF Ranking.
As a reminder, Gold & Silver Trading Alerts are posted before or on each trading day (we usually post them before the opening bell, but we don't promise doing that each day). If there's anything urgent, we will send you an additional small alert before posting the main one.
=====
Latest Free Trading Alerts:
In May, the WGC published a new edition of its quarterly report on gold demand. It features interesting data about the changes in gold demand and supply. What does the Gold Demand Trends Q1 2019 say about the gold market in the first quarter of the year? How will its conclusions be reflected going forward in the gold price?
Gold Demand Rose 7% in Q1 2019. A Launching Pad Higher for Gold?
=====
Thank you.
Sincerely,
Przemyslaw Radomski, CFA
Editor-in-chief, Gold & Silver Fund Manager

