

Briefly: In our opinion, full (200% of the regular size of the position) speculative short positions in gold, silver and mining stocks is justified from the risk/reward perspective at the moment of publishing this alert.
Gold rallied right after the rates were increased and while it declined yesterday, it’s certainly moving higher once again in today’ pre-market trading. Is gold really taking off and going TODAMOON or is it almost done with its counter-trend rally?
The latter still seems much more likely. In yesterday’s analysis, we discussed the likely reason behind the upswing, and the long-term charts. The details regarding all the above remain up-to-date, so in today’s alert, we focus on the short-term charts. Let’s get right to them.
HUI Patterns
In yesterday’s alert, we wrote the following:
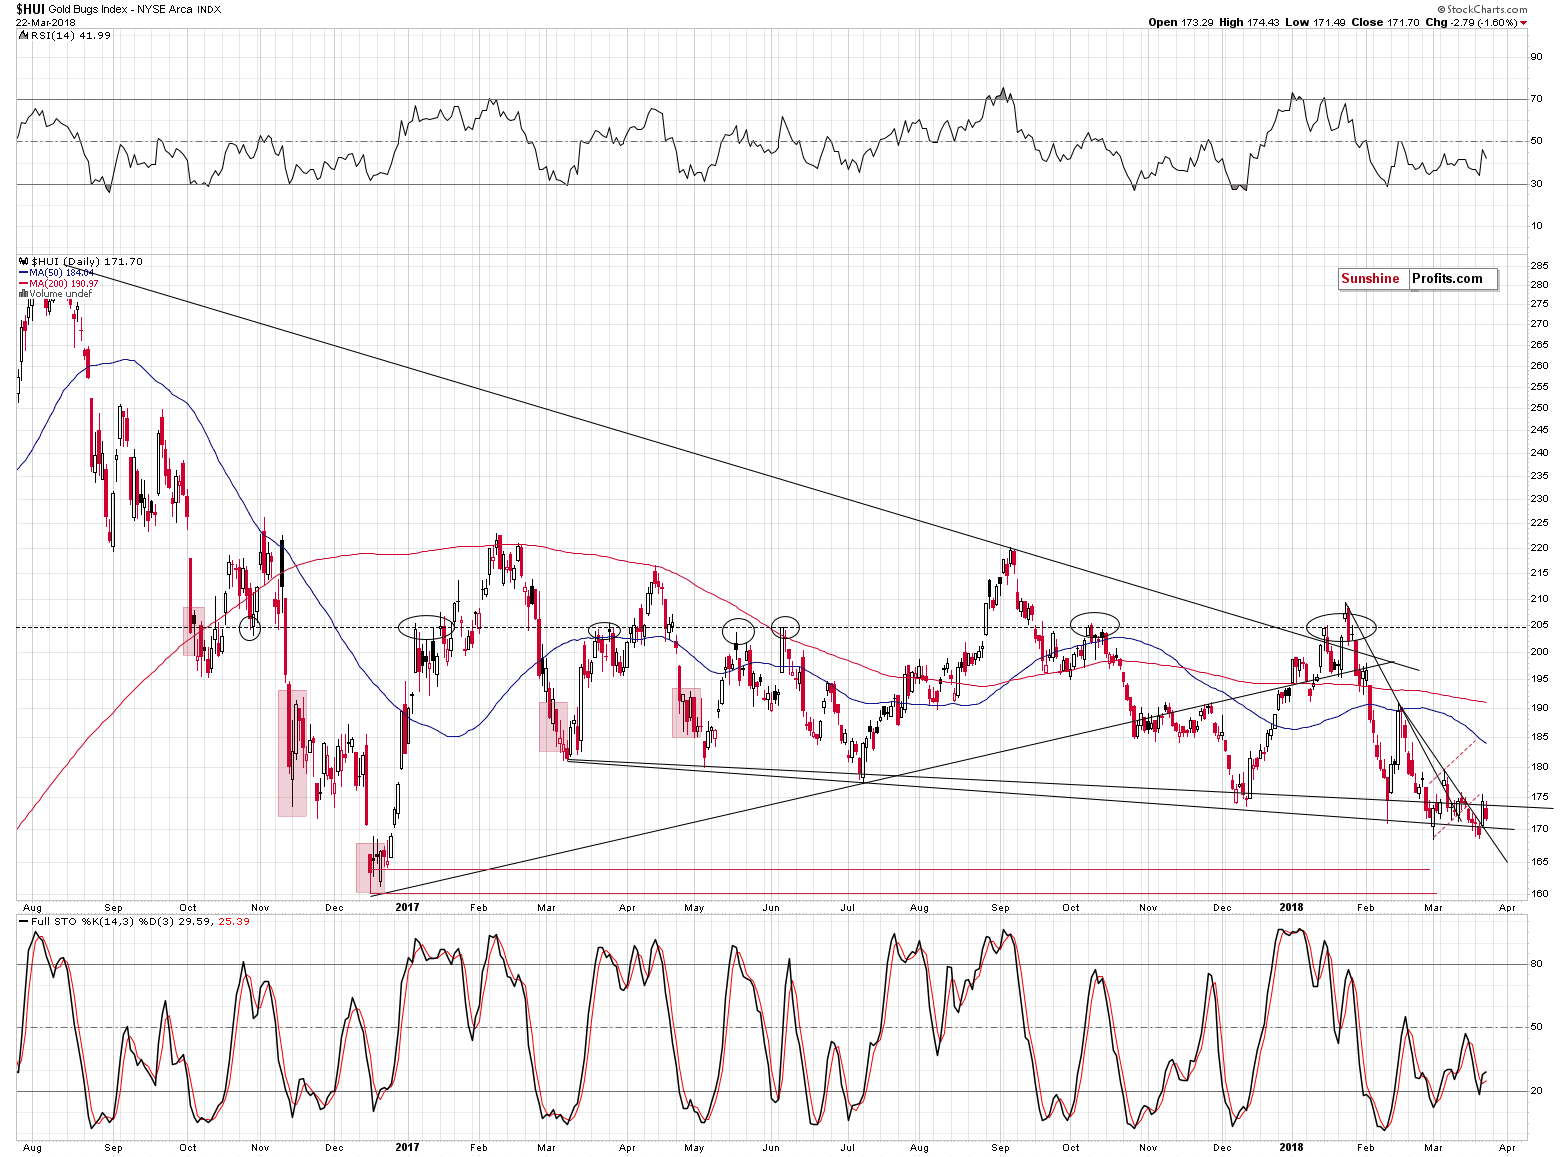
Some will say that gold stocks broke above the declining support line based on the mid-February high and the early March high, and that’s correct. What’s incorrect, however, is to view the above as a strongly bullish development. Yes, breakouts are indeed bullish developments in general, but they should be confirmed and that was not the case. Moreover, there are three additional reasons not to trust the bullish implications.
First, the HUI Index moved to the rising red resistance line, so yesterday’s rally could have been a verification of the previous move below it.
Second, we already saw an analogous breakout recently and it was followed by lower, not higher prices. The declining resistance line based on the January and mid-February highs was broken in early March and lower prices followed immediately. Even yesterday’s closing price is below the previous March high.
Third, during the previous attempts to move below the 170 – 180 range, the HUI Index rallied shortly after each attempt (March 2017, May 2017, July 2017, December 2017), but this year is different. Instead of starting another monthly rally or so, gold miners continue to move toward lower price levels and each attempt was followed by a corrective rally that was smaller than the previous one. The late February rally was smaller than the December 2017 – January 2018 rally, and the early March rally was smaller than the late February rally. So far, yesterday’s rally is smaller than the early March upswing, so the entire pattern remains in place.
By the way, please note that gold stocks didn’t move very close to their early March high, even though gold did. This is yet another sign of gold stocks’ weakness.
If gold miners were showing strength, we might think that the outlook has indeed changed, but in light of the above, it looks like yesterday’s rally was rather a random emotional reaction to a spike in uncertainty. As such, it probably didn’t change anything regarding the overall trend – which remains down.
In short, the above remains up-to-date. Gold stocks declined during yesterday’s session, erasing about half of Wednesday’s gains.
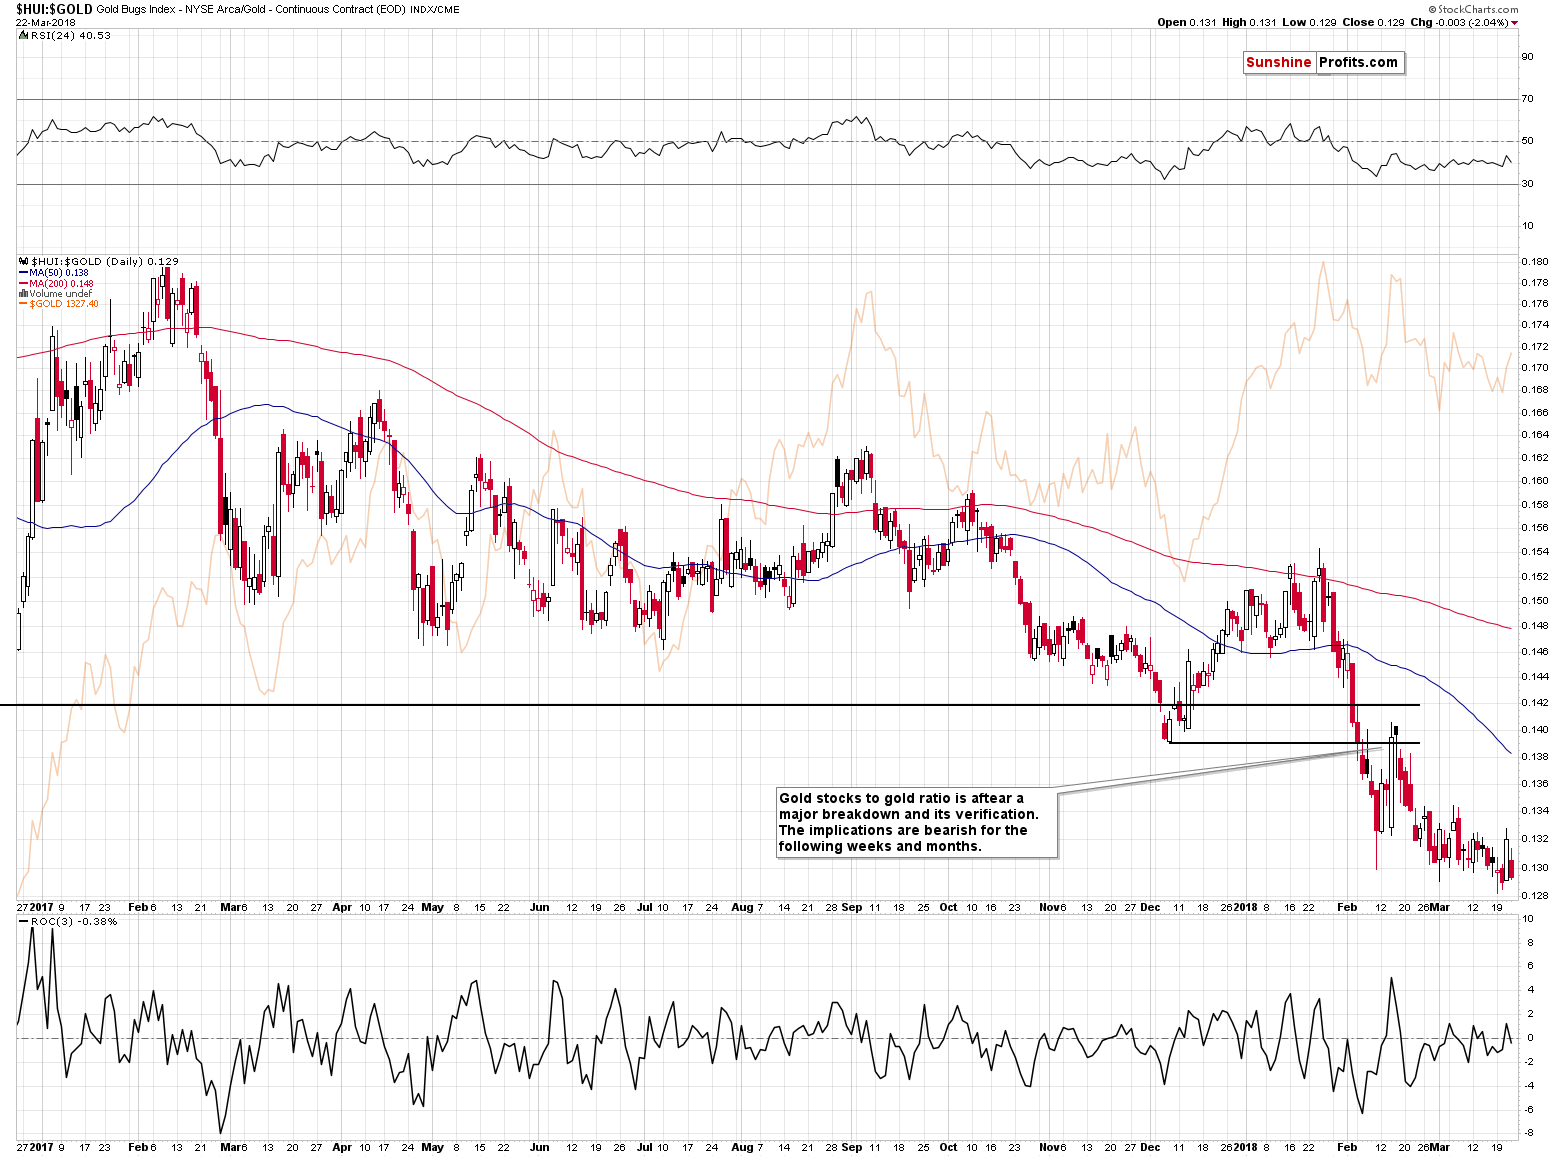
In the case of their relation to gold, almost the entire daily upswing was erased. In early March, we saw a similar daily upswing that was immediately followed by an invalidation and that was the final top.
In terms of intraday prices, we know that it wasn’t the top as gold moved higher during tonight’s trading, but perhaps we are have already seen the top in terms of daily closing prices. After all, there are many hours left before the end of the session and yesterday’s weakness in mining stocks clearly indicates that lower prices of precious metals are to be expected, not higher ones.
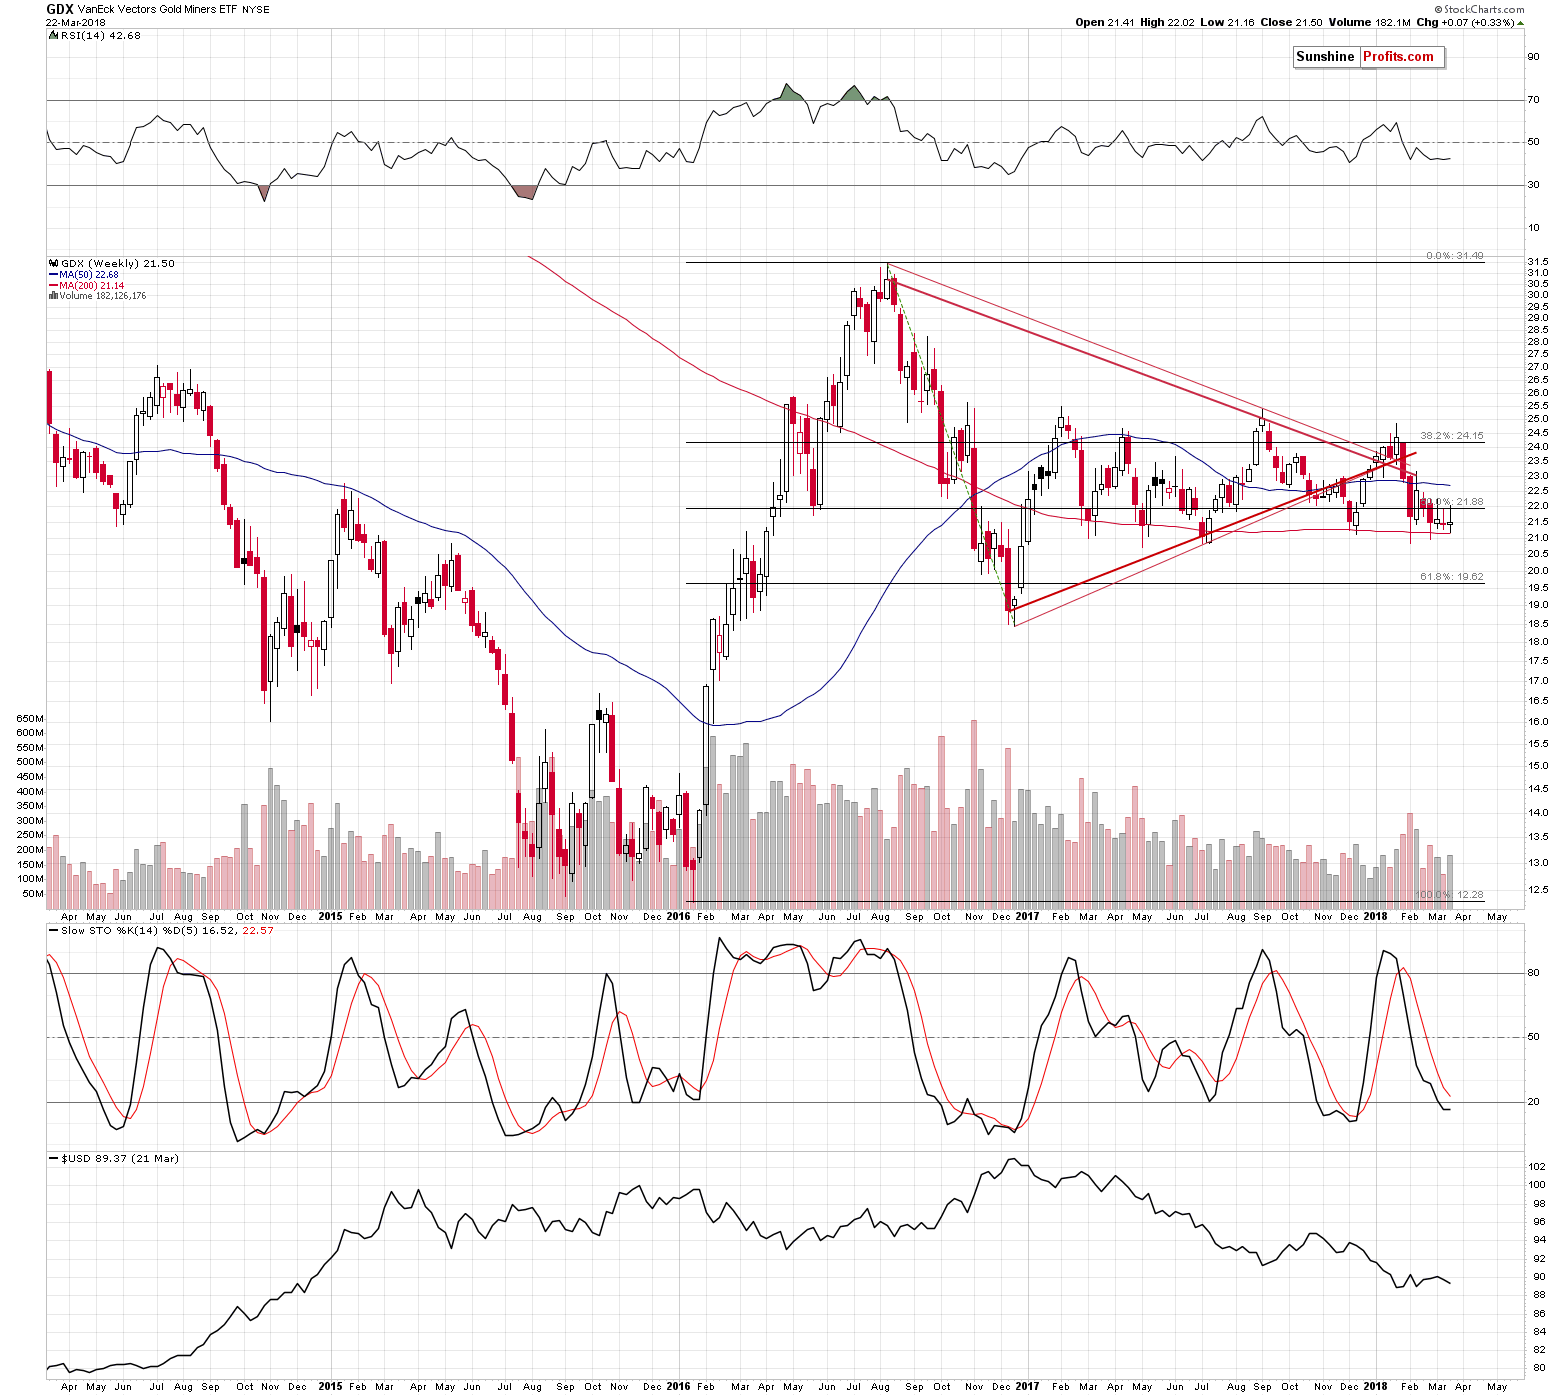
By the way, there was virtually no rally in terms of the weekly price changes – GDX is up by just 7 cents this week. Does it look bullish? Not at all.
Precious Reversals
In the case of gold, we’ll also start by quoting our previous comments:
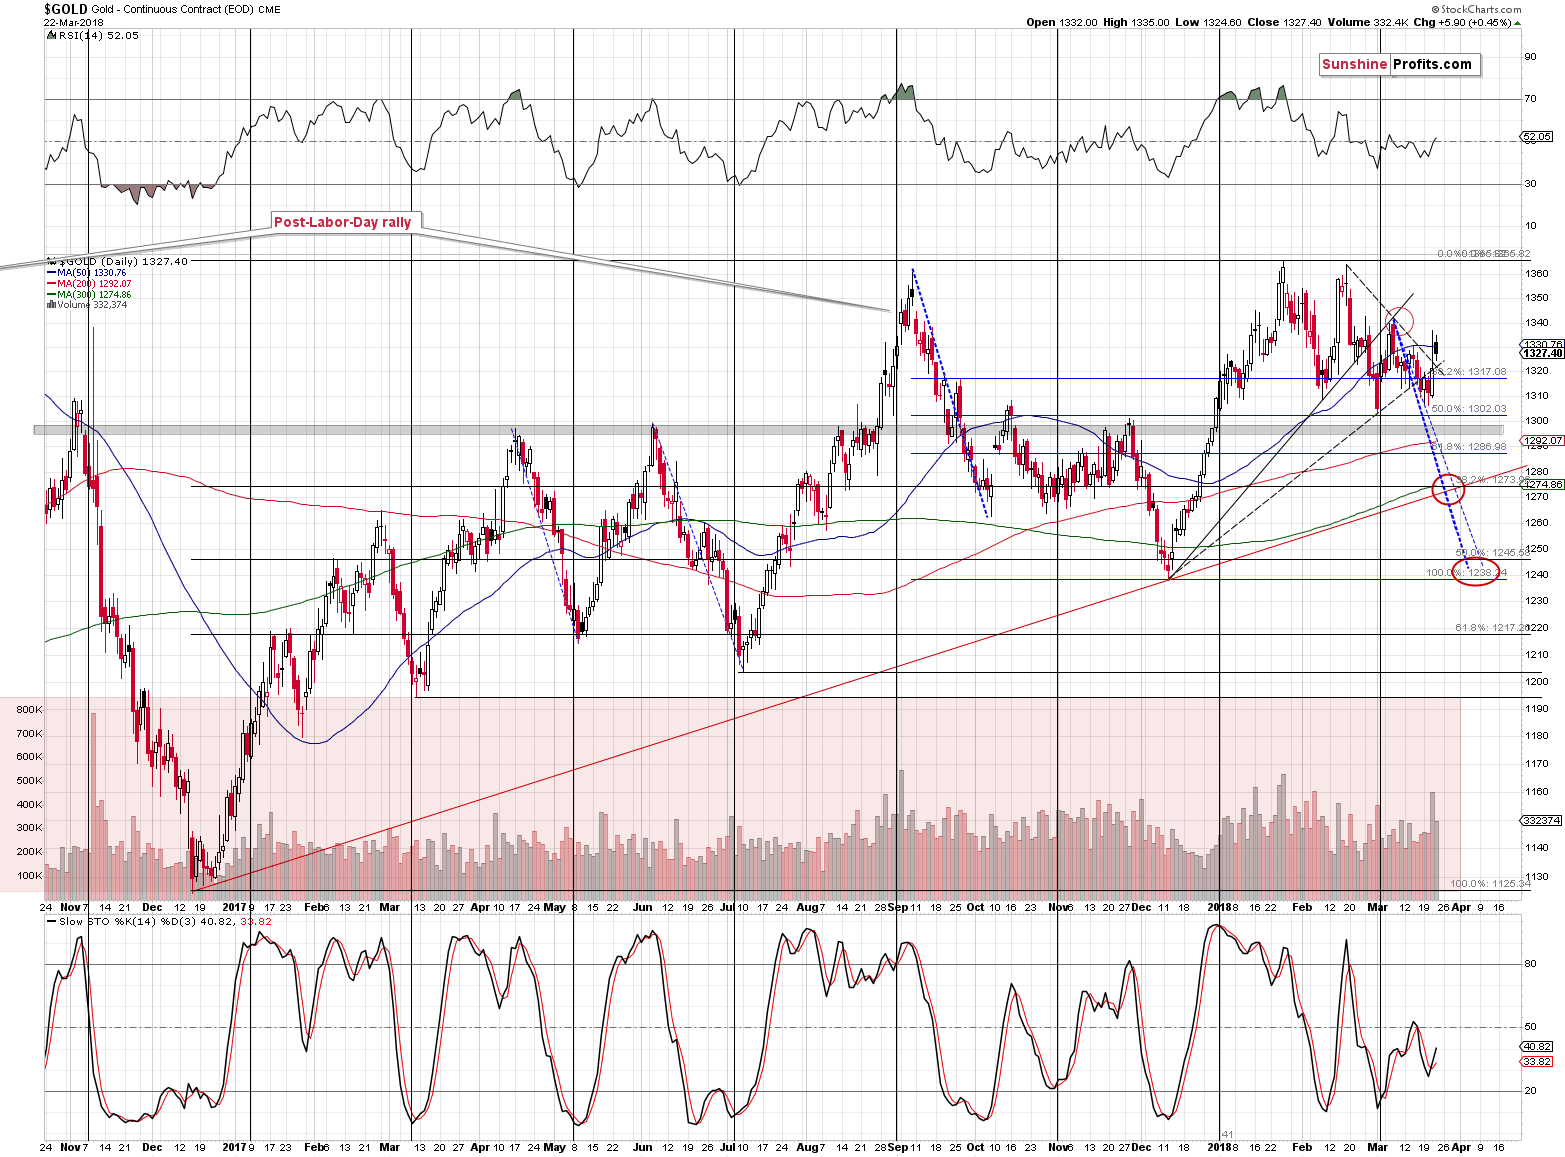
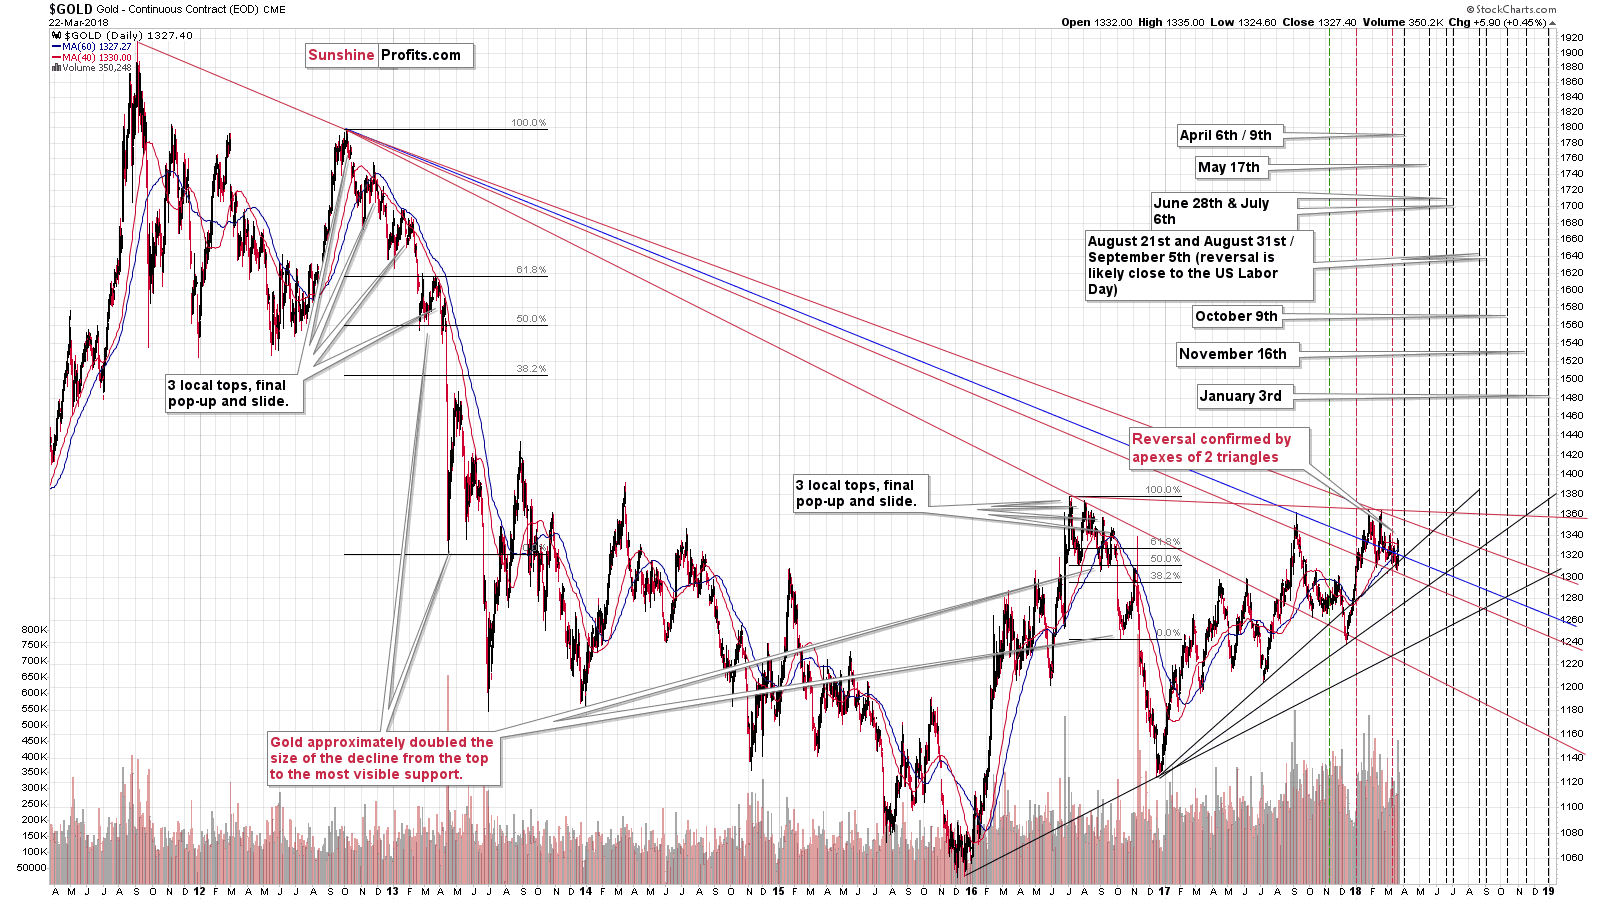
First of all, the 2012-2013 decline and the 2016 decline have both started in the similar way. Similarly to what we recently described in case of the euro, gold formed a triple top (each top being below the previous one) that was followed by an extra move up.
In both cases, after the breakdown below the previous low (the low that preceded the extra move up) gold continued to decline until it doubled the size of the decline between the first top and the final low. It’s easier to understand the relationship by looking at it on the above chart. The 50% retracement in early 2013 and in mid-2016 is the middle of the pattern. The 0% on the retracement tool is the bottom that one can predict and the 100% on the retracement tool is the first top.
Why is this interesting at this time? Because that’s exactly what gold formed recently.
It turns out that the mid-March top might have not been the “extra move up” – yesterday’s rally might have been it. The intraday high was very close to the March high, but not above it, so it fits the analogy very well. The pattern was not invalidated, and it continues to have bearish implications.
What did change was the way in which the apex of the triangle (dashed lines) worked. It seemed more likely that the reversal-indicating apex will be accompanied by a local bottom and based on what we saw yesterday, it seems that we have just seen a local top. Perhaps we’ll see one today because that’s precisely where the triangle’s apex is located.
What does the above change regarding the outlook? Nothing. Instead of a quick decline, we saw a quick daily rally, which is likely to be followed by a decline anyway based on the apex reversal.
Gold is still likely to decline before the end of the month and form a bottom either in the final days of March or in the first half of April. Actually, we could have two separate bottoms, one in early March, then a corrective upswing, and then another decline with a bottom close to April 9th – that seems likely based on the shapes of the previous declines and the predicted reversal dates (see the above chart or Monday’s analysis for details).
Gold’s decline during yesterday’s session perfectly fitted the above theory according to which gold was in the stage of the final “extra move up”.
But, since gold moved to new highs and slightly above the early March top (it was $1342), can we still view the above-mentioned analogy as being continued?
There were just two previous cases that we’re basing the analogy on and the shape of the final “extra move up” was not identical among them. In fact, they differed quite a lot. So, should a move slightly above the previous high make a huge difference? No, especially that it’s not confirmed by a closing price – at this moment it’s nothing more than overnight price action.
Unless gold rallies much higher from the current levels (meaning well above $1,340), the overall price shape of the “triple-top plus an extra upswing” pattern will remain intact and so will its bearish implications.
As far as silver is concerned, in yesterday’s alert, we wrote the following:
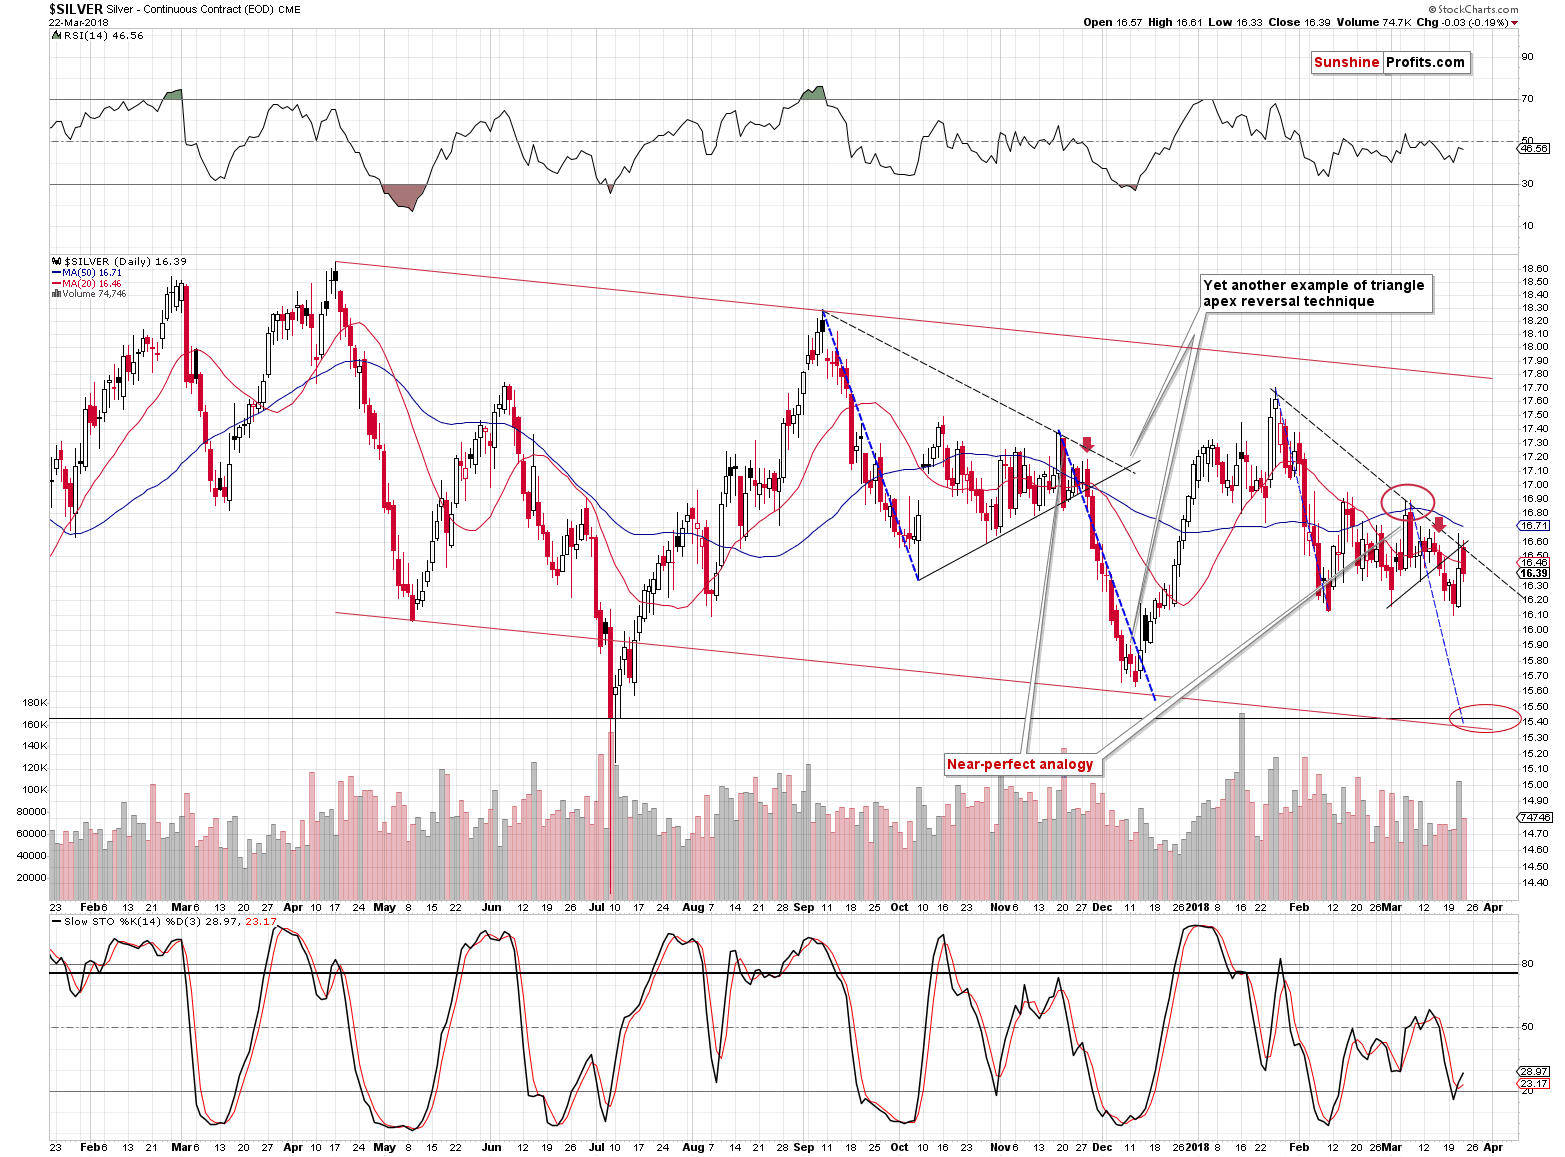
We can say practically the same thing about the apex-based reversal in the case of silver. The white metal moved higher and it’s likely to reverse based on the apex of the triangle.
In light of yesterday’s daily upswing, it doesn’t seem that we’ll see the final low for this short-term decline before the end of the week, but seeing it before the end of the month seems likely.
Yesterday’s move higher broke the near-perfect analogy between the current price moves and what we saw in November 2017, but is everything lost regarding this tool? It’s too early to say so. Just like one swallow doesn’t make a summer, a one-day anomaly doesn’t necessarily invalidate the entire similarity, especially that it was event-driven. If silver continues to decline from here and/or invalidates yesterday’s rally shortly, then the analogy will be upheld. If, however, silver starts to consolidate at the current levels, the analogy will be gone. For now, the former outcome seems more likely.
Just like it was the case with gold, yesterday’s price action in silver perfectly confirmed the above. And – again similarly – the overnight action aims to challenge it.
In the case of silver, however, we don’t have a move to new highs and the price of the white metal more or less moves in tune with how it performed yesterday before the intraday decline. Consequently, in the case of silver, the bearish implications that we described yesterday clearly remain in place.
So, the outlook for silver definitely remains bearish and we can say the same thing about gold, while noting that the short-term outlook could change if gold closes the day and week substantially higher. That doesn’t seem likely, especially in light of yesterday’s weak performance of the mining stocks.
Let’s check what happened in the USD Index.
Repeat of USD’s Bullish Sign
Quoting our yesterday’s comments:
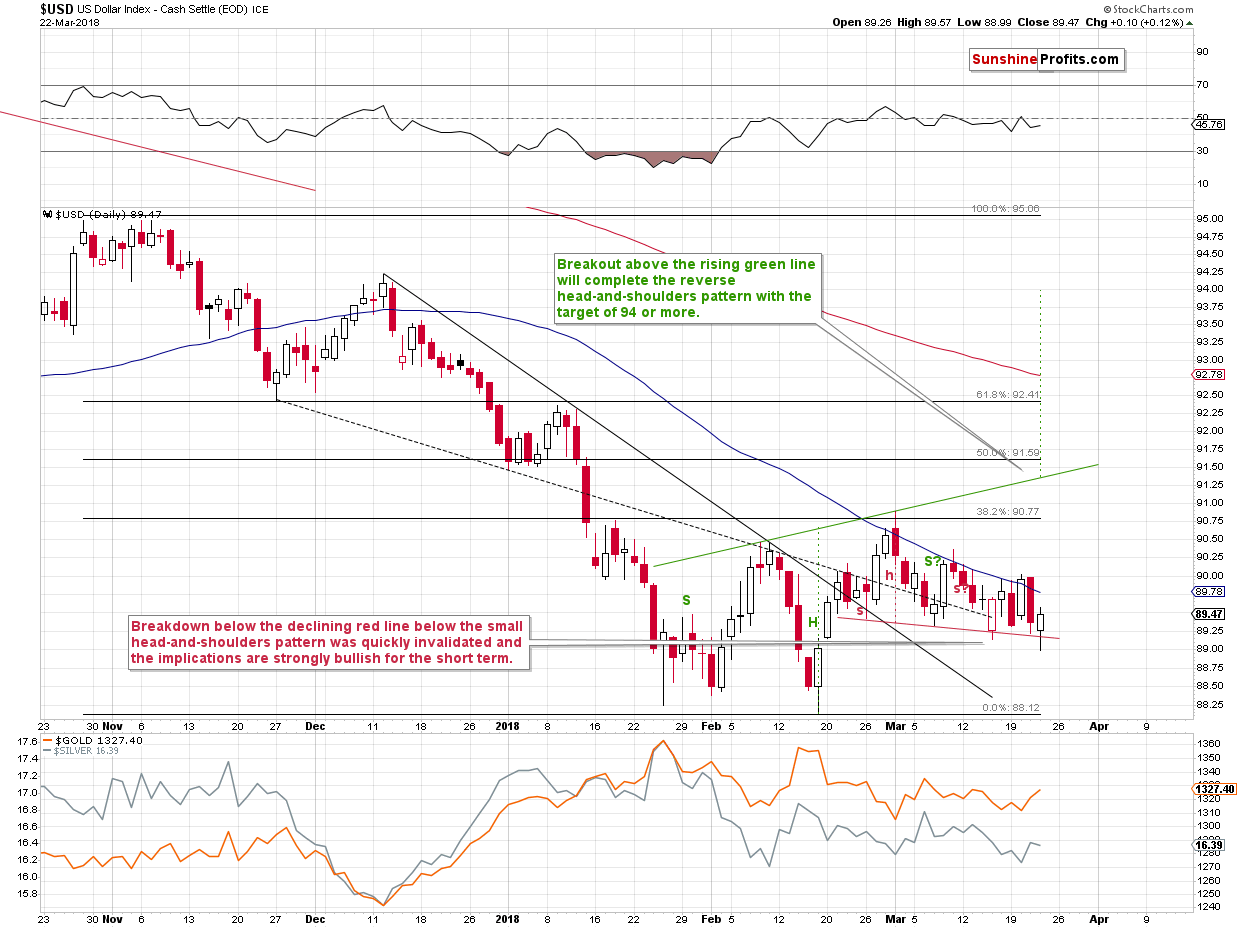
The data for the USD Index from Stockcharts still seems to be rather incoherent, so the reason that we’re featuring the USD Index anyway is that we want to show you that even despite the possible data error and even though the index fell substantially on an intraday basis, the previously discussed head-and-shoulders formation was not broken. Therefore, the bullish implications of the March 15 invalidation of the breakdown remain in place.
In other words, the bullish implications of the March 15 session remain intact. Yesterday’s decline didn’t change them as there was no new breakdown below the declining red line, which is also the neck level of the small head-and-shoulders pattern.
The particularly interesting development is that yesterday we saw a repeat of the March 15 signal. The USD Index made another attempt to break below the neck level of the head-and-shoulders formation (it has two right shoulders at this time, which can be seen at times – the implications remain as if it was a regular pattern) and once again failed to hold the breakdown. The USD rallied back up and invalidated the earlier downswing. The implications are bullish for the USD, which is in turn bearish for the precious metals sector.
Before summarizing, we would like to quote yesterday’s comments on the current direction in the PM sector in general and the discussion regarding trading decisions. There are no changes in these paragraphs, but we think that they are particularly worth keeping in mid – especially the one about decisions, so we’ll featuring them once again.
Weren’t PMs Supposed to Decline?
But you said that precious metals are likely to decline and they rallied – what gives?
Well, we told you the truth and we based it on very thorough and time-consuming research. The precious metals sector was indeed likely to decline. Yet, every now and then, market will do something unlikely and/or random. This seems to have been the case yesterday. The best thing that we can do is to review our previous analyses in light of the latest data – and we did. If the outlook had changed, we would be happy to close the current positions and consider opening long ones – but that didn’t happen. The outlook still seems to be very bearish, even though the volatility could continue today.
What Makes a Good Trading Decision?
While we’re discussing expectations vs. outcome, we would like to share an interesting analogy that might help to differentiate between what was a good decision and what was followed by a favorable outcome. That’s not the same thing.
There is a specific bias among individual investors (we didn’t observe this among investment professionals) to judge an investment decision based on its outcome. Well, it’s not that difficult to understand why this is the case. That’s how things work in the vast majority of areas. If you got a good outcome, then the decisions that led you to this outcome were good as well. If you got a bad outcome, then the decisions that led you to this outcome were bad as well. Simple and effective… As long as you remain in the areas of life that are deterministic, and one can be certain of a given outcome. If you try to apply the same way of thinking to areas that include probability, it doesn’t work anymore. It will work from time to time, but you can no longer say that a given effect meant that the decisions that led to it were good as well.
That’s rather counter-intuitive, so we came up with the analogy that should help you instantly understand the above and never forget it.
Think about someone who enjoys a party a little too much and gets drunk. They have arrived by car and then intend to get back home – driving while being intoxicated. And so they do. The road is pretty easy, they live nearby. They arrive at their home unharmed. They didn’t have to pay for a taxi or bother anyone else to take care of their transport back home. The outcome is certainly favorable. Consequently, the decision to drive while being drunk must have been a good one as well, right?
You see – that’s exactly what happens if probability is involved. You can’t judge the decision based solely on the outcome. The above was an extremely bad decision and yet, by pure luck, nothing bad happened. When they were getting behind the wheel, they didn’t know if they would arrive home safely, or if they would hurt themselves and others. Just because it turned out that the outcome was favorable didn’t change the fact that the decision was very bad. Repeating it will surely – eventually – result in extremely bad consequences. Again, the outcome is not a factor when judging whether a decision was good or not. It’s some kind of an indication, but a very weak one. What matters is how the decision corresponded to all the information that was available at the moment of making it and if this information was carefully analyzed and applied. In the case of the above example, brief analysis would imply that they should not drive at all as their reflexes and judgement were heavily impaired. Acting on this analysis and not driving would have been a good decision regardless of taxi costs etc.
Now, our speculative short position remains profitable as we entered very close to local highs, but let’s just assume – for the sake of the discussion – that the position is at a sizable loss now. Would that make the decision to have it in the first place a bad one? No, just like in the above example, it’s not something that you know at the moment of making the decision. You have price moves, volume levels, indicators, patterns, cycles, triangles and so on and you have to carefully analyze them. In order to judge whether a decision was good or not, one would have to forget about the outcome and get back to the analyses that covered the reasons for a given trading position and compare it with the information that was available at that time (!). If the analysis is done thoroughly and with care (taking many factors into account instead of using just one methodology like Elliott Wave Theory) by someone who has experience in a given area, then the decision to enter the trade is most likely good. Even if the trade ends up being a losing one.
Conversely, if someone went long gold based on incorrect analysis (for instance “gold is going to rally today, because of the massive amounts of U.S. debt” - that’s not correct, because the above is fundamental information that could drive the market in the following months and years, but it doesn’t generally impact daily price movements) that more or less randomly turned out to be true as gold rallied because of something else, then this was a bad decision, even though it was a profitable one. In this case bad analysis was just like drunk driving and profits were like arriving home without hurting anybody. It isn’t the outcome that determines whether a decision was good or bad – it is the decision process that makes the decision good or bad.
Summary
Summing up, yesterday’s session confirmed our previous bearish comments and while overnight trading seems to be making the situation bullish, after putting it into perspective, it turns out that it doesn’t change much. The fresh bullish signal from the USD Index along with further weakness in mining stocks suggest that lower, not higher, prices of precious metals are to be expected.
As always, we will keep you – our subscribers – informed.
To summarize:
Trading capital (supplementary part of the portfolio; our opinion): Full short positions (200% of the full position) in gold, silver and mining stocks are justified from the risk/reward perspective with the following stop-loss orders and initial target price levels:
- Gold: initial target price: $1,218; stop-loss: $1,382; initial target price for the DGLD ETN: $53.98; stop-loss for the DGLD ETN $37.68
- Silver: initial target price: $14.63; stop-loss: $17.33; initial target price for the DSLV ETN: $33.88; stop-loss for the DSLV ETN $21.48
- Mining stocks (price levels for the GDX ETF): initial target price: $19.22; stop-loss: $23.54; initial target price for the DUST ETF: $39.88; stop-loss for the DUST ETF $21.46
In case one wants to bet on junior mining stocks' prices (we do not suggest doing so – we think senior mining stocks are more predictable in the case of short-term trades – if one wants to do it anyway, we provide the details), here are the stop-loss details and initial target prices:
- GDXJ ETF: initial target price: $27.82; stop-loss: $36.14
- JDST ETF: initial target price: $94.88 stop-loss: $41.86
Long-term capital (core part of the portfolio; our opinion): No positions (in other words: cash)
Insurance capital (core part of the portfolio; our opinion): Full position
Important Details for New Subscribers
Whether you already subscribed or not, we encourage you to find out how to make the most of our alerts and read our replies to the most common alert-and-gold-trading-related-questions.
Please note that the in the trading section we describe the situation for the day that the alert is posted. In other words, it we are writing about a speculative position, it means that it is up-to-date on the day it was posted. We are also featuring the initial target prices, so that you can decide whether keeping a position on a given day is something that is in tune with your approach (some moves are too small for medium-term traders and some might appear too big for day-traders).
Plus, you might want to read why our stop-loss orders are usually relatively far from the current price.
Please note that a full position doesn’t mean using all of the capital for a given trade. You will find details on our thoughts on gold portfolio structuring in the Key Insights section on our website.
As a reminder – “initial target price” means exactly that – an “initial” one, it’s not a price level at which we suggest closing positions. If this becomes the case (like it did in the previous trade) we will refer to these levels as levels of exit orders (exactly as we’ve done previously). Stop-loss levels, however, are naturally not “initial”, but something that, in our opinion, might be entered as an order.
Since it is impossible to synchronize target prices and stop-loss levels for all the ETFs and ETNs with the main markets that we provide these levels for (gold, silver and mining stocks – the GDX ETF), the stop-loss levels and target prices for other ETNs and ETF (among other: UGLD, DGLD, USLV, DSLV, NUGT, DUST, JNUG, JDST) are provided as supplementary, and not as “final”. This means that if a stop-loss or a target level is reached for any of the “additional instruments” (DGLD for instance), but not for the “main instrument” (gold in this case), we will view positions in both gold and DGLD as still open and the stop-loss for DGLD would have to be moved lower. On the other hand, if gold moves to a stop-loss level but DGLD doesn’t, then we will view both positions (in gold and DGLD) as closed. In other words, since it’s not possible to be 100% certain that each related instrument moves to a given level when the underlying instrument does, we can’t provide levels that would be binding. The levels that we do provide are our best estimate of the levels that will correspond to the levels in the underlying assets, but it will be the underlying assets that one will need to focus on regarding the signs pointing to closing a given position or keeping it open. We might adjust the levels in the “additional instruments” without adjusting the levels in the “main instruments”, which will simply mean that we have improved our estimation of these levels, not that we changed our outlook on the markets. We are already working on a tool that would update these levels on a daily basis for the most popular ETFs, ETNs and individual mining stocks.
Our preferred ways to invest in and to trade gold along with the reasoning can be found in the how to buy gold section. Additionally, our preferred ETFs and ETNs can be found in our Gold & Silver ETF Ranking.
As a reminder, Gold & Silver Trading Alerts are posted before or on each trading day (we usually post them before the opening bell, but we don't promise doing that each day). If there's anything urgent, we will send you an additional small alert before posting the main one.
=====
Latest Free Trading Alerts:
The global economic growth relies on debt. Is it a sustainable model? Kondratiev doubted it. We invite you to read our today’s article to find out in which phase of the debt cycle we are – and what does it mean for the gold market.
=====
Hand-picked precious-metals-related links:
PRECIOUS-Gold shines as trade war fears rattle markets
Gold’s ‘Good Week’ Gets Better as Trade War Ignites Haven Demand
=====
In other news:
World stocks slide, yen jumps, as trade war fears grip markets
As Trade War Fears Slam Stocks, Winners Stand Out
Global stocks hit hard on trade war fears
=====
Thank you.
Sincerely,
Przemyslaw Radomski, CFA
Founder, Editor-in-chief, Gold & Silver Fund Manager
Gold & Silver Trading Alerts
Forex Trading Alerts
Oil Investment Updates
Oil Trading Alerts

