

Briefly: In our opinion, full (200% of the regular size of the position) speculative short positions in gold, silver and mining stocks is justified from the risk/reward perspective at the moment of publishing this alert.
More than two weeks ago, we described the very specific and very important pattern in the gold market, one of short- and medium-term importance. We wrote that the triangle apex pattern based on the intraday highs, pointed to a major reversal in the first half of March. The first half of March ends this week, so the key question is if the pattern was invalidated or are we about to see a major reversal in the price of gold.
In our view, the latter outcome is highly likely as it is confirmed also by other – independent – analogies. Let’s start with going back to the chart that we presented on February 26th (chart courtesy of http://stockcharts.com).
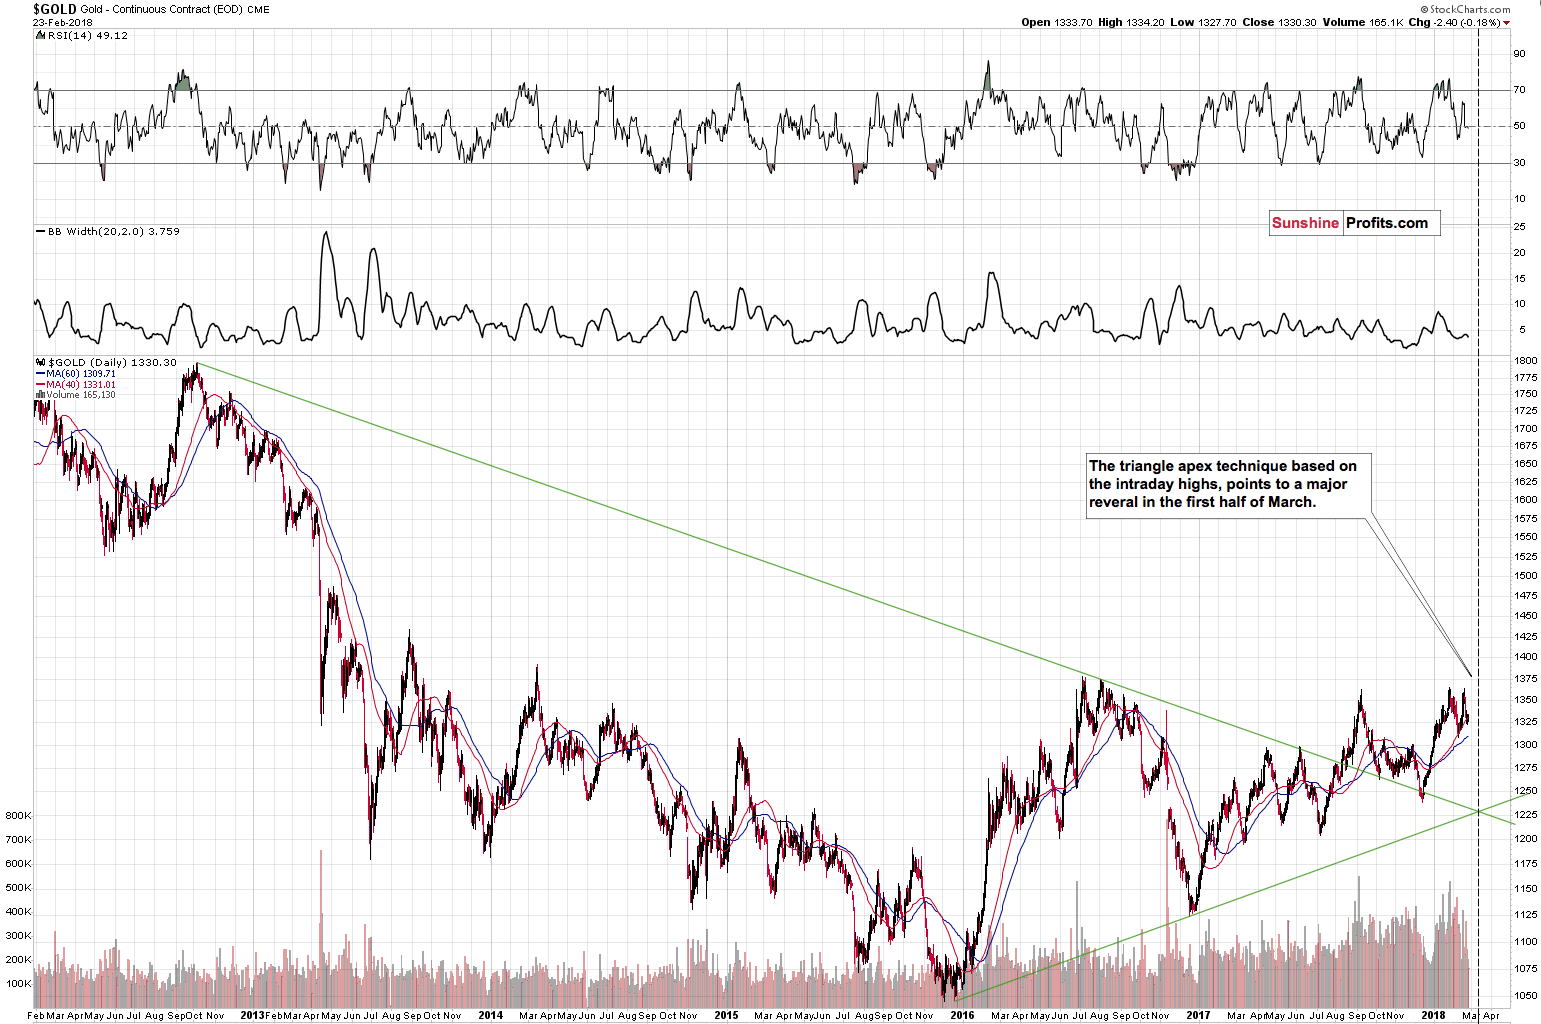
In the past two weeks gold didn’t soar – conversely, it was trading sideways and it’s currently lower than it was when we wrote the above. So, one might be wondering if the implications of the triangle’s apex are actually bullish, since the move in the last two weeks was down. They are not, because the pattern is based on medium-term lines, so we should also take medium-term rallies and declines into account while determining the implications of the turnaround.
The preceding medium-term move was up – gold moved higher in late December 2017 and for most of January 2018, topping a bit above $1,360. The back-and-forth movement since that time is rather a lengthy medium-term topping formation than a combination of price moves that should be analyzed independently – at least from the medium-term point of view.
Of course, if gold breaks above the $1,360 with a vengeance and confirms a big breakout above it, then the current back-and-forth trading will turn out to be a consolidation within a rally – but that’s not what seems likely at all. After all, gold wasn’t able to break above its 2017 and 2016 highs even though the USD Index declined a few index points below the analogous extremes.
The medium-term nature of the pattern has an additional important consequence. It is that we shouldn’t put too much weight on its precision in terms of days. A good rule of thumb is to zoom in or out on a given chart until the pattern that you want to analyze is clearly visible, and then check – without zooming in – if the price is just a bit away from what it should be doing based on the pattern, or not. In the case of our triangle apex reversal, the moment of reversal is “more or less here”, so if we see a reversal this week, it will be definitely in tune with the pattern – it will not invalidate it.
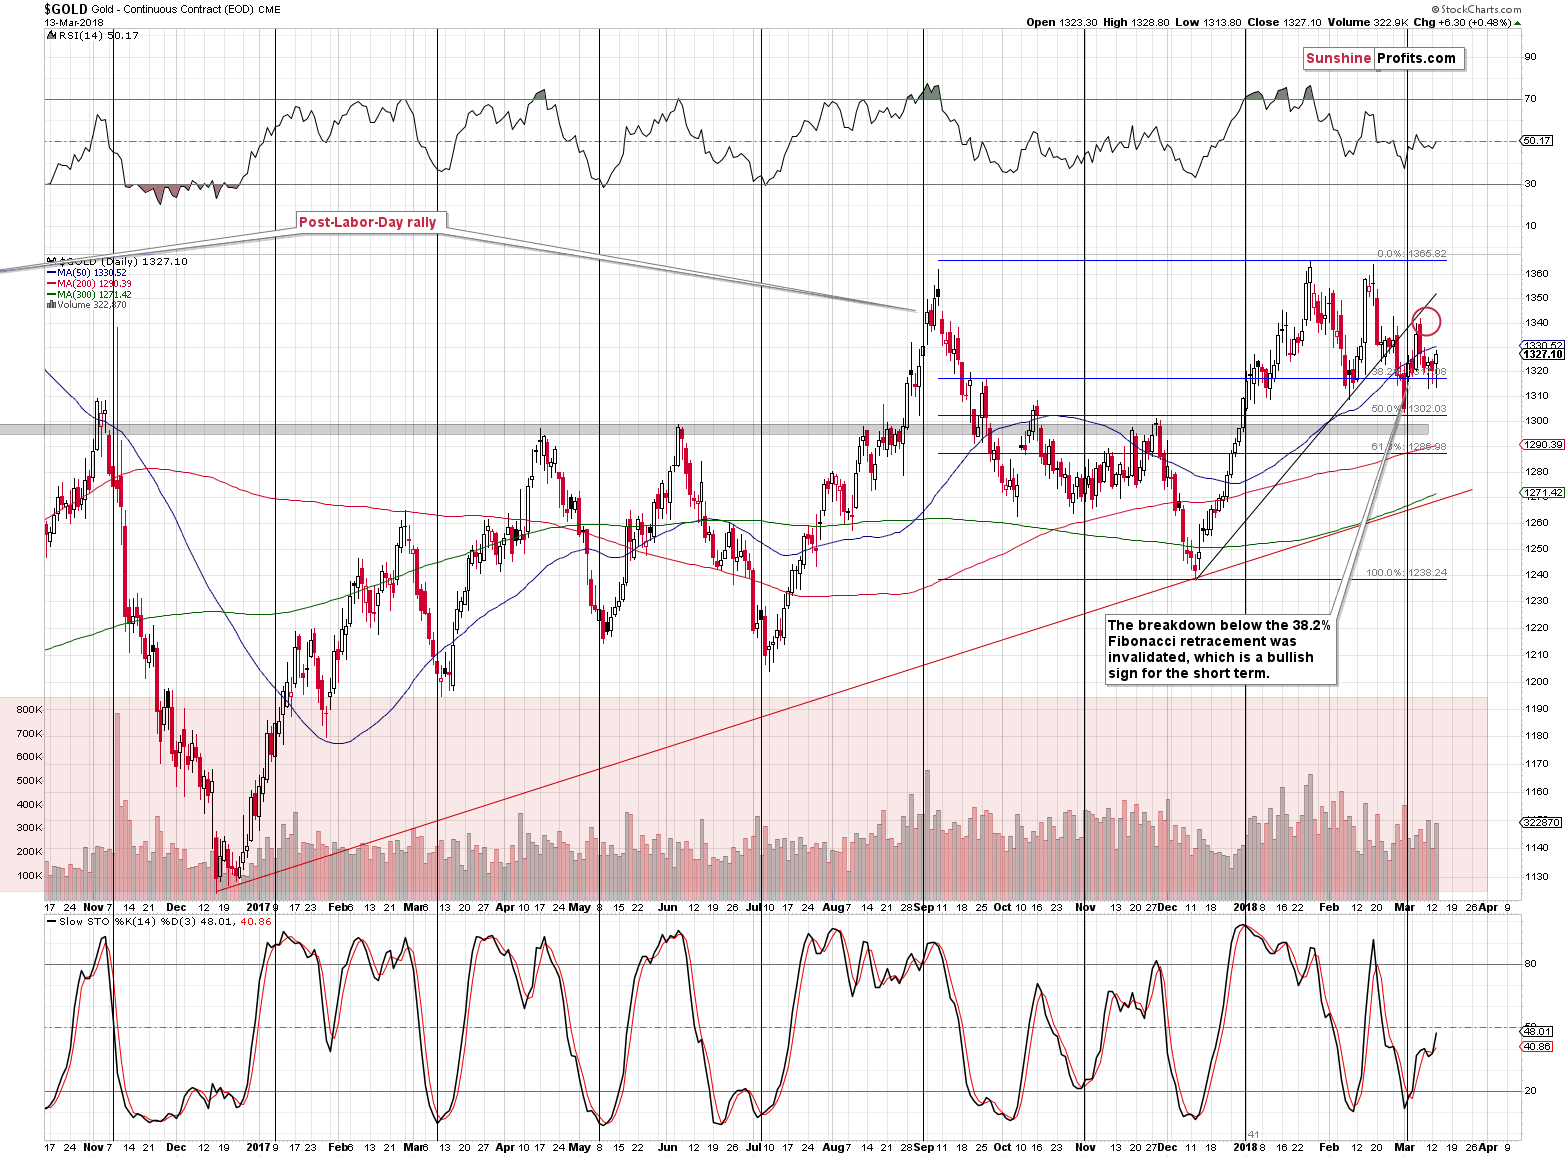
During yesterday’s trading gold moved higher without moving back above the 50-day moving average. If we are to see a major reversal and a powerful decline thereafter, then we should see / have seen at least some upswing beforehand. After all, what’s to reverse if there was absolutely no rally? Consequently, it seems that yesterday’s rather small upswing is perfectly understandable in the current market situation. Besides, we wrote in the previous analyses that slightly higher prices could be seen. This seems to be it. We don’t expect significantly higher gold prices before the reversal, though.
Earlier today, we wrote that the bearish case is supported by also other analogies. One of them is to the previous breakdown below the 50-day moving average.
Back in early December 2017, the breakdown below the 50-day MA was followed by a brief pause and the decline continued only after that time.
This is something that we’re seeing also this time – the pause and a small rally is a verification of the breakdown below the MA, which has bearish implications.
Silver’s Striking Similarity Continues
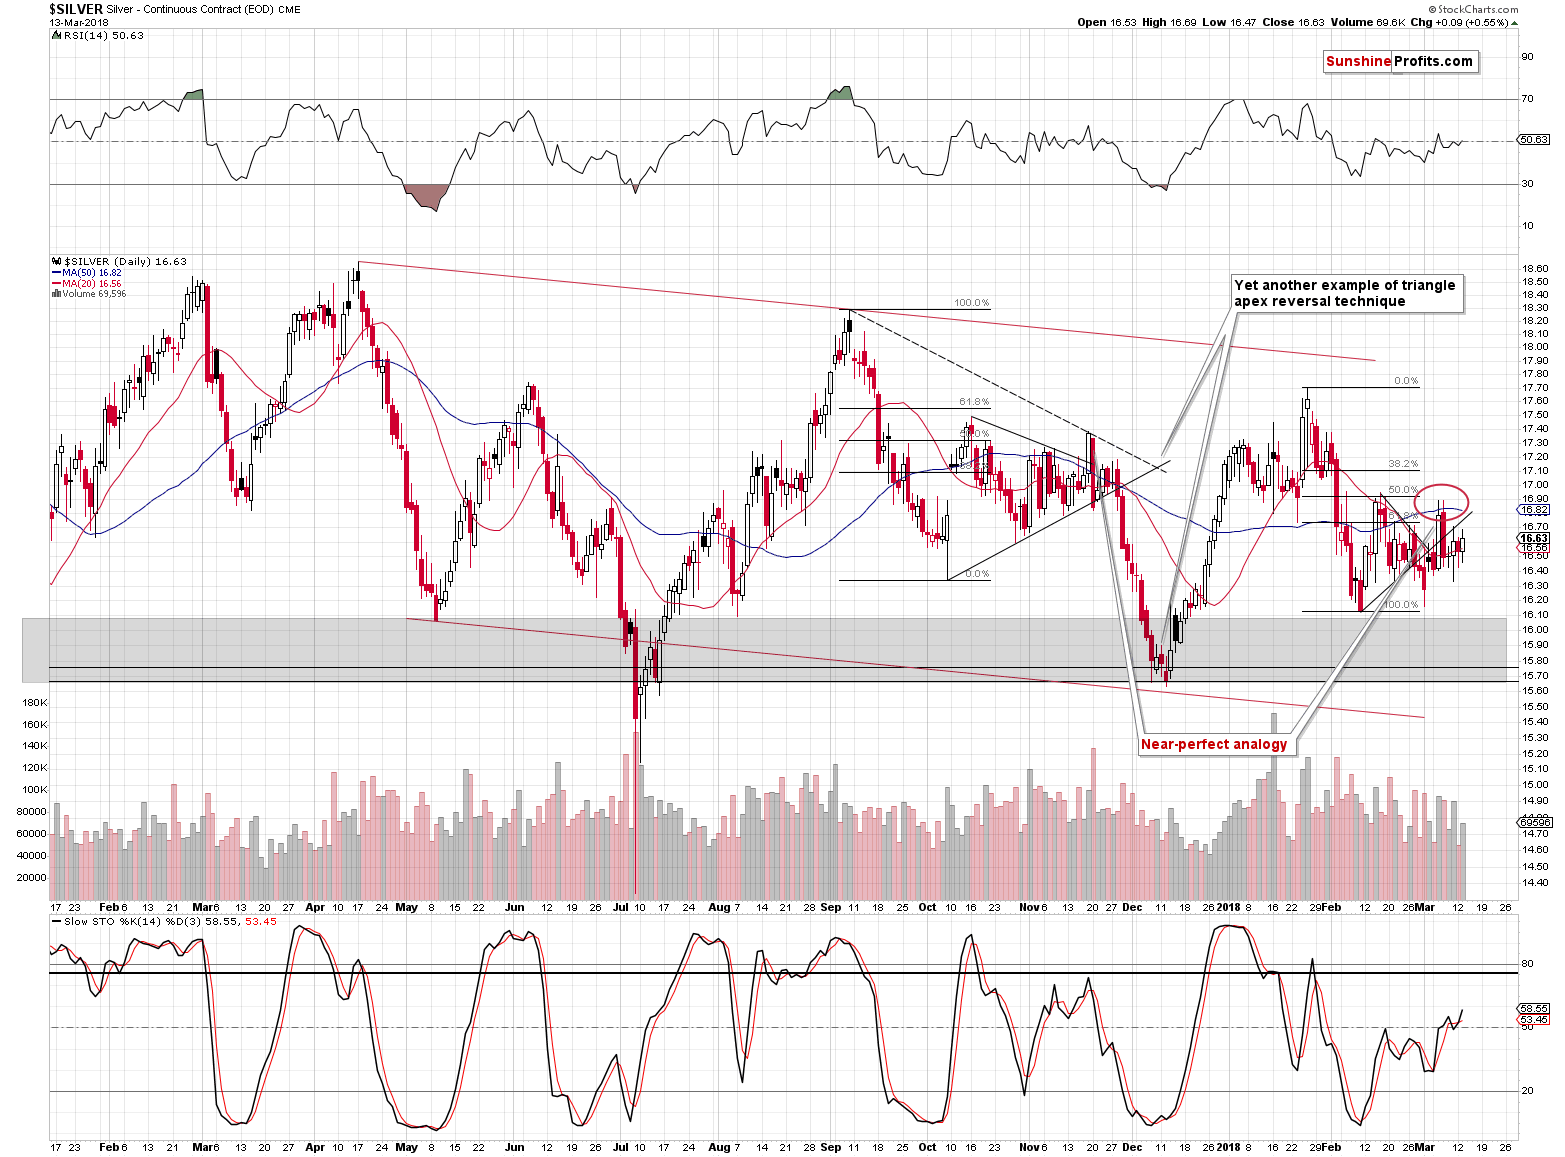
The second analogy can be observed in the silver market. In the past few weeks, the white metal has been performing almost identically as it did after the September 2017 top. The initial decline, the volatile comeback and another move lower, but not below the initial low. Then a sharp daily upswing above the 50-day moving average and almost to the previous high. Then another big move down that erases more than the daily rally. Finally, a few days of quiet upswing. That’s where we are right now and that’s exactly what preceded the $1.5 decline in late 2017.
The implications are clearly bearish.
Gold Stocks’ Breakdown Below 2017 Low
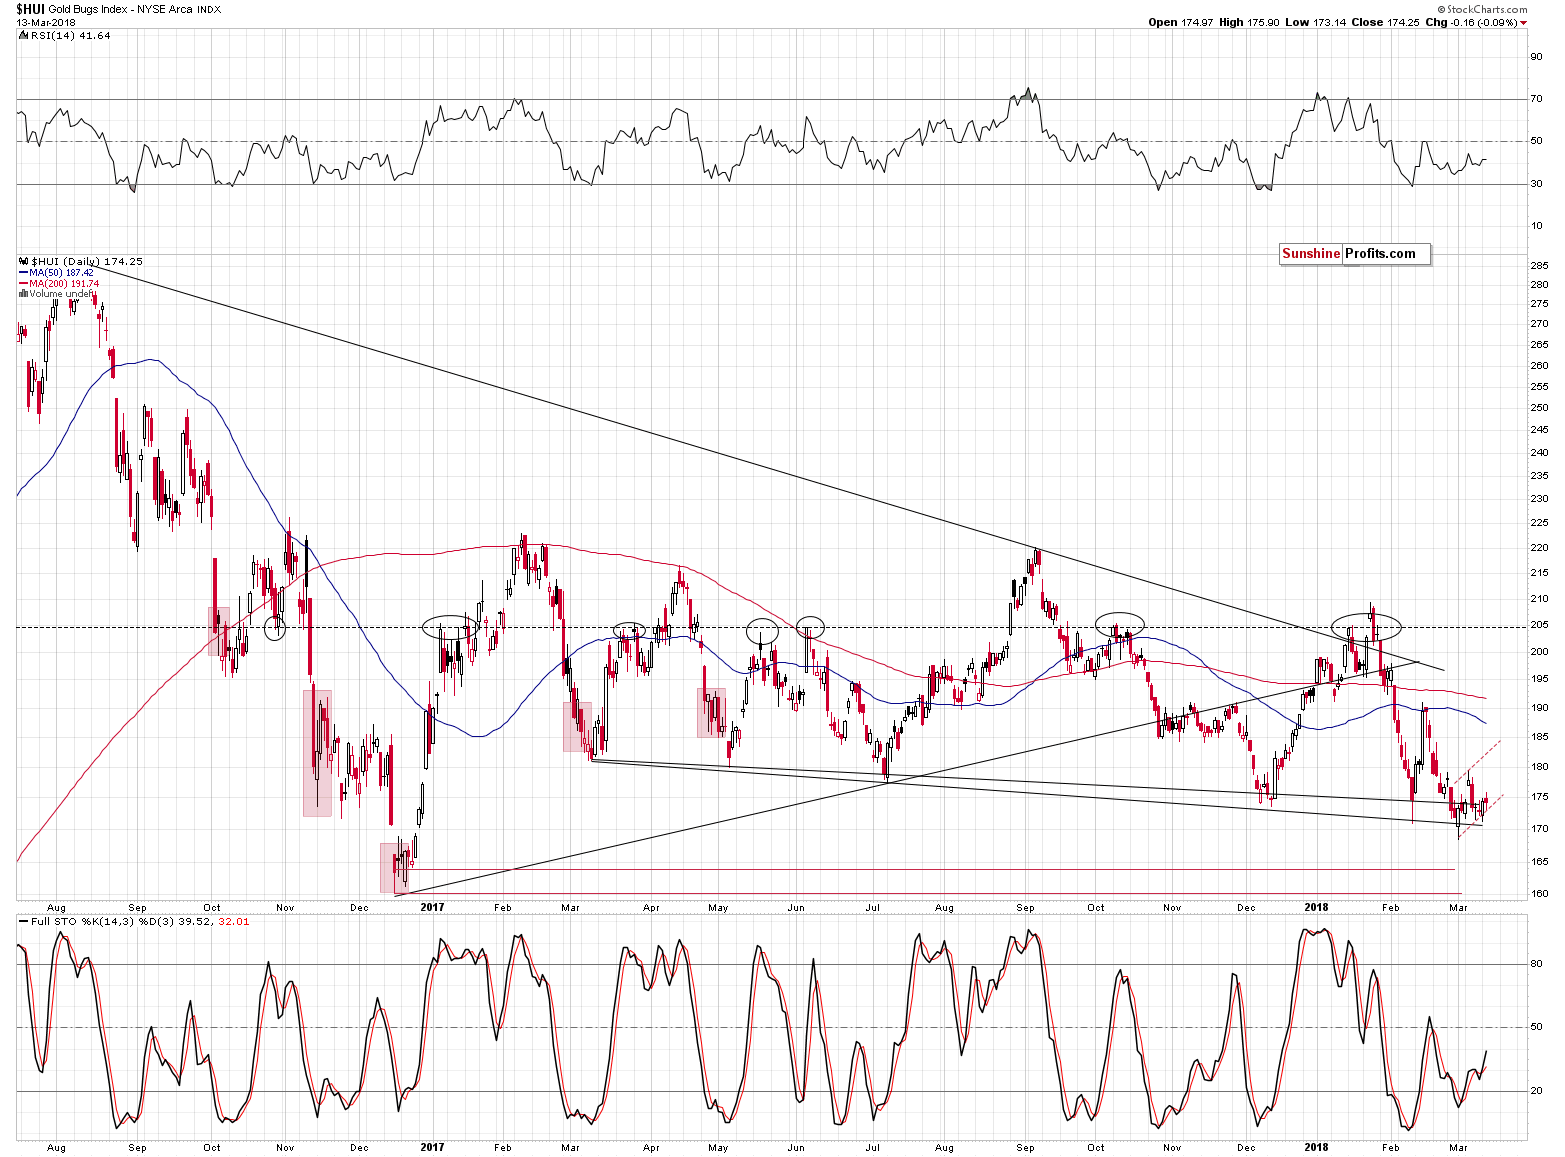
In yesterday’s Gold & Silver Trading Alert, we wrote that based on the analogy present in silver, the one in gold and due to gold’s triangle apex reversal, it seemed that the chance of another upswing was very low. Even if it was seen – we argued – gold miners would be likely to underperform, so a move to a new March 2018 high didn’t seem to be in the cards.
Yesterday’s session more or less confirmed the above. Gold and silver moved a bit higher just as one might have expected them to before a reversal, and silver moved in tune with its self-similar pattern. Gold stocks, however, ended the session slightly lower, underperforming and closing once again below the 2017 low.
It seems that the breakdown below the last year’s low is now more than verified and thus much lower prices are likely to follow.
Sign from Europe
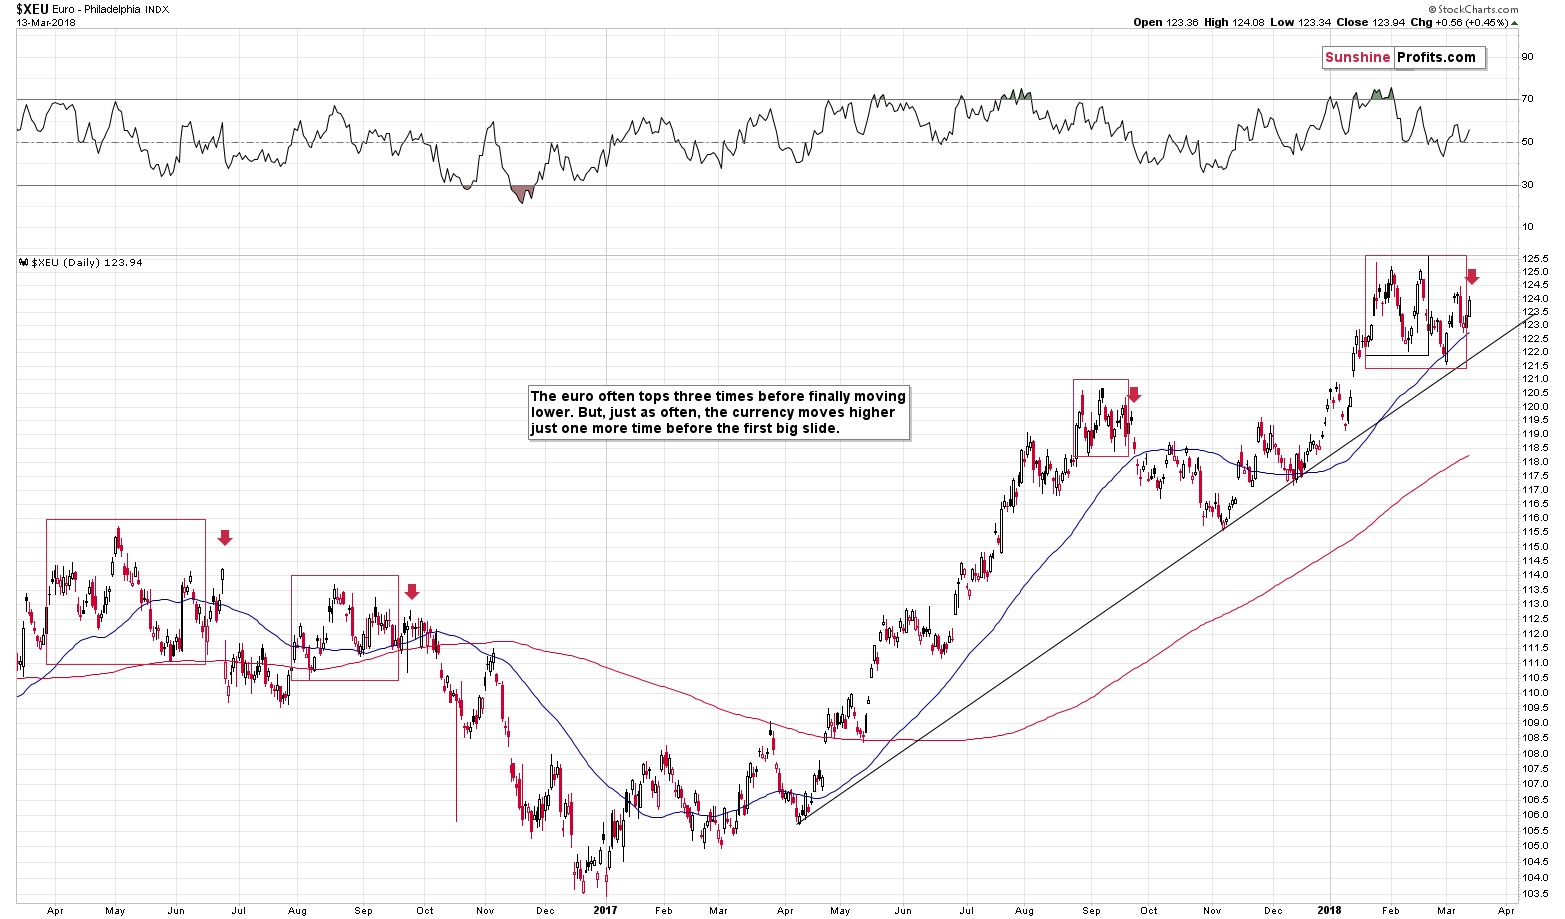
The interesting pattern about the euro is that it quite often ends rallies with triple tops with an extra upswing that sometimes is too temporary to be called another top. We marked those cases with red rectangles and we marked those “extra upswings” with red arrows. The temporary nature of the latter can be seen particularly clearly in September 2017.
On Friday, we wrote that the problem with this analogy and the reason why it didn’t add clarity to the outlook was the January 25th intraday high. Should we count it as one of the major local tops?
Yes, because ultimately a high was indeed reached. No, because in terms of the closing prices, nothing really happened on that day.
Based on the most recent very short-term move higher in the EUR/USD, we know that the second interpretation was most likely the correct one. Namely, the intraday high didn’t really count and that the top we saw earlier this month was the third one. This, in turn, makes yesterday’s rally the “extra upswing” that is seen right before declines. The implications are bearish for the EUR/USD, bullish for the USD Index and bearish for the precious metals market.
Summary
Summing up, a major top in gold, silver and mining stocks is probably in, and based on the way silver and gold stocks performed on Friday and the analogies in gold and – especially - silver, it seems that the big decline is just around the corner. We already saw the key short-term signs: silver’s outperformance and miners’ underperformance last Tuesday, and the fact that they were repeated on Friday makes the bearish outlook even more bearish, especially that our last week’s upside targets for gold and silver were already reached. Consequently, it seems that an extra-large short position is currently justified from the risk to reward point of view, even though it’s still somewhat possible that we will see slightly higher PM prices later today or tomorrow.
As always, we will keep you – our subscribers – informed.
To summarize:
Trading capital (supplementary part of the portfolio; our opinion): Full short positions (200% of the full position) in gold, silver and mining stocks are justified from the risk/reward perspective with the following stop-loss orders and initial target price levels:
- Gold: initial target price: $1,218; stop-loss: $1,382; initial target price for the DGLD ETN: $53.98; stop-loss for the DGLD ETN $37.68
- Silver: initial target price: $14.63; stop-loss: $17.33; initial target price for the DSLV ETN: $33.88; stop-loss for the DSLV ETN $21.48
- Mining stocks (price levels for the GDX ETF): initial target price: $19.22; stop-loss: $23.54; initial target price for the DUST ETF: $39.88; stop-loss for the DUST ETF $21.46
In case one wants to bet on junior mining stocks' prices (we do not suggest doing so – we think senior mining stocks are more predictable in the case of short-term trades – if one wants to do it anyway, we provide the details), here are the stop-loss details and initial target prices:
- GDXJ ETF: initial target price: $27.82; stop-loss: $36.14
- JDST ETF: initial target price: $94.88 stop-loss: $41.86
Long-term capital (core part of the portfolio; our opinion): No positions (in other words: cash)
Insurance capital (core part of the portfolio; our opinion): Full position
Important Details for New Subscribers
Whether you already subscribed or not, we encourage you to find out how to make the most of our alerts and read our replies to the most common alert-and-gold-trading-related-questions.
Please note that the in the trading section we describe the situation for the day that the alert is posted. In other words, it we are writing about a speculative position, it means that it is up-to-date on the day it was posted. We are also featuring the initial target prices, so that you can decide whether keeping a position on a given day is something that is in tune with your approach (some moves are too small for medium-term traders and some might appear too big for day-traders).
Plus, you might want to read why our stop-loss orders are usually relatively far from the current price.
Please note that a full position doesn’t mean using all of the capital for a given trade. You will find details on our thoughts on gold portfolio structuring in the Key Insights section on our website.
As a reminder – “initial target price” means exactly that – an “initial” one, it’s not a price level at which we suggest closing positions. If this becomes the case (like it did in the previous trade) we will refer to these levels as levels of exit orders (exactly as we’ve done previously). Stop-loss levels, however, are naturally not “initial”, but something that, in our opinion, might be entered as an order.
Since it is impossible to synchronize target prices and stop-loss levels for all the ETFs and ETNs with the main markets that we provide these levels for (gold, silver and mining stocks – the GDX ETF), the stop-loss levels and target prices for other ETNs and ETF (among other: UGLD, DGLD, USLV, DSLV, NUGT, DUST, JNUG, JDST) are provided as supplementary, and not as “final”. This means that if a stop-loss or a target level is reached for any of the “additional instruments” (DGLD for instance), but not for the “main instrument” (gold in this case), we will view positions in both gold and DGLD as still open and the stop-loss for DGLD would have to be moved lower. On the other hand, if gold moves to a stop-loss level but DGLD doesn’t, then we will view both positions (in gold and DGLD) as closed. In other words, since it’s not possible to be 100% certain that each related instrument moves to a given level when the underlying instrument does, we can’t provide levels that would be binding. The levels that we do provide are our best estimate of the levels that will correspond to the levels in the underlying assets, but it will be the underlying assets that one will need to focus on regarding the signs pointing to closing a given position or keeping it open. We might adjust the levels in the “additional instruments” without adjusting the levels in the “main instruments”, which will simply mean that we have improved our estimation of these levels, not that we changed our outlook on the markets. We are already working on a tool that would update these levels on a daily basis for the most popular ETFs, ETNs and individual mining stocks.
Our preferred ways to invest in and to trade gold along with the reasoning can be found in the how to buy gold section. Additionally, our preferred ETFs and ETNs can be found in our Gold & Silver ETF Ranking.
As a reminder, Gold & Silver Trading Alerts are posted before or on each trading day (we usually post them before the opening bell, but we don't promise doing that each day). If there's anything urgent, we will send you an additional small alert before posting the main one.
=====
Hand-picked precious-metals-related links:
PRECIOUS-Gold flat amid rising U.S. protectionism fears
Gold has tendency to slip prior to Fed meetings
Maple Leaf marks 30 years at .9999
Anglo says cleaning up mining will earn it billions in profit
=====
In other news:
A Month After Market Mayhem, Here's How Gauges of Stress Look
Rising Yields Won’t Blunt the U.S. Economy’s Momentum—For Now
Gundlach Says 10-Year Treasury Above 3% Would Drive Down Stocks
Hedge Funds Draw SEC Scrutiny in Crypto Coin Review
Google Will Ban Online Ads for Cryptocurrencies and Initial Coin Offerings
=====
Thank you.
Sincerely,
Przemyslaw Radomski, CFA
Founder, Editor-in-chief, Gold & Silver Fund Manager
Gold & Silver Trading Alerts
Forex Trading Alerts
Oil Investment Updates
Oil Trading Alerts

