

Briefly: in our opinion, full (250% of the regular position size) speculative short positions in mining stocks are justified from the risk/reward point of view at the moment of publishing this Alert.
Once again, gold, silver, and mining stocks moved against their main trends yesterday. Gold and silver declined from their yesterday's intraday highs since that time, but many investors and traders are asking themselves, charts, and us, whether the outlook changed. Why did all these moves take place, and how much did they affect the overall outlook?
The reply to the first question is that it was probably a technical rebound - some markets had to take a breather (stocks, for instance) and this changed the shape of the top / decline. Of course, that's in addition to the fact that gold made headlines on Wednesday, with the $3000 BofA prediction being made right in the title. Yes, a single day headline (a major one - like the one we saw this week) can trigger an upswing that lasts for more than one day. Still, none of these are likely to change the prevalent trend, unless we see major - and confirmed - breakouts above key technical levels. Have we seen them? Based on the reply to this question, the outlook has changed or it hasn't.
Let's take a closer look.
USDX in Focus
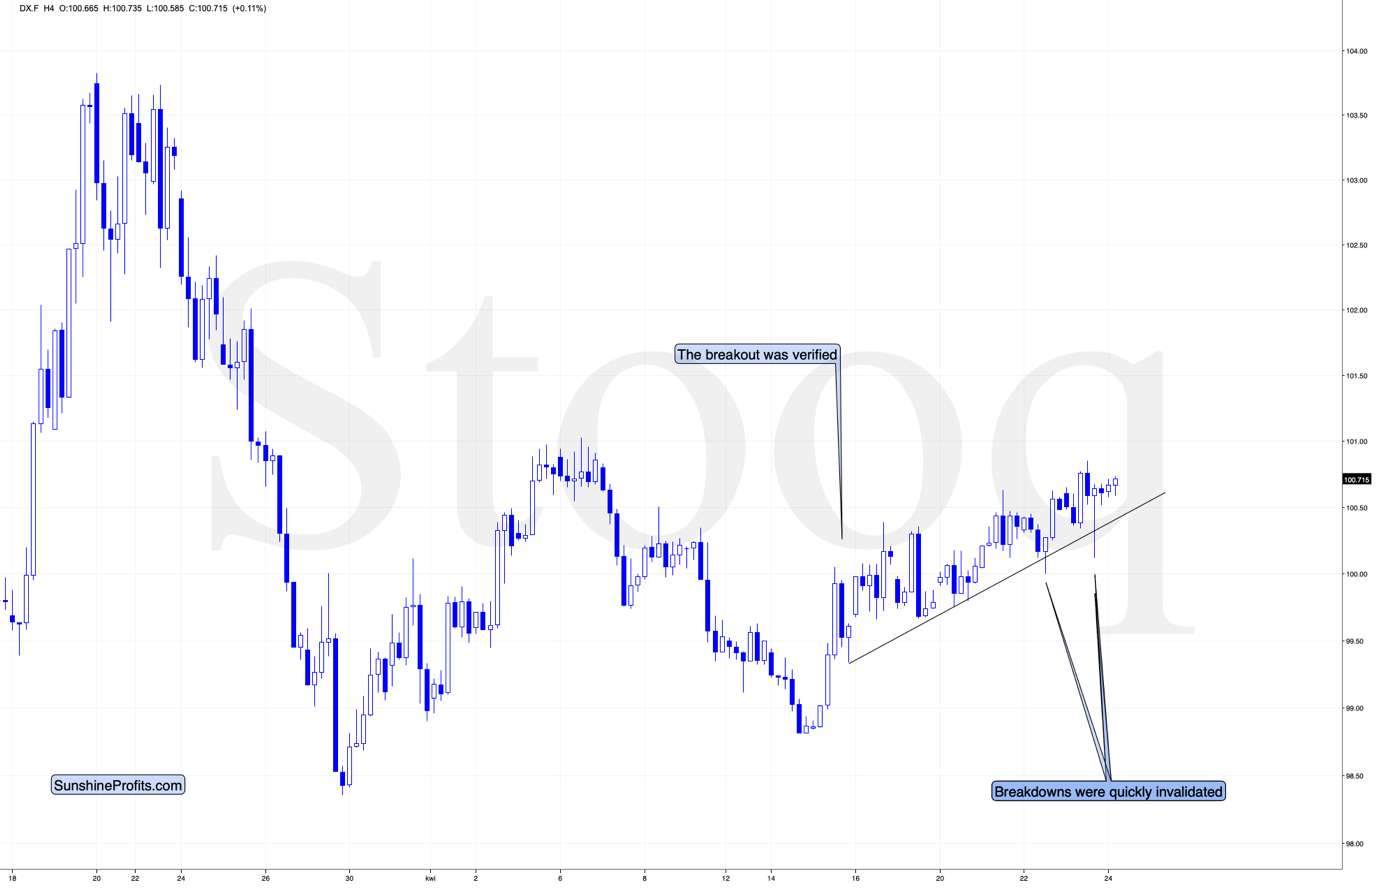
Given the recent lack of volatility that would be similar to what we saw in early March, it appears that the 1 to 1 analogy that we described previously, is no longer intact. But does this make the outlook bearish? No. This analogy was the cherry on the analytical cake of bullish factors, not its foundation. The USD Index has been making higher highs and higher lows, gathering strength for a bigger move.
The nearest resistance on the above chart is provided by the early April highs, so once the USDX takes them out, it's likely to rally faster. After all, there's very little resistance above the April highs all the way up until the late-March highs. That's where we might see another stop or pause in the rally. The current move higher is a bit itself a form of consolidation - a running correction - and these kinds of movements tend to be followed by the sharpest rallies once they are broken to the upside.
Let's dig deeper. There are two key components on the USD Index: the euro and the yen (their exchange rates with the US dollar). Let's take a look at both of them.
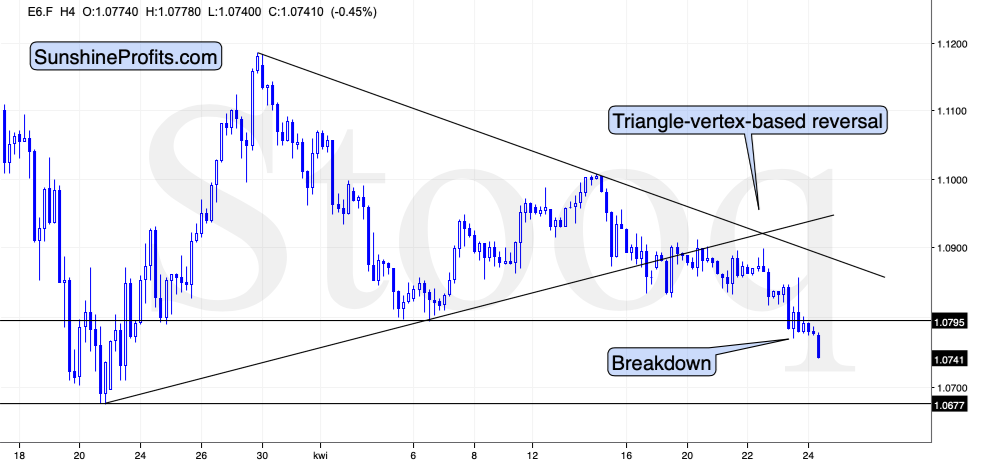
The euro just broke below its mid-April lows, shortly after topping almost exactly at its triangle-vertex-based reversal. The next support is provided by the previous 2020 lows, but we don't think that it will spend a lot of time at this support and instead decline more after a brief pause.
And the Japanese yen?
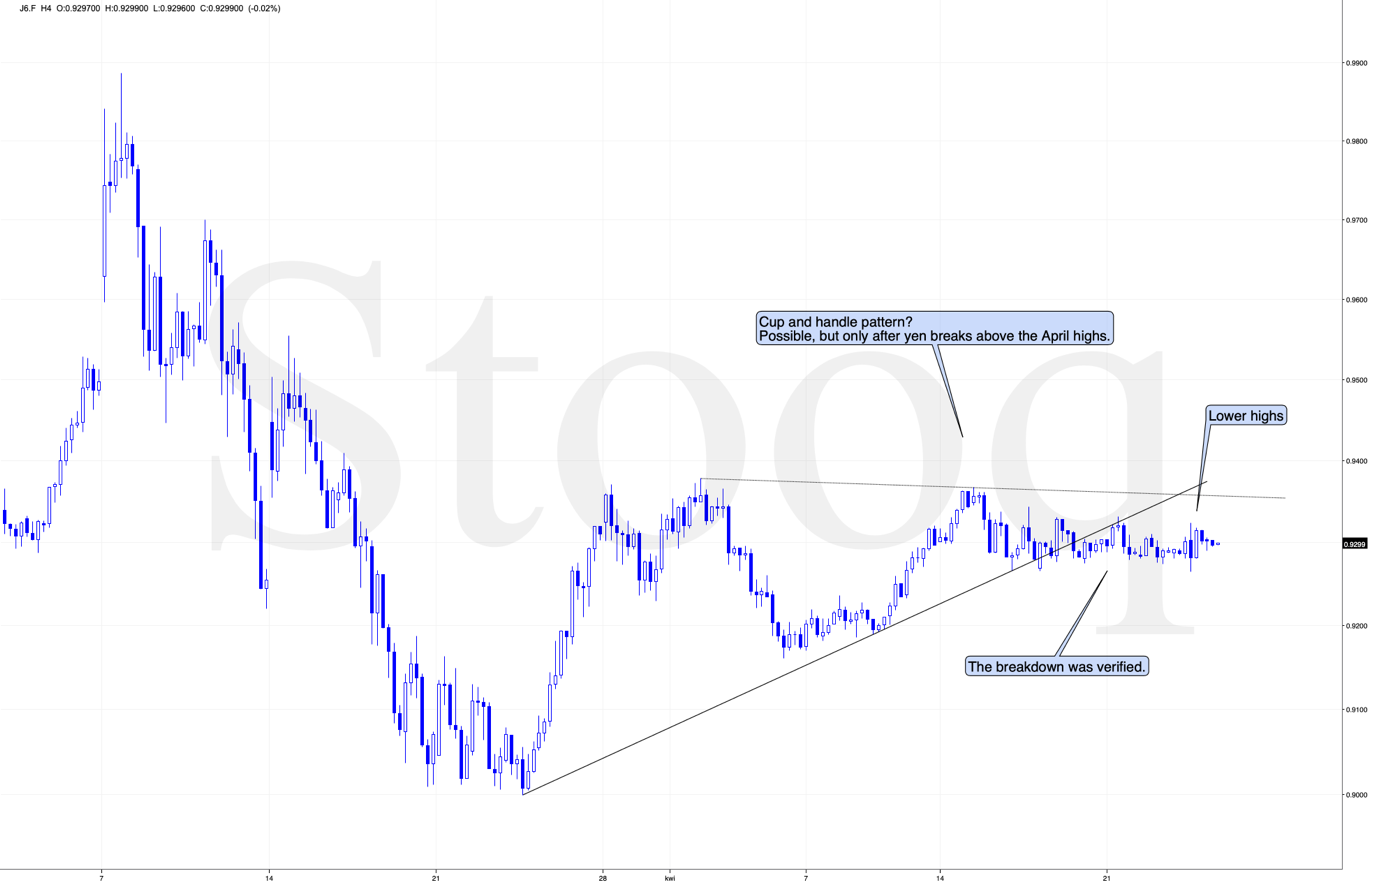
It also broke below its rising support line. After the breakdown's verification, the yen started to move lower in a specific manner. Namely, while it failed to move to new lows during the declines, it continuously formed lower highs, while the volatility declined.
This indicates that the yen is most likely preparing for a bigger move (as the declining volatility hints) and that the move is likely to be to the downside (the breakdown was verified, plus the highs descend at greater pace than the lows ascend).
This means that nothing changed in case of the USD Index and its outlook - it remains bullish - and this is the case not only because of USDX's inverse head and shoulders pattern, but most importantly because of all the factors that we outlined in this week's flagship Gold & Silver Trading Alert.
This means that the bearish implications for the precious metals market remain intact. While the USD Index has been moving higher relatively slowly, we don't expect this to continue for much longer. Once people get more scared, for instance because of prolonged lockdowns or rapid increases in new cases and/or death toll (which would lead to prolonged lockdowns) and/or declining stock markets around the world, the trend is likely to accelerate.
Stock Market Lessons for Gold
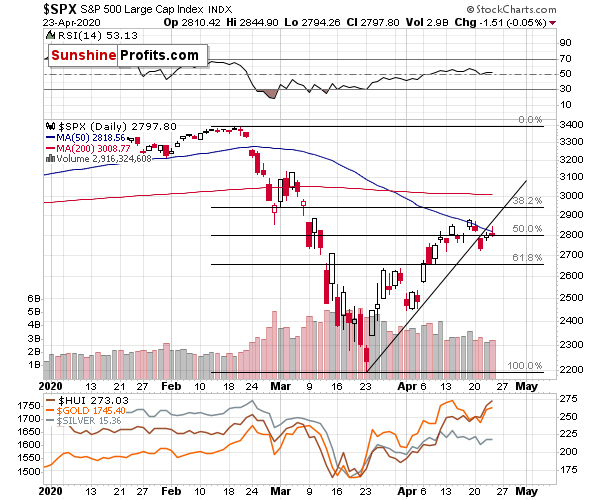
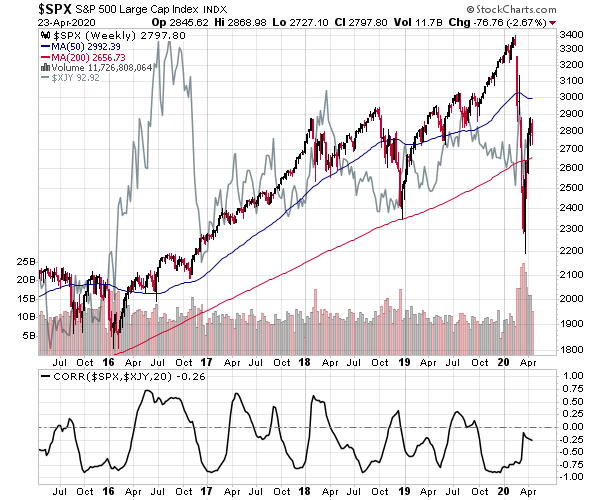
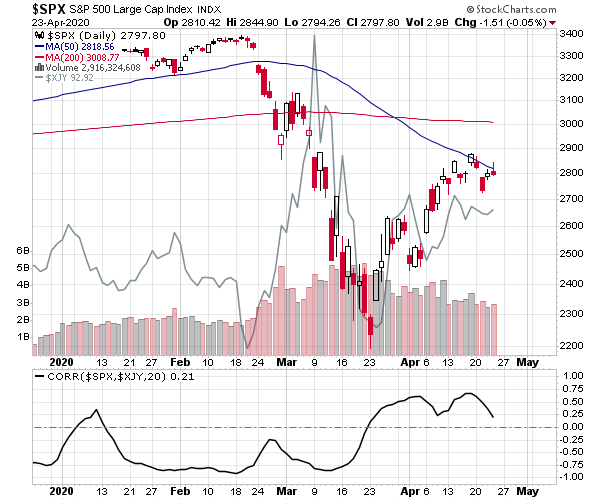
Stocks moved higher yesterday, but only initially. The S&P 500 index erased all daily gains and then declined a bit more before the closing bell. All this happened while the index was trying to close the price gap, move above its rising resistance line, and the 50-day moving average. All these attempts failed, and the reversal has very bearish implications for the following days.
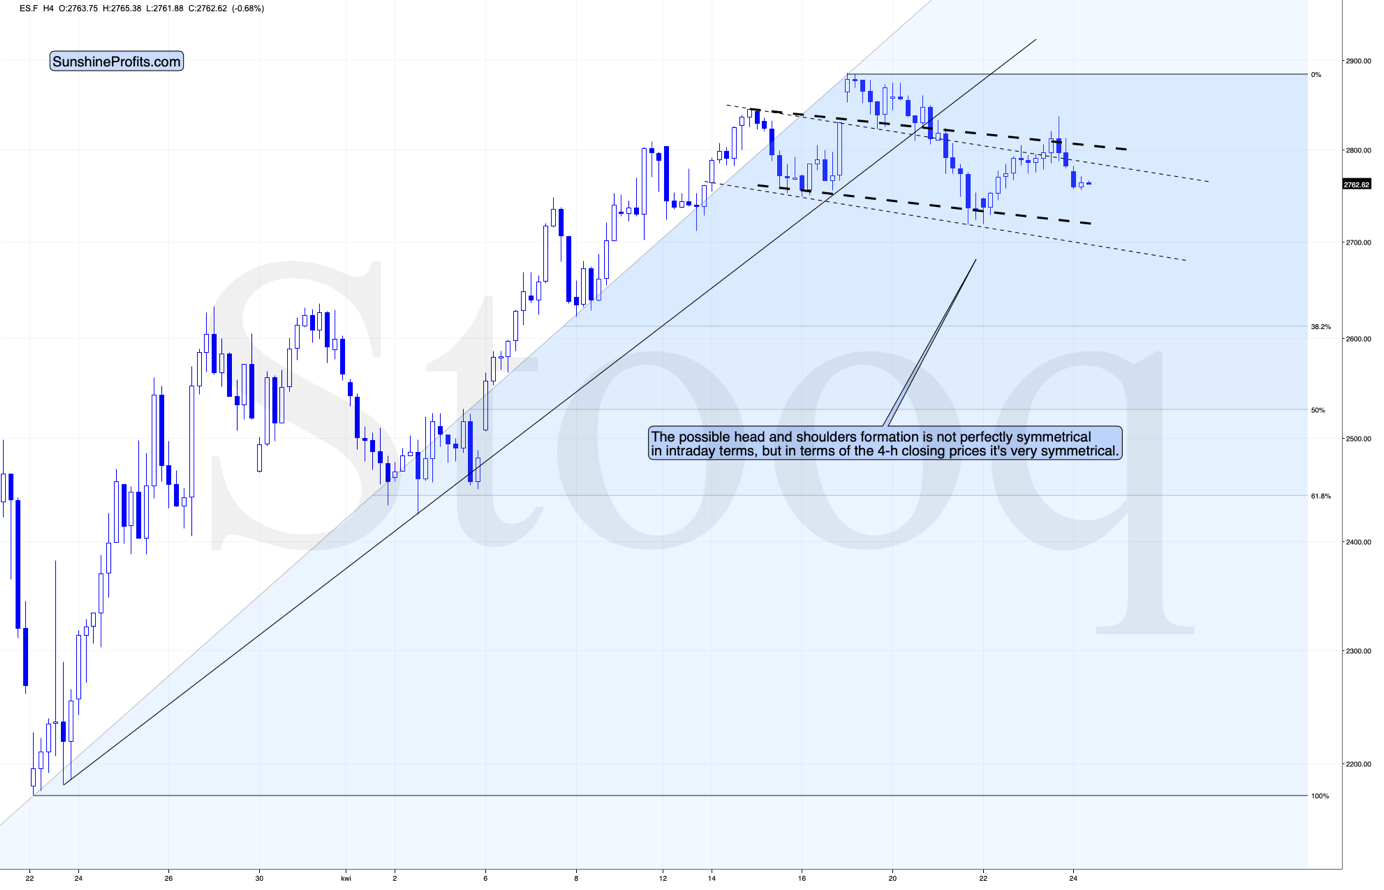
In case of the 4hour chart, we see that yesterday's reversal shaped the right shoulder of what might become the head and shoulders top pattern. The formation is not perfectly symmetrical, in intraday terms (thin, dotted lines), but it's quite symmetrical when we take into account the 4-h closing prices.
Based on the daily reversal, stocks are likely to decline further. This means that they would be likely to complete the H&S pattern and decline even more.
With the bullish outlook for the USD Index, the bearish outlook for the general stock market, and the fact that history tends to repeat itself, we have a good chance for seeing another slide in the precious metals market. After all, rising USDX and declining stocks was what accompanied PMs' and miners' slide in March.
Of course, the precious metals might show exceptional strength here and the outlook might prove to be bullish even without a big slide in the precious metals prices, but... We don't see strong evidence toward that just yet. And no, a daily rally or few days of higher prices is not enough of a proof.
The confirmations, verifications etc. are used for a reason. This reason is that there are multiple forces that aim to pull the market in their direction and sometimes they succeed in doing that for a short while, despite the real trend. This means that acting on the very initial signs could be misleading.
On the other hand, we (well, not just us - everyone) have the risk of being affected by the confirmation bias and myopic loss aversion - meaning ignoring the new information, especially if taking them into account would mean realizing a loss (either materially, or psychologically - the mind hates that in particular and will play many tricks on one, just to avoid it). Why would the myopic loss aversion be a big problem? Because from the financial point of view it's far better to take even five minor (say 1%) losses than just one huge (20%) one. However, that's not how the mind works - it will "understand" the above as five losses vs. one loss and will aim for the latter outcome - which is actually the worse outcome.
One of the ways one can protect themselves against the above biases in the markets is a stop-loss order. It's good for many cases, especially in case of day trading, when one is barely able to take into account anything more than the price itself. However, the more one zooms out to the long term, and the more non-direct-price factors are taken into account (and the more important they are), the less useful a stop-loss becomes.
If you bought a house with the aim to collecting rent payments and creating a semi-passive income, would you decide (upfront) on selling that house as soon as its value dropped by 5% below the purchase price? Or 10%? The odds are, you wouldn't, because the decision was made based on many other factors than just the price itself.
That's similar to our current outlook and trading positions. We are taking myriads of factors into account, not just the price of gold or the price of silver, or the prices of mining stocks. We're looking at their inter-market relationships, we're looking at how they perform combined with how they performed during situations that were most similar to what we see right now (2008), and we check how they react to details that should make them move in one way or another (USDX, general stock market).
The outlook is not determined by just the price of gold itself - it's determined by many of the above. If this is the case, why should a certain price by itself change the outlook? That's why in case of this trade, we don't have stop-loss levels in place. We could set it (say to $2,100 in gold), but it would be so ridiculously high that it would be useless. Actually, it would be counter-productive, because it gives the false impression that we would actually wait until gold moved that high to change the outlook, whereas the point is that it is not the price itself that we will be looking at, at least not only at it. If gold declined or rallied by $1, while the USD Index soared by 4 index points, our outlook would change immediately. Not because of the price, but because of the relative strength. If silver declined to $8, while gold moved just $50 lower, we would probably change the outlook as well as it would imply a major target being (almost) reached while gold was showing strength.
We moved to always providing the stop-loss orders against our approach (described above) as it was requested by our subscribers. And it turned out that our profitability was much better when our approach toward exiting trades matched our approach to the market in general. It was requested, as most trading strategies are based only on the price and as such, price would be something that invalidates a given outlook. In our case, it's not like that, as our approach is more sophisticated. That's why we will use the stop-loss orders when breaking them would really invalidate the outlook and when it's close enough to be useful instead of being misleading. At this time, it would be misleading, not helpful. Of course, one is free to use these techniques in their trades, especially if one combines our research with some other techniques.
For now, the USD Index is likely to rally, and the stock market is likely to decline. The way gold, silver, and mining stocks respond to the decisive moves in these markets will tell us a lot about the outlook. If PMs and miners' respond in a bullish way (by not declining significantly, or even rallying), the outlook might become bullish. If PMs and miners' respond like they responded in March, or similarly, it will be clear that the outlook has been bearish all along.
For now, the technical signs don't point to strength in the precious metals sector that would be decisive enough to tell us that the situation is bullish, and at the same time we see signs that point to a high probability of situation in which the PMs and miners will have the chance to either plunge, or show their strength by declining just a little. In both cases, exiting short positions now, seems pre-mature.
Having said that, let's take a look at gold.
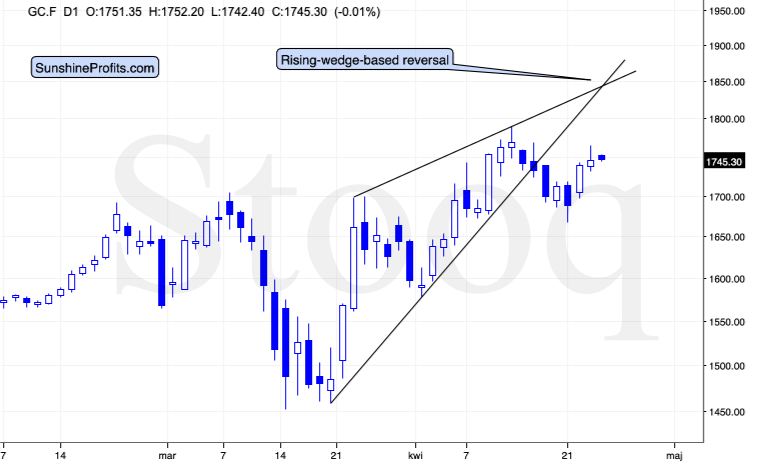
Looking at gold's daily price changes, we see that it formed a daily reversal very close to the day when the lines creating the rising wedge cross. Such vertexes often pinpoint reversal dates, either precisely or approximately. It could be the case that the current top in gold is already in.
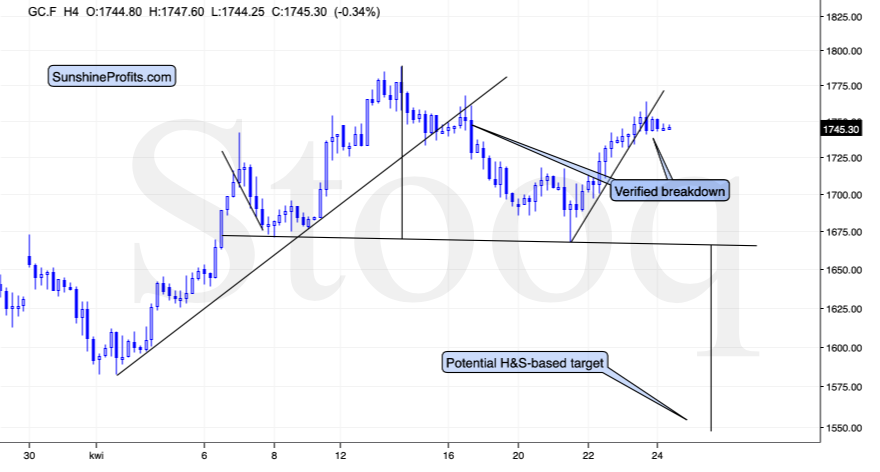
Looking at the 4-hour chart, we see something similar. The right shoulder of the potential H&S formation is being formed, just like what we see in case of stocks. Gold is a little behind in case of forming it, but given the breakdown below the very short-term support line, it seems that it can decline shortly and catch up.
Will this decline happen today? Quite likely some of it will. But the biggest part of the decline is likely going to take place within the next few weeks.
What about silver?
Silver's Rally and Its Implications
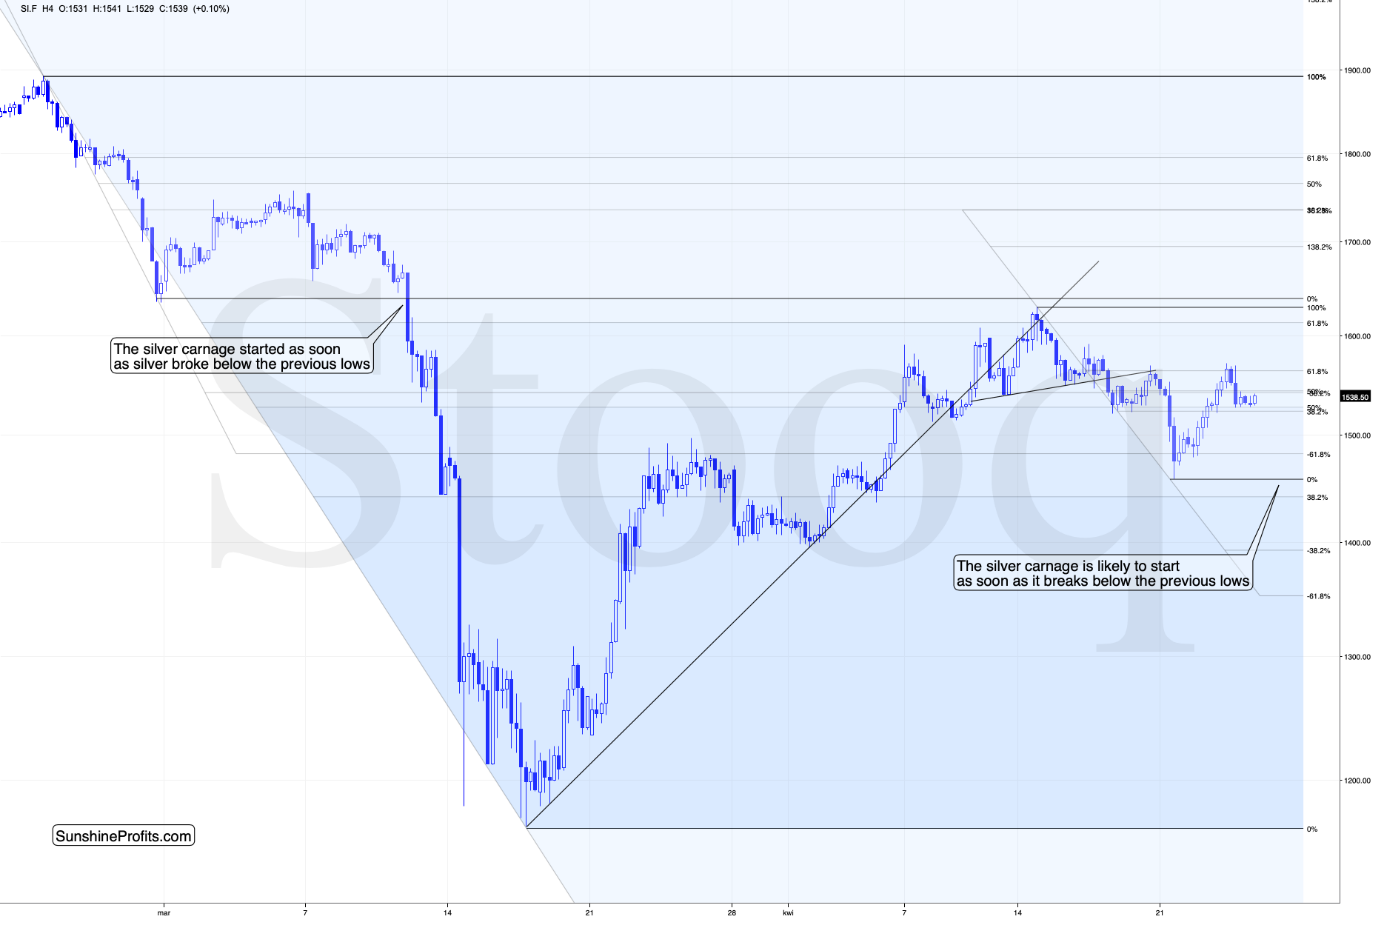
Silver rallied quite profoundly recently, moved lower and it then rallied back up. Still, it didn't invalidate its previous head and shoulders top, nor did it manage to confirm the breakout above the most recent short-term high.
Back in early March, silver corrected almost 50% of the preceding downswing before topping. Right now, it corrected a bit above 61.8%. That's a slightly more than in the previous case, but given the sharp move back below the 50% retracement, it seems that the two cases remain similar.
Just as silver topped back then, it seems to have topped yesterday.
Consequently, silver's performance doesn't indicate a change in the trend or the analogy to 2008 that we elaborated on Monday - it's outlook remains bearish.
Finally, let's take a look at the senior and junior mining stocks.
Miners in the Spotlight
The proxy for seniors - GDX - managed to close at new yearly highs yesterday, which definitely caught the eye of many market participants.
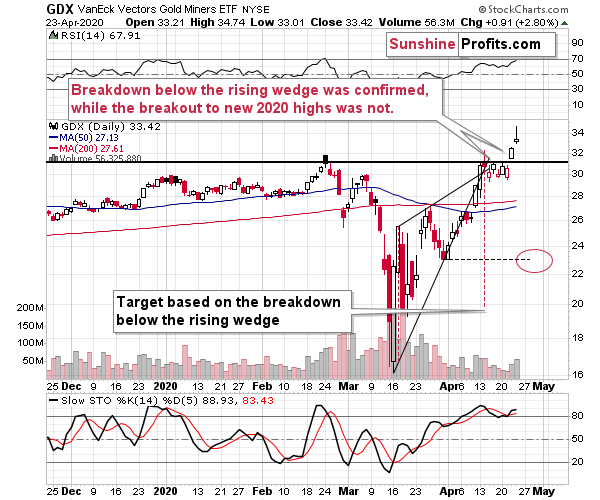
Something major seems to have happened. But did something major really change? The breakout is not confirmed yet (two daily closes, not three), and the situation in all the other markets that we featured so far today suggests that it won't be confirmed, or that it will be invalidated shortly. The same goes for yesterday's reversal candlestick, which formed at relatively big volume. Especially since there was no analogous breakout in junior miners.
After rallying early during yesterday's session, juniors declined during the day. They closed above $40, which seems like a game-changer, but please note that the juniors ended the March 6th session very close. And they bottomed below $20 just a week later.
It seems that quoting our Wednesday's comments would be useful today:
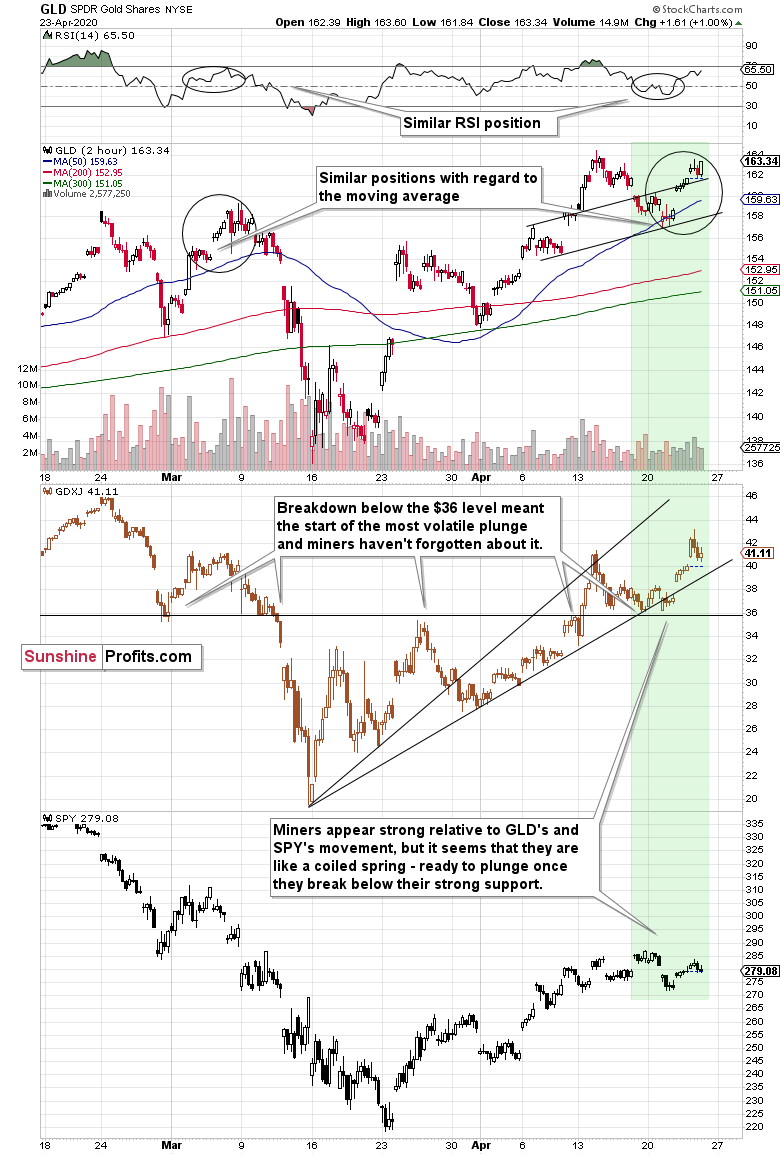
We zoomed in to the 2-hour chart to show you something specific that happened in the last few days and to provide the likely explanation for it.
Namely, the miners started to show odd strength relative to both: GLD and SPY, and we marked it with a green rectangle.
The relative strength started in the final part of the previous week, when the GDXJ approached the $36 level. Instead of falling further, just like GLD did - or at least like the SPY did on Tuesday - the GDXJ stayed above it.
The gold trading tip for today would be always question such situations before taking them at face value. Why would that be the case? What factor could have been strong enough to trigger such strength? Or maybe - in the absence of such a factor - was the mining stock sector really strong enough to withstand the powerful bearish forces in the form of declining GLD and SPY?
There is a good reason for the miners' "strength". It's the $36 price level itself. Or, more precisely, the strong support that it provides.
This is the price level from which junior miners rallied in early March.
This is the price level at which juniors reversed on an intraday basis on March 9th.
This is the price level that stopped the decline on March 10th.
And this is the price level that - once broken on March 11th - triggered waterfall selling that quickly took the GDXJ below $20.
This is also the levels that stopped the late-March rally, and the level that initially served as resistance on April 9th.
It also served as support after the initial - April 15th - decline.
Given that this price level worked as both: support and resistance so many times, is it really surprising that without a major breakdown back below the previous 2020 highs in the GLD ETF, this level is holding strong?
It's absolutely normal. Let's not overestimate this support's importance, though. This level doesn't invalidate the bearish gold price forecast, it only changes its shape a bit. Instead of declining just like GLD, the GDXJ is taking a breather above $36, but once GLD moves decisively lower, the GDXJ would be likely to break below this level, and slide profoundly - catching up with the pace of the slide.
As gold and stocks move lower, both: senior and junior miners are likely to slide. If they don't decline profoundly, we'll get a good indication that they are about to rally much further, and we can position ourselves for this move. For now, the bearish outlook remains intact.
Finally, before summarizing, we would like to reply to questions that we received recently.
From the Readers' Mailbag
Q: DUST options.
With the repricing of the DUST shares, will the options on DUST be revalued along with the DUST shares? As of today it looks like they have not been.
What typically happens in this instance?
A: What typically happens after a reverse-split is that some kind of adjustments are made so that the economic sense of the trade that one was in, remains intact. After all, splits or reverse splits shouldn't change anything from the material point of view.
To get the detailed information, you can check The OCC (The Options Clearing Corporation) website - the "Information Memos" section. Over there we can find the report from April 14. It says that - effective April 23rd - each option will no longer be for 100 shares of DUST, but rather for 4 shares thereof. And since after the reverse split, each DUST share is worth as much as 25 pre-reverse-split shares, the option is for pretty much the same thing. That's why it's value doesn't change based on the reverse split alone.
Q: Question for you on the PM-sector leveraged ETFs (NUGT and DUST in particular). During the mid-March volatility, the ETFs seemed to have an exceedingly difficult time living up to their mandate. They rarely matched 3x of the daily price movement of their underlying securities. Hopefully with the move to being 2x instead of 3x this will be improved, but can you shed any light on this? Was it volatility related? And when the downside picks up, do we expect this behavior again?
A: It's true that the 3x leverage was sometimes limited during the day, for instance to 260%. It seems that it was due to the very rapid loss in the value of the long ETFs (NUGT and JNUG) and people complaining on the extreme losses they endured at that time (the mechanics of these ETFs are not clear to people in general - they magnify daily price moves, not the entire price move in total, and this is particularly detrimental during declines). Ultimately, the leverage was decreased from 3x to 2x. While we can't guarantee it, we don't think that it would be limited below 200% in the future, as this leverage isn't as extreme as the 3x was. By limiting the leverage below 2x, the provider of these products (Direxion) would risk people not willing to choose these products at all.
Q: Yesterday's upswing is continuing today and big time....also, usually on a friday gold goes up due to the fact that people are afraid of some event occurring over the weekend...
hence, this rally may extend quite a bit into early next week!
are you still of the opinion that we will experience a significant downturn soon?
A: This might be the case, but... Doesn't have to be. People might actually expect something bearish to happen over the weekend. Let's see what the data suggests.
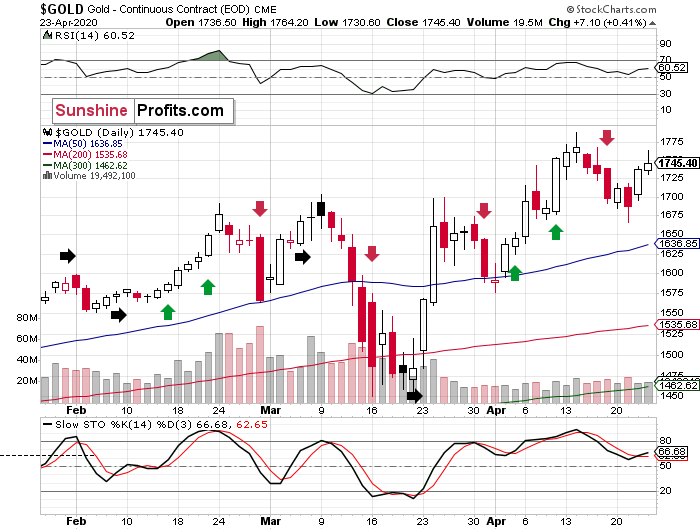
The green arrows show days when we saw a decent upswing on Friday.
The red arrows show days when we saw a decent downswing on Friday.
The black arrows show days when we saw relatively insignificant price moves on Friday.
Starting in late January, we saw exactly 4 cases of each. Consequently, it doesn't seem that we should expect any kind of daily performance based on today being Friday alone.
Consequently, it seems better to pay attention to other factors - and in our view, they continue to favor the bearish outlook for the next few weeks.
Q1: Your report on 23 April states that Yen might break down to lower side. Isn't yen and stock markets inversely related. If yen drops markets will go higher??
If markets go higher would Miners still drop?
A1: The correlation between the stock market and they yen is not stable.
In the long term, there were times when both soared - for instance in the first half of 2016 - and there were cases when the moved in the opposite directions - for instance the final part of 2016. The correlation coefficient moves back and forth showing that at times both are positively correlated, and at times that they are negatively correlated.
The situation is not different in the short term. During the February - March decline, the yen first rallied, and then plunged along with the US stock market. Both then rebounded together. Miners are likely to decline along with the general stock market, and we're more convinced about general stock market's decline than we are about yen's movement.
Q2: Everyone is saying gold will go much higher but your daily reports have a contrast view. So I am confused.
A2: Well, they say that when everyone is on one side of the boat, it doesn't usually work. This could be the case this time. When everyone is convinced that something is going to happen, it means that everyone has already bought or sold. And this means that we are seeing a top or bottom, depending on the sentiment being extremely bullish or bearish.
Of course, we can be wrong here, and everyone else could be correct. Making forecasts for any market is not a position in which one can be correct each and every time. We made money on the huge February - March decline, and also on the March rebound. Even if we have to move to the bullish camp as the outlook changes, this will still mean that we created much more value this year to our subscribers than almost anyone else (we haven't heard of anyone else, who would exit short positions at huge profits and then enter long positions right at the March bottom).
Q: I looks like the dollar rally has begun, but the PMs arent moving lower. Could it be that:
Quote: "At some point, it would change as gold would refuse to decline despite rallying USD"
that the decoupling has already begun, and the PMs will start rally now?
A: Yes, it could be the case, and that's the thing that we're watching most closely right now. When writing the above, we were expecting a much more decisive move higher in the USD Index, than what we see right now. In case of the steady move up, gold was able to rally based on the headlines that it just made - and it's a relatively normal phenomenon. If it rallied without the headlines, it would be an indication that perhaps the trend has indeed reversed.
Since the USD Index is likely to move higher and stocks are likely to move lower, we'll likely to see either the confirmation of the strength (and we could be able to move from short positions to long ones at lower prices anyway), or we could see the big slide that we've been writing about. In both cases, PMs are likely to move lower, and based on how low they move given the kind of moves in the USDX and stocks, the outlook might become bullish either sooner, or later.
Naturally, we'll keep you - our subscribers - informed.
Summary
Summing up, the outlook for the precious metals market remains bearish for the next few weeks despite the very short-term upswing that we saw this week.
The USD Index is likely to move higher and stocks are likely to move lower shortly (not necessarily right away, even though there's a good possibility that it will be the case), and we'll likely see either the confirmation of the PMs' strength (and we could be able to move from short positions to long ones at lower prices anyway), or we could see the big slide that we've been writing about. In both cases, PMs are likely to move lower, and based on how low they move given the kind of moves in the USDX and stocks, the outlook might become bullish either sooner, or later.
For now, the strongly bearish outlook remains intact.
Most importantly - stay healthy and safe. We're making a lot of money on these price moves (and we'll likely make much more in the following weeks and months), but you have to be healthy to really enjoy the results.
By the way, we recently opened a possibility to extend one's subscription for a year with a 10% discount in the yearly subscription fee (the profits that you took have probably covered decades of subscription fees...). It also applies to our All-Inclusive Package (if you didn't know - we just made huge gains shorting crude oil and are also making money on both the decline and temporary rebound in stocks). The boring time in the PMs is over and the time to pay close attention to the market is here - it might be a good idea to secure more access while saving 10% at the same time.
Important: If your subscription got renewed recently, but you'd like to secure more access at a discount - please let us know, we'll make sure that the discount applies right away, while it's still active. Moreover, please note that you can secure more access than a year - if you secured a yearly access, and add more years to your subscription, each following year will be rewarded with an additional 10% discount (20% discount total). We would apply this discount manually - please contact us for details.
Secure more access at a discount.
As always, we'll keep you - our subscribers - informed.
To summarize:
Trading capital (supplementary part of the portfolio; our opinion): Full speculative short positions (250% of the full position) in mining stocks is justified from the risk to reward point of view with the following binding exit profit-take price levels:
Senior mining stocks (price levels for the GDX ETF): binding profit-take exit price: $10.32; stop-loss: none (the volatility is too big to justify a SL order in case of this particular trade); binding profit-take level for the DUST ETF: $231.75; stop-loss for the DUST ETF: none (the volatility is too big to justify a SL order in case of this particular trade)
Junior mining stocks (price levels for the GDXJ ETF): binding profit-take exit price: $9.57; stop-loss: none (the volatility is too big to justify a SL order in case of this particular trade); binding profit-take level for the JDST ETF: $284.25; stop-loss for the JDST ETF: none (the volatility is too big to justify a SL order in case of this particular trade)
For-your-information targets (our opinion; we continue to think that mining stocks are the preferred way of taking advantage of the upcoming price move, but if for whatever reason one wants / has to use silver or gold for this trade, we are providing the details anyway. In our view, silver has greater potential than gold does):
Silver futures downside profit-take exit price: $8.58 (the downside potential for silver is significant, but likely not as big as the one in the mining stocks)
Gold futures downside profit-take exit price: $1,382 (the target for gold is least clear; it might drop to even $1,170 or so; the downside potential for gold is significant, but likely not as big as the one in the mining stocks or silver)
Long-term capital (core part of the portfolio; our opinion): No positions (in other words: cash)
Insurance capital (core part of the portfolio; our opinion): Full position
Whether you already subscribed or not, we encourage you to find out how to make the most of our alerts and read our replies to the most common alert-and-gold-trading-related-questions.
Please note that the in the trading section we describe the situation for the day that the alert is posted. In other words, it we are writing about a speculative position, it means that it is up-to-date on the day it was posted. We are also featuring the initial target prices, so that you can decide whether keeping a position on a given day is something that is in tune with your approach (some moves are too small for medium-term traders and some might appear too big for day-traders).
Plus, you might want to read why our stop-loss orders are usually relatively far from the current price.
Please note that a full position doesn't mean using all of the capital for a given trade. You will find details on our thoughts on gold portfolio structuring in the Key Insights section on our website.
As a reminder - "initial target price" means exactly that - an "initial" one, it's not a price level at which we suggest closing positions. If this becomes the case (like it did in the previous trade) we will refer to these levels as levels of exit orders (exactly as we've done previously). Stop-loss levels, however, are naturally not "initial", but something that, in our opinion, might be entered as an order.
Since it is impossible to synchronize target prices and stop-loss levels for all the ETFs and ETNs with the main markets that we provide these levels for (gold, silver and mining stocks - the GDX ETF), the stop-loss levels and target prices for other ETNs and ETF (among other: UGLD, DGLD, USLV, DSLV, NUGT, DUST, JNUG, JDST) are provided as supplementary, and not as "final". This means that if a stop-loss or a target level is reached for any of the "additional instruments" (DGLD for instance), but not for the "main instrument" (gold in this case), we will view positions in both gold and DGLD as still open and the stop-loss for DGLD would have to be moved lower. On the other hand, if gold moves to a stop-loss level but DGLD doesn't, then we will view both positions (in gold and DGLD) as closed. In other words, since it's not possible to be 100% certain that each related instrument moves to a given level when the underlying instrument does, we can't provide levels that would be binding. The levels that we do provide are our best estimate of the levels that will correspond to the levels in the underlying assets, but it will be the underlying assets that one will need to focus on regarding the signs pointing to closing a given position or keeping it open. We might adjust the levels in the "additional instruments" without adjusting the levels in the "main instruments", which will simply mean that we have improved our estimation of these levels, not that we changed our outlook on the markets. We are already working on a tool that would update these levels on a daily basis for the most popular ETFs, ETNs and individual mining stocks.
Our preferred ways to invest in and to trade gold along with the reasoning can be found in the how to buy gold section. Additionally, our preferred ETFs and ETNs can be found in our Gold & Silver ETF Ranking.
As a reminder, Gold & Silver Trading Alerts are posted before or on each trading day (we usually post them before the opening bell, but we don't promise doing that each day). If there's anything urgent, we will send you an additional small alert before posting the main one.
Thank you.
Sincerely,
Przemyslaw Radomski, CFA
Editor-in-chief, Gold & Silver Fund Manager

