

Briefly: in our opinion, full speculative long positions (150% of the regular position size) in mining stocks are justified from the risk/reward point of view at the moment of publishing this Alert. In our view, no positions in gold or silver are currently justified from the risk to reward point of view. We expect to change our position soon (very likely this week).
In yesterday's Gold & Silver Trading Alert, we focused on mining stocks and we elaborated on the logic behind their target prices. Shortly after that, miners proved to be even stronger on a short-term basis than we had expected them to be, and we sent out two intraday follow-ups. In short, the points made yesterday, as well as those made in the extensive Monday's issue, remain up-to-date. The most important short-term factor seems to be the fact that the stock market hasn't corrected in a visible manner yet, and since it's losing its downward momentum, a corrective upswing seems to be just around the corner.
In today's issue, we'll focus on silver. Let's start with a few questions that we received recently and let's reply publicly for the benefit of all.
From the Readers' Mailbag
Q: There have been statements circulating, mostly from those promoting physical precious metals, such as KITCO, etc., a lot more in the last days and weeks than usually, that the physical silver prices are at a great premium to the paper (futures) prices, such as $1.50- 2.00 above spot prices. They are claiming there is a serious present shortage. However, my investment advisor tells me that there is, in fact, currently a significant glut of physical silver.
A: That's more or less... Normal. The prices on the futures market change fast, and the physical side takes some time to adjust. Sellers view the moves in futures as very brief, and hoping that prices will move back up, they don't want to sell their inventory at what they view as prices that are ridiculous and temporary. But as the time passes, the prices on the physical market adjust. The same thing happened in 2013 when silver was declining substantially. The physical market lagged, and people were claiming that the physical market remains strong and that it's all temporary, manipulative etc. Silver didn't shoot back up then because of these claims, and it's unlikely to soar back up for this reason right now.
The emphasis goes on "for this reason", as we expect silver to move higher in the very short term, and verify the breakdown by moving back up to the 2015 lows, before sliding further. The reasons are emotional (technical) - no market moves in the same direction indefinitely.
Q: Please comment on the quote below:
But it's the supply side that has changed the market. No matter what the idiot permabull silverbugs may claim, there is an glut of silver and the physical oversupply is from the big base metals miners, e.g those with massive skarn or porphyry copper deposits in the Andes who suddenly started paying attention to their rather minor by-product credit a few years ago when the streamer companies offered serious money for something they'd taken for granted until then. "
A: First of all, we want to say that we think that silver will soar exceptionally in the following years. Not before sliding even more before, though. I - PR - like to think of myself as silver's fan, but not a fanatic. I was one of the very few people that refused to view the gold to silver ratio at about 80 as something bullish.
The supply of silver is indeed relatively inelastic as it is mostly mined as a by-product. This is one of the reasons that makes silver so volatile. If it declines, the supply cannot be quickly limited to balance the price. If it soars, the supply cannot be quickly increased to balance the price. It's a double-edged sword that currently makes the declines so significant, but also one that is likely to make silver soar particularly sharply in the final part of the next long-term upleg.
Q: I have been told that extreme lows in the Silver:Gold ratio (as is currently) has in the past led to significant rallies.
A: In other words, extreme highs in the gold to silver ratio (as is currently) has in the past led to significant rallies (in gold and silver).
And that's true. The gold to silver ratio has been in a long-term horizontal trend for decades moving between 100 and 15. When a given resistance level in a trend (horizontal trend is still a trend) is being reached, it's likely that the price or ratio (whatever was in the trend) is going to reverse.
But it all changes dramatically once we see a breakout above the resistance level. That's why breakouts (and their confirmations) are so important.
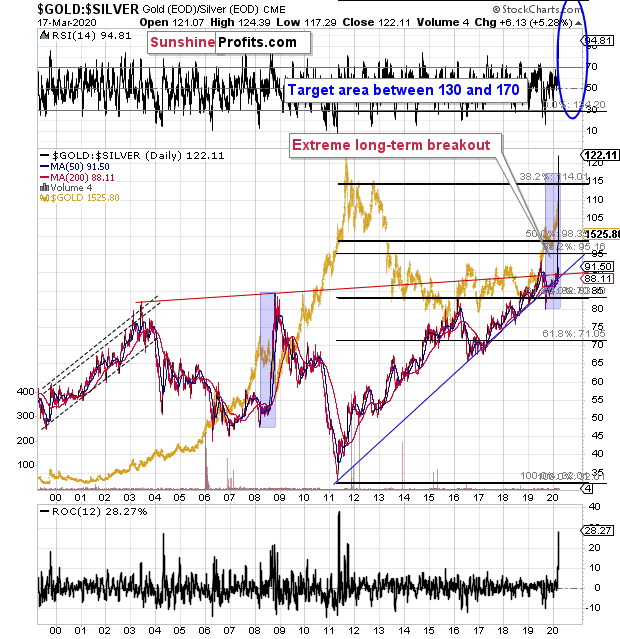
In case of the gold to silver ratio, we saw an extreme breakout. It normally takes at least several daily closes before a given breakout is confirmed. This kind of confirmation arrived but was not necessary because the breakout was so huge. It was definitely not accidental.
The breakout is a game-changer. It means that we are in uncharted waters and that it's a tough call to say how high can the gold to silver ratio really rally, since it was just strong enough to pierce through a multi-decade resistance like a hot knife through butter.
The Fibonacci extension tool can be useful here. The point is to "extend" the previous major move in a given direction by a factor of 1.618, 2, or 2.618. The last two are most interesting as the extension based on 1.618, was already reached and broken.
Based on these extensions, we get targets of 134 and about 170 (barely visible on the above chart). If gold declines to $890 after all, then the gold to silver ratio at about 170 would correspond to about $5 - close to its all-time lows.
Crazy? Wasn't it just as crazy to expect silver below $12 just a month ago?
Let's take a closer look at silver's very long-term chart.
Silver in the Spotlight
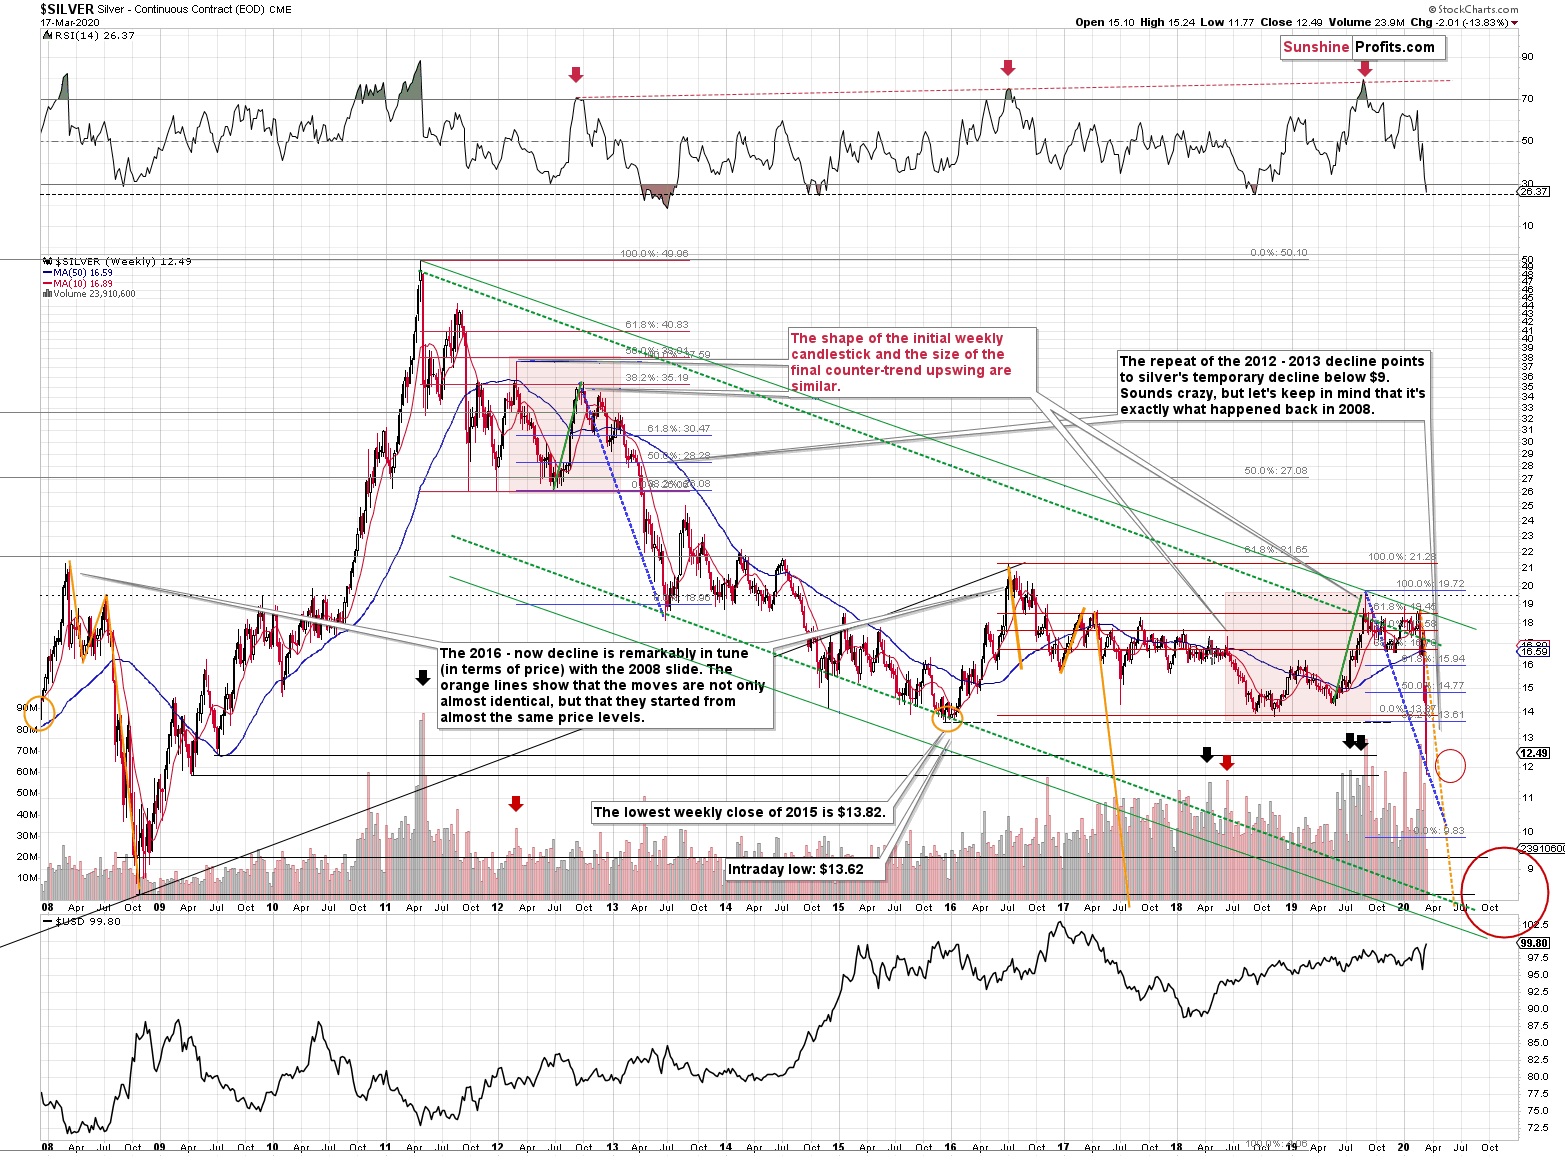
The analogy to 2008 that we outlined on Monday (and that we've been featuring for many months) clearly remains in place.
And so does the similarity to the 2012 - 2013 slide. The former is marked with yellow, and the latter is marked with blue.
Based on both analogies, it's about time (and price) for silver to correct... Before declining even more.
The analogy to 2008 has been working remarkably well in terms of prices. That's what the yellow lines represent. The most recent slide in silver is almost perfectly in tune with the initial sharp slide that we saw in 2008. Once you click on the chart to zoom in, you'll see a thin black line that shows the size of the slide in 2008, and you'll see that we copied it on the left side of the current decline. They are so similar that it's shocking even for us - and we've been writing about this extreme similarity for many months.
How did silver perform then in 2008?
It corrected to the nearest strong horizontal resistance level and the relatively round number of $14. It was about midway between the bottom and the 38.2% Fibonacci retracement. There was a second bottom after the initial one, two days later.
How about the current situation?
Silver moved lower today, and while it didn't move between yesterday's and Monday's intraday low, it's already very close. It will take silver only about 35 cents more to decline below yesterday's low and to make this rebound extremely similar to what happened in 2008. Then again, that's just a cherry on the analytical cake, and the analogy to 2008 will remain intact even if the shape of today's session is a bit different.
Silver is now a bit lower than it was in 2008 in nominal terms, so the midpoint between the recent low and the 38.2% Fibonacci retracement is below the $14 level. Is there any significant horizontal resistance located over there? Of course, there is!
It's the 2015 bottom - it formed at $13.62. This target is aligned with the mid-point between the recent low and the 38.2% Fibonacci retracement.
And the analogy to 2012-2013? Please note at what pace silver declined from the very first top (blue line). During the first very volatile slide, it corrected only after it reached the declining blue line. Guess what? Copying the same line to the recent final top (the 2019 one) provides us with a line that was just reached recently. This suggests that silver is about to rebound before moving again.
How high did silver rally during the analogous correction in 2013? It moved up by about 12.7%. Applying this kind of rally to the recent low in silver provides us with $11.77 * 1.127 = $13.26 as the target for the next local bottom. Of course, this analogy is not as precise as the 2008 one, so it can be used as its confirmation - this target is very close to the 2015 low.
One more note regarding the 2013 corrective upswing. Please note that two days after the initial bottom, silver formed another local low and then rallied in the following days. That's exactly the same way silver bottomed (temporarily) in 2008.
Today is the day that's two days after the initial bottom, so if silver moves temporarily lower today, please keep in mind that it's normal, and it doesn't invalidate the scenario in which silver now corrects higher.
This could be what's likely ahead for the stock market and other commodities as well. The S&P 500 futures are lower so far today, but this might be the final move lower before their corrective rally. Crude oil moved lower as well and it might be bottoming shortly (we just cashed in profits on our short position in crude oil about an hour ago). In tune with the above, mining stocks could decline early today, only to move back up later and/or in the following days - we are not exiting our long positions in the miners at this time.
In fact, the best risk to reward opportunity continues to be in the mining stocks in our view, even though silver is about to correct upwards.
It is often the case that silver outperforms mining stocks in the final part of a given rally, but after examining how corrective upswings were shaped in different parts of the PM market during the 2008, 2011, and 2013 declines, it seems that this rule doesn't really apply in case of quick rebounds within bigger declines.
If we see signs that miners are underperforming gold and that silver would still have some sizable upside potential, we might switch our long positions from miners to silver. It's too early to say if we're going to do it or not.
Also, we would like to take this opportunity to explain why we are aiming to profit on miners' rebound only. It's not because we're not forecasting gold or silver at (temporarily) higher prices. The corrective upswing is likely to take place, and it seems that it's already in progress. The point is that miners are usually the first to rally after a bottom, and they became ridiculously oversold in the short run recently, which made their run-up most likely and created the most favorable risk to reward setup. That's why our focus is over here right now. There will be many times, when diversification between gold, silver, and miners is the way to go, but right now, concentrating on the miners seems to be a better choice. This choice proved to be very lucrative over the last few days (especially that we entered the long positions in the miners in the final 25 minutes of Friday's session, almost right at the intraday low).
Summary
Summing up, the 2020 top in the precious metals market is in, and we are likely in the early stage of a 2008-like slide that appears to be about even worse than what happened that year. Still, it seems that we'll see a corrective upswing in gold, silver, and miners shortly. In fact, miners have already been rallying since the final minutes of Friday's session.
The profits on the new long positions in the miners are already very profitable, but it seems they will become even more so before we close them.
After the corrective upswing is over, we plan to get back on the short side of the precious metals market.
By the way, we recently opened a possibility to extend one's subscription for a year with a 10% discount in the yearly subscription fee (the profits that you took have probably covered decades of subscription fees...). It also applies to our All-Inclusive Package (if you didn't know - we just made huge gains shorting crude oil and are also making money on both the decline and temporary rebound in stocks). The boring time in the PMs is over and the time to pay close attention to the market is here - it might be a good idea to secure more access while saving 10% at the same time. You can proceed using the following link and in case you have some questions, please don't hesitate to contact us:
Secure more access at a discount.
As always, we'll keep you - our subscribers - informed.
To summarize:
Trading capital (supplementary part of the portfolio; our opinion): Full speculative long positions (150% of the full position) in mining stocks (but not in gold nor silver) are justified from the risk/reward perspective with the following binding exit profit-take price levels:
Senior mining stocks (price levels for the GDX ETF): binding profit-take exit price: $26.89; stop-loss: none (the volatility is too big to justify a SL order in case of this particular trade); binding profit-take level for the NUGT ETF: $17.63; stop-loss for the NUGT ETF: none (the volatility is too big to justify a SL order in case of this particular trade)
Junior mining stocks (price levels for the GDXJ ETF): binding profit-take exit price: $35.37; stop-loss: none (the volatility is too big to justify a SL order in case of this particular trade); binding profit-take level for the JNUG ETF: $13.93; stop-loss for the JNUG ETF: none (the volatility is too big to justify a SL order in case of this particular trade)
Long-term capital (core part of the portfolio; our opinion): No positions (in other words: cash)
Insurance capital (core part of the portfolio; our opinion): Full position
Whether you already subscribed or not, we encourage you to find out how to make the most of our alerts and read our replies to the most common alert-and-gold-trading-related-questions.
Please note that the in the trading section we describe the situation for the day that the alert is posted. In other words, it we are writing about a speculative position, it means that it is up-to-date on the day it was posted. We are also featuring the initial target prices, so that you can decide whether keeping a position on a given day is something that is in tune with your approach (some moves are too small for medium-term traders and some might appear too big for day-traders).
Plus, you might want to read why our stop-loss orders are usually relatively far from the current price.
Please note that a full position doesn't mean using all of the capital for a given trade. You will find details on our thoughts on gold portfolio structuring in the Key Insights section on our website.
As a reminder - "initial target price" means exactly that - an "initial" one, it's not a price level at which we suggest closing positions. If this becomes the case (like it did in the previous trade) we will refer to these levels as levels of exit orders (exactly as we've done previously). Stop-loss levels, however, are naturally not "initial", but something that, in our opinion, might be entered as an order.
Since it is impossible to synchronize target prices and stop-loss levels for all the ETFs and ETNs with the main markets that we provide these levels for (gold, silver and mining stocks - the GDX ETF), the stop-loss levels and target prices for other ETNs and ETF (among other: UGLD, DGLD, USLV, DSLV, NUGT, DUST, JNUG, JDST) are provided as supplementary, and not as "final". This means that if a stop-loss or a target level is reached for any of the "additional instruments" (DGLD for instance), but not for the "main instrument" (gold in this case), we will view positions in both gold and DGLD as still open and the stop-loss for DGLD would have to be moved lower. On the other hand, if gold moves to a stop-loss level but DGLD doesn't, then we will view both positions (in gold and DGLD) as closed. In other words, since it's not possible to be 100% certain that each related instrument moves to a given level when the underlying instrument does, we can't provide levels that would be binding. The levels that we do provide are our best estimate of the levels that will correspond to the levels in the underlying assets, but it will be the underlying assets that one will need to focus on regarding the signs pointing to closing a given position or keeping it open. We might adjust the levels in the "additional instruments" without adjusting the levels in the "main instruments", which will simply mean that we have improved our estimation of these levels, not that we changed our outlook on the markets. We are already working on a tool that would update these levels on a daily basis for the most popular ETFs, ETNs and individual mining stocks.
Our preferred ways to invest in and to trade gold along with the reasoning can be found in the how to buy gold section. Additionally, our preferred ETFs and ETNs can be found in our Gold & Silver ETF Ranking.
As a reminder, Gold & Silver Trading Alerts are posted before or on each trading day (we usually post them before the opening bell, but we don't promise doing that each day). If there's anything urgent, we will send you an additional small alert before posting the main one.
Thank you.
Sincerely,
Przemyslaw Radomski, CFA
Editor-in-chief, Gold & Silver Fund Manager

