

Briefly: in our opinion, full (200% of the regular size of the position) speculative short positions in gold, silver and mining stocks are justified from the risk/reward perspective at the moment of publishing this alert.
Gold stocks outperformed gold on Friday and we had previously written that this is the kind of the bullish confirmation that we would be looking for in order to take profits from our short position or even enter a long one. Is this really the case and will we see gold much higher shortly?
It’s not really the case. Yes, we did write out the need to see a bullish confirmation before deciding to close or reverse the current short positions. However, the strength could have come in various ways and be accompanied by different developments. The perfect confirmation would be if silver didn’t outperform gold, but mining stocks did and if it was accompanied by gold’s strength relative to the signals coming from the USD Index.
Silver outperformed gold, just as mining stocks did and gold actually underperformed the signal coming from the USDX. The latter declined on Friday while gold was higher by a mere $0.20. That’s a bearish confirmation, not a bullish one.
This, plus the very limited potential for the rally in gold stocks and silver makes us keep the current positions intact.
Let’s take a closer look at the charts (charts courtesy of http://stockcharts.com).
Gold’s Decline and Downside Targets
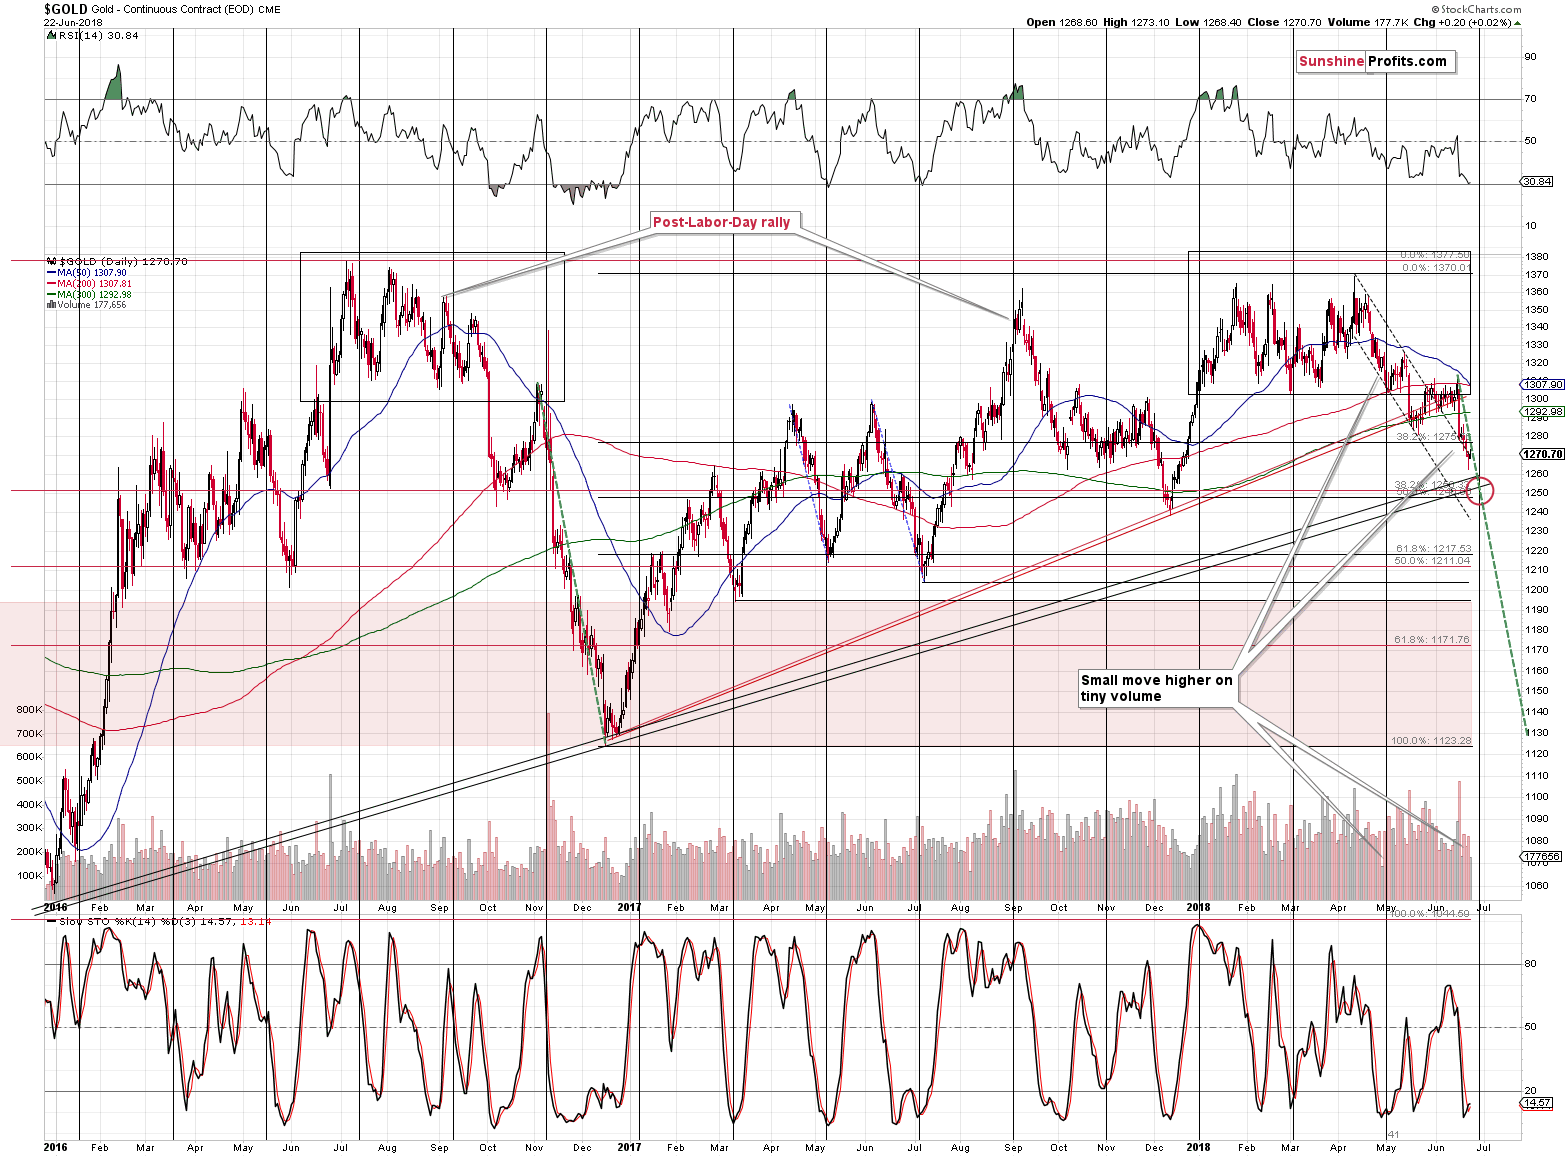
Gold moved only a bit higher on very small volume. That’s a classic sign of a pause, not the end of a decline.
Gold’s and mining stocks’ cyclical turning point is on Wednesday and based on the above chart it’s likely that we’ll see a turnaround at that time, likely with gold at $1,250 or slightly above it.
If reversal does not happen on Wednesday, then what??
Then we look at all the information that the market provides us with and check what if it makes any positions justified. If it does, we change the current position (or lack thereof) to what will be justified at that time. If we still have a position by that time and the information available on Wednesday (or on any following day) doesn’t justify it, we’ll close it, or open one that will be justified.
In other words, we’ll do what we are doing every other day as we don’t keep an open position just for the sake of keeping it or because it’s in tune with the information that was available when we had opened it. In fact, we sometimes close positions not because of a signal to close it, but because something makes the situation too neutral to justify risking one’s capital for any trade.
In addition to the above, the lack of reversal would mean that we would be less inclined to put a lot of weight to the next turning point, but this single case wouldn’t make the technique useless on its own, as it worked multiple times in the past.
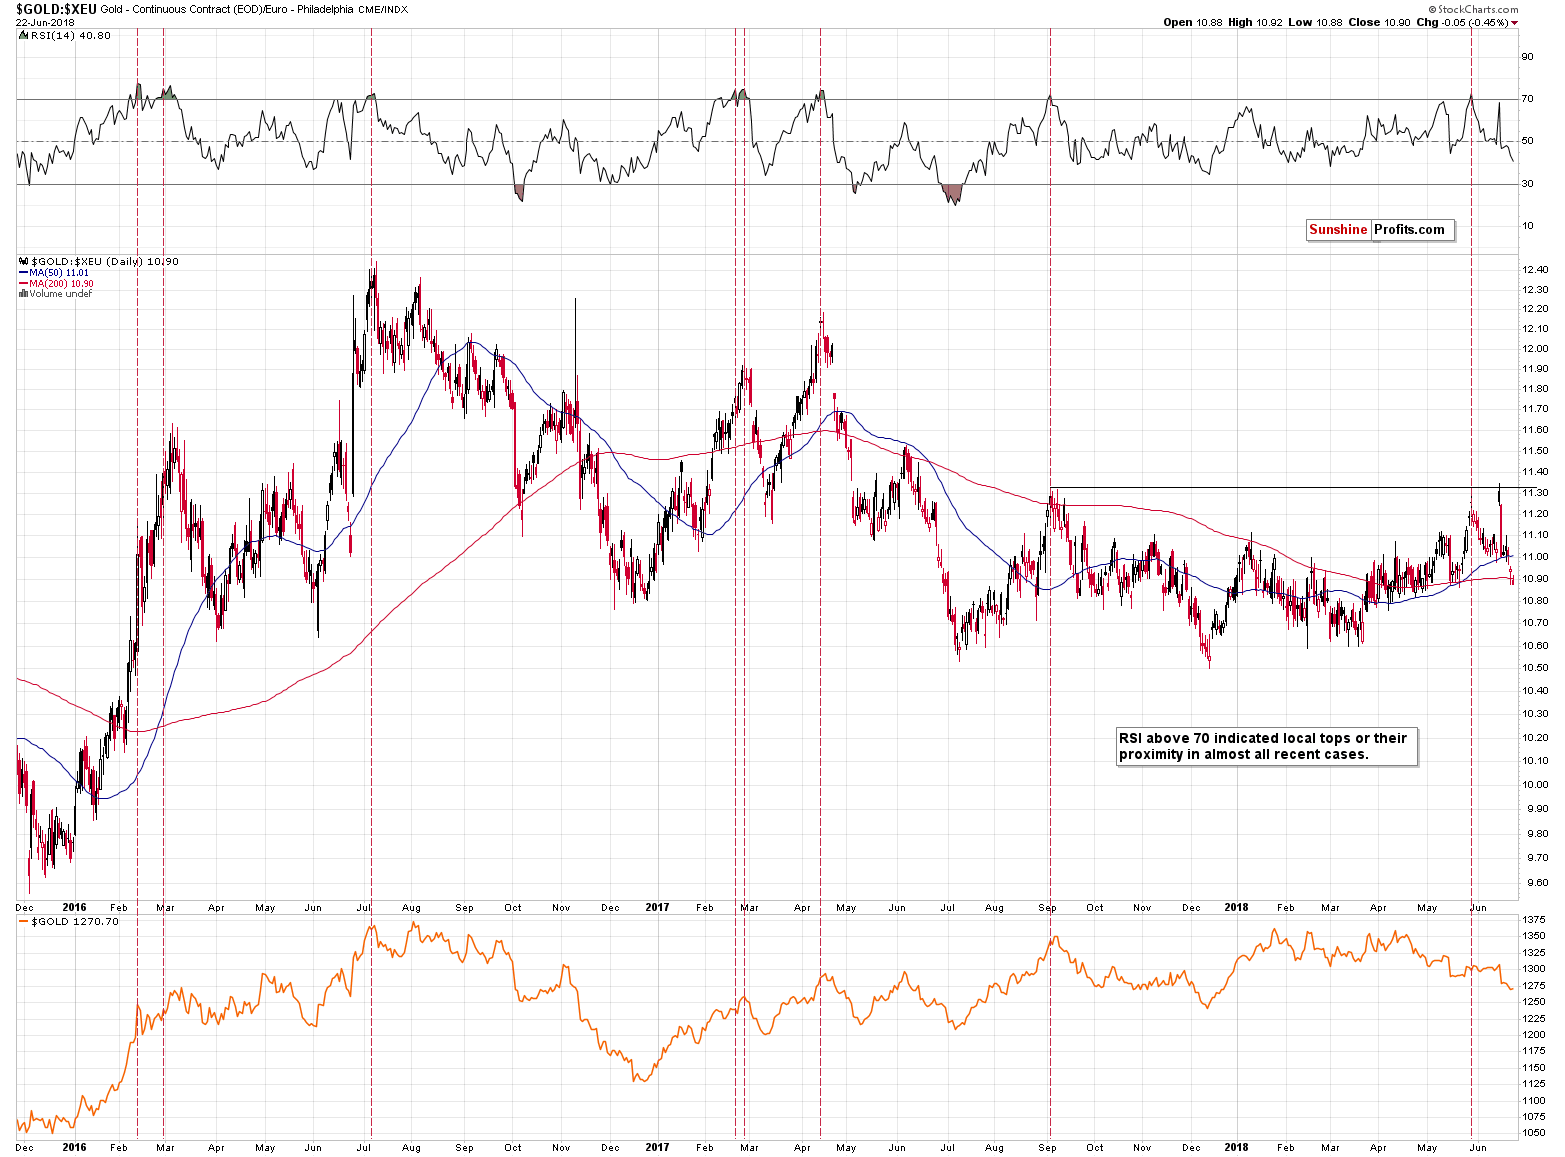
If we look at gold’s performance in terms of the euro, we see that gold actually declined to new monthly low on Friday after reversing several days ago at its September 2017 high, just like we had indicated on June the 15th:
Gold’s price in terms of the euro moved sharply higher yesterday, but didn’t break above the major September 2017 high. This, plus the fact that the RSI indicator moved very close to the 70 level makes a turnaround very likely. Please note that the RSI indicator moved almost to the 70 level also in the first half of May. Gold (in USD terms) moved to new monthly low shortly thereafter.
History repeated itself and gold has once again moved to the new low in USD terms.
What are the implications going forward? The downtrend is likely to continue as RSI doesn’t indicate the oversold status.
Gold is very close to its May low, but this low doesn’t seem significant enough to trigger a reversal.
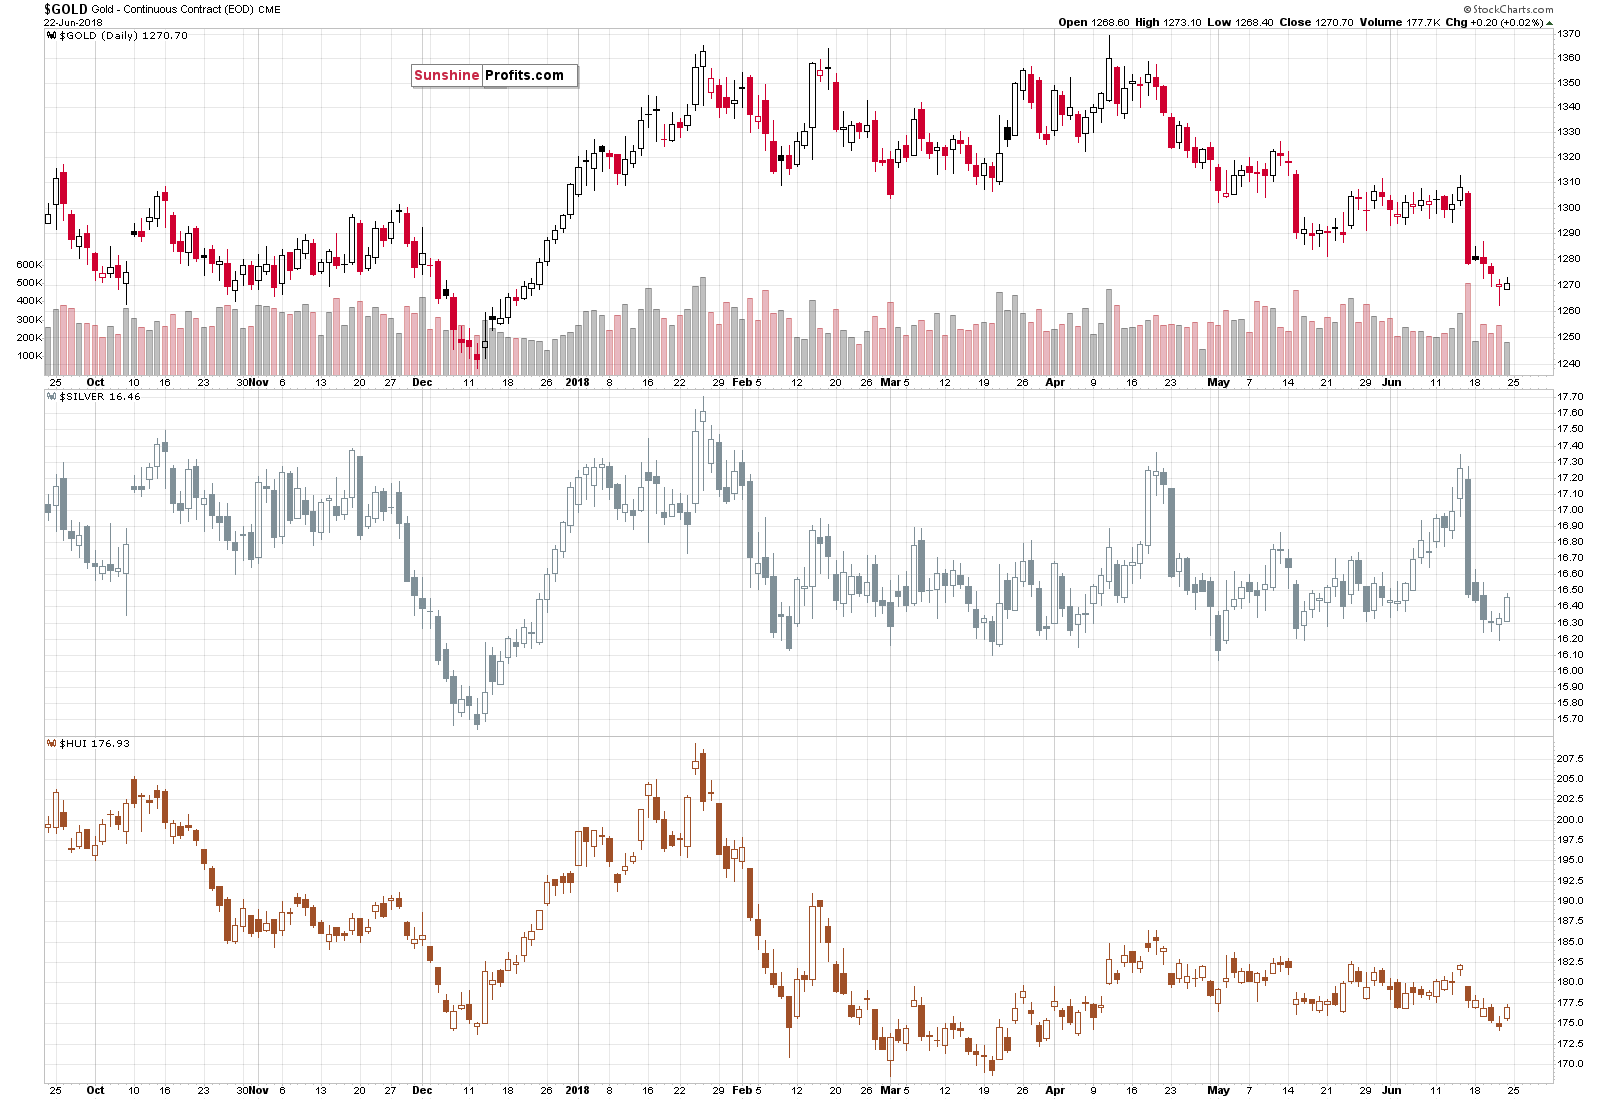
Silver’s and mining stocks’ performance relative to gold was rather strong, but since both market acted in this way it’s not clear what are the real implications. Silver tends to outperform right before tops while a strength in the miners is likely to lead to further gains. With both of them present, the bullish implications are small or even absent.
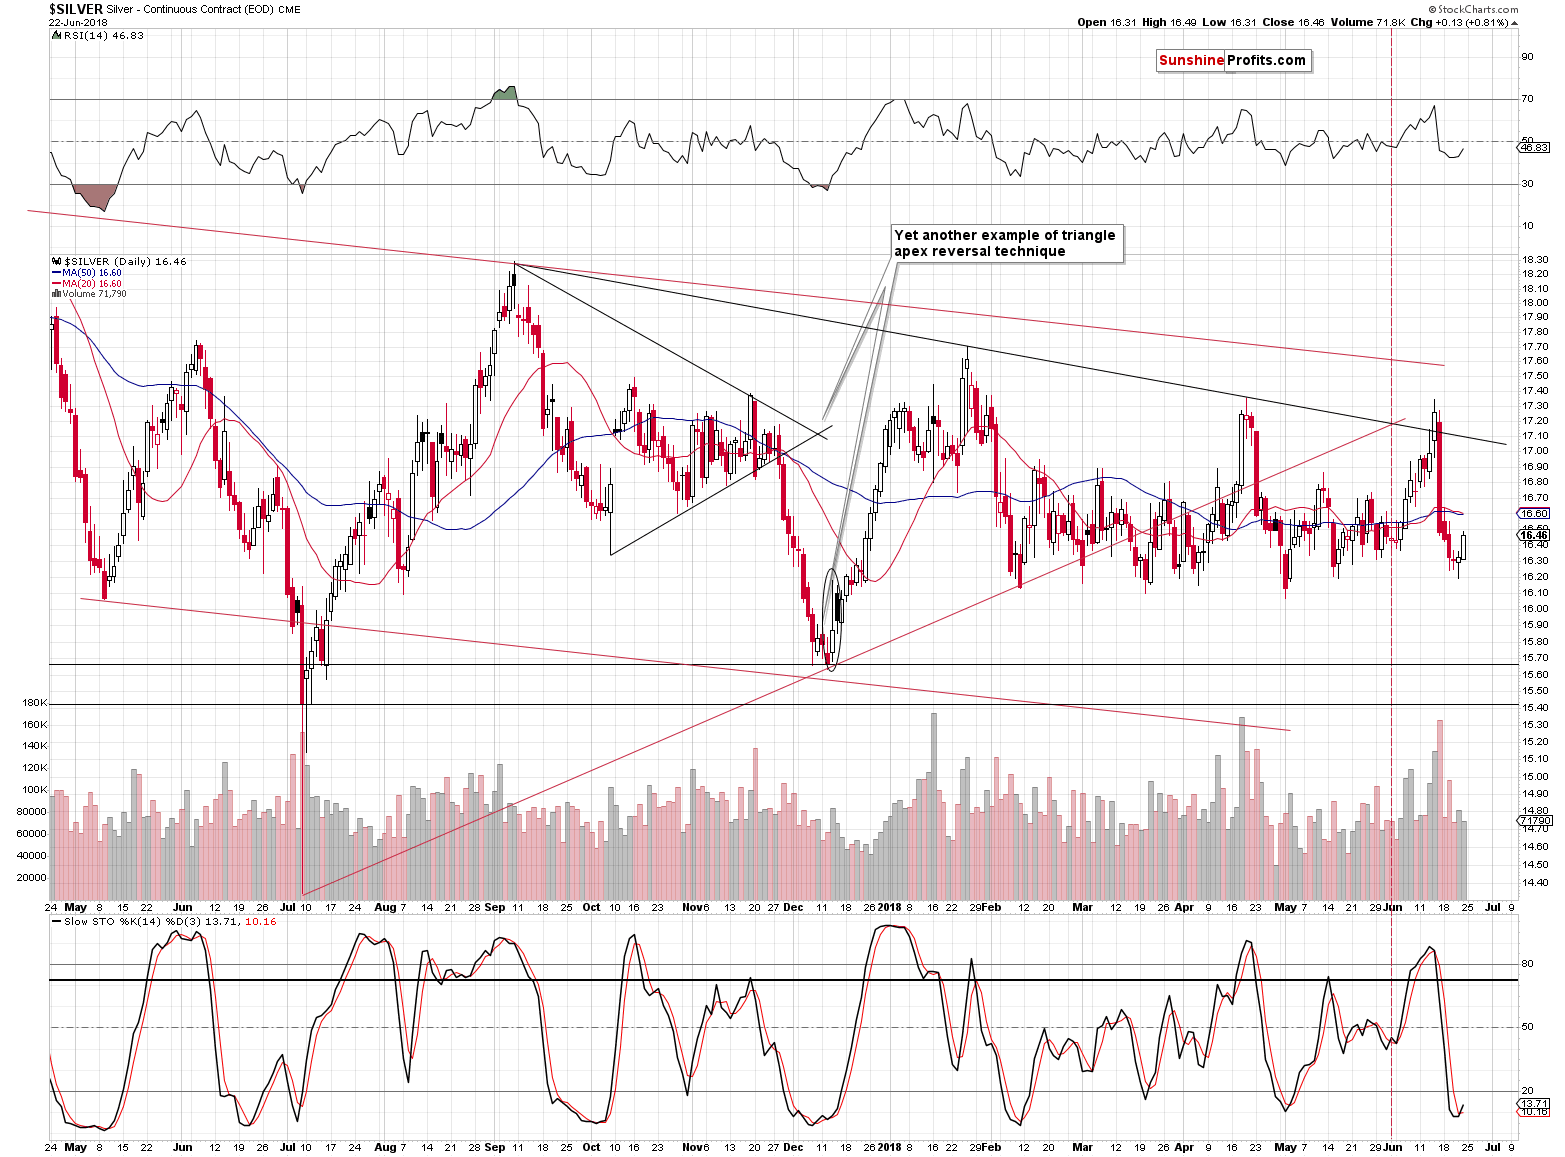
The white metal closed the week at $16.46, but at the moment of writing these words it’s already at $16.38 and the overall size of the recent upswing is small. We can say the same about the implications – the move was not significant enough to trigger any.
We saw a buy signal from the Stochastic indicator and based on it we could see another move higher. Yet, based on the proximity of the very long-term declining resistance line, silver is not likely to rally far – if it rallies at all.
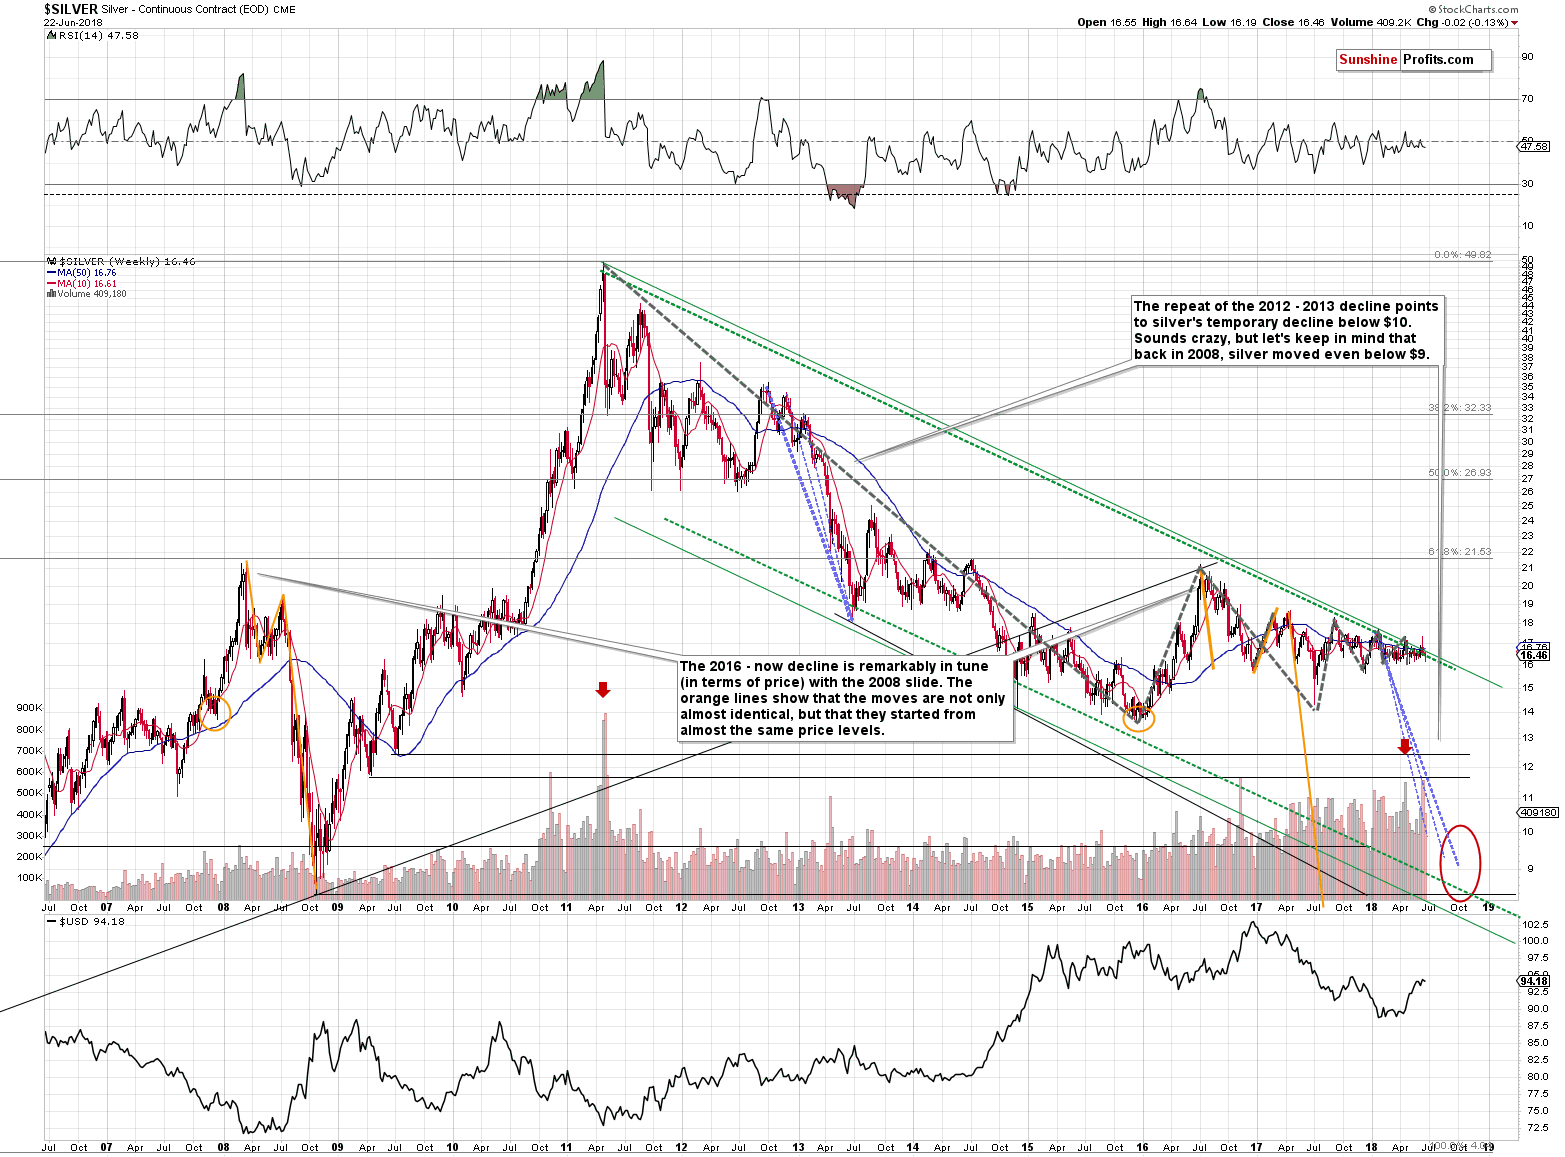
Based on the long-term declining green resistance line, the resistance is at approximately $16.60, which is not far from the current silver price. Knowing silver’s intraday and overnight volatility, it might be impossible to get back into short positions at better prices should one decide to close it now.
Speaking of limited upsides, let’s look at the HUI Index.
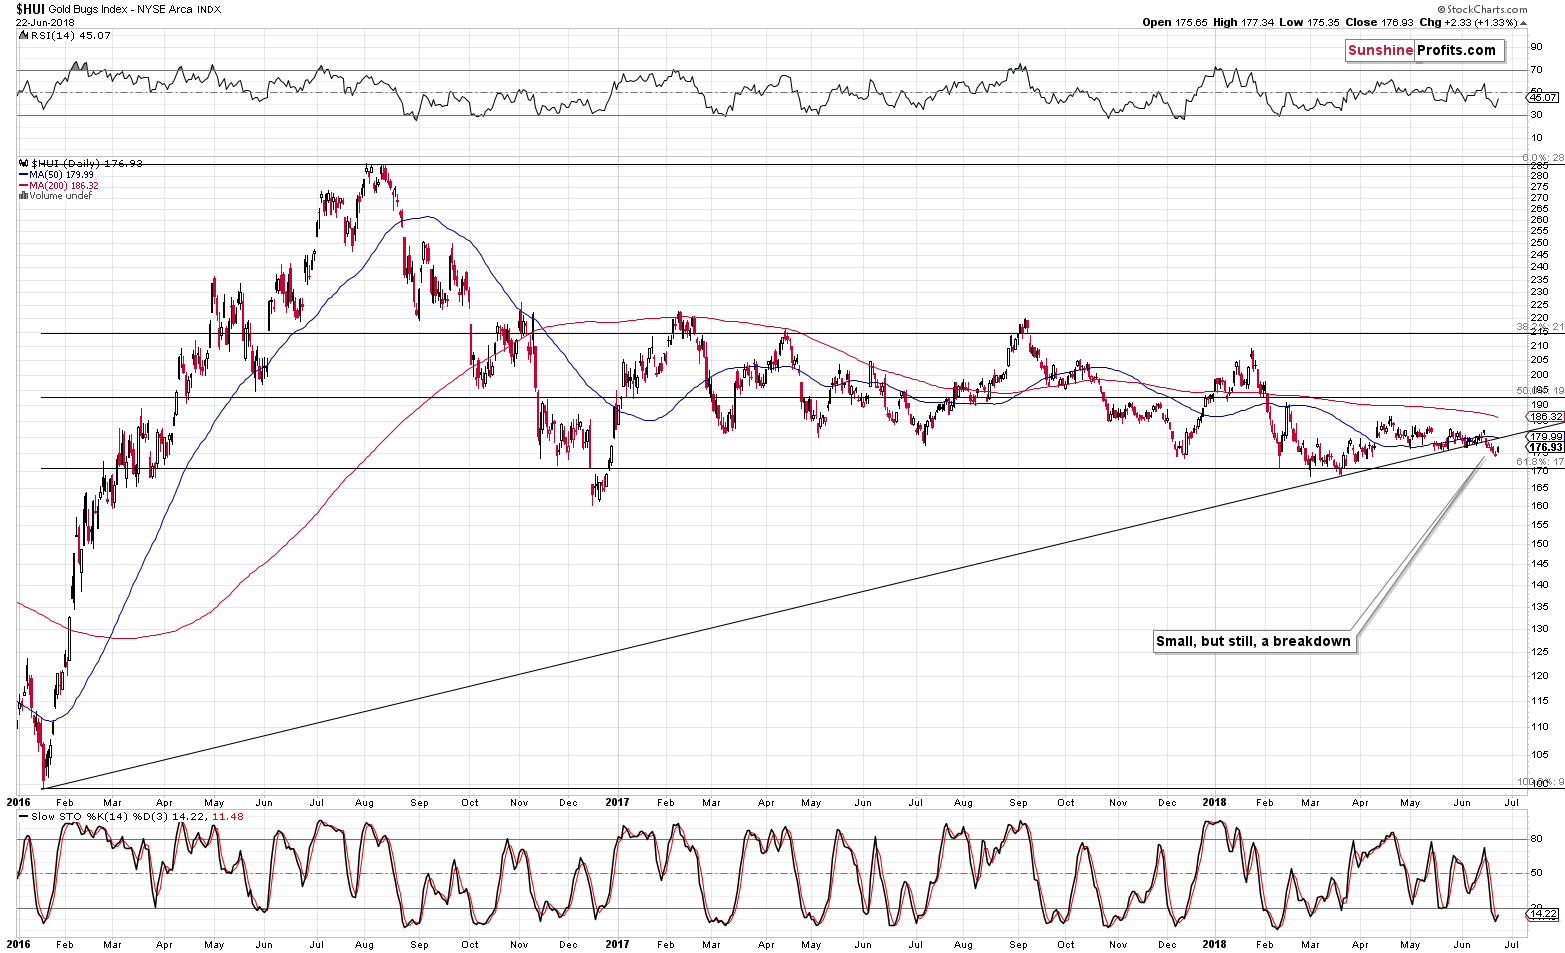
IF (again, it’s not something that we give big probability of happening) the precious metals sector moves higher, then gold stocks are not likely to break above their rising medium-term resistance line. After all, the breakdown below it was more than confirmed. This means that even if the HUI Index moves higher it’s unlikely to rally above 180 and even if it does, it’s very unlikely to stay above this level for more than a day or so.
As a reminder, the above-mentioned rising resistance line is very important due to its analogy to what happened in 2012 and 2013. Our June the 11th comments remain up-to-date:
Let’s start the discussion by looking at the rising dashed support line that’s based on the 2016 low and the 2018 low. Gold stocks are practically right at this support line and breaking it is likely to trigger a bigger move lower as that’s how important support lines work in general. The above is an important line, because it’s based on important bottoms (both are yearly lows).
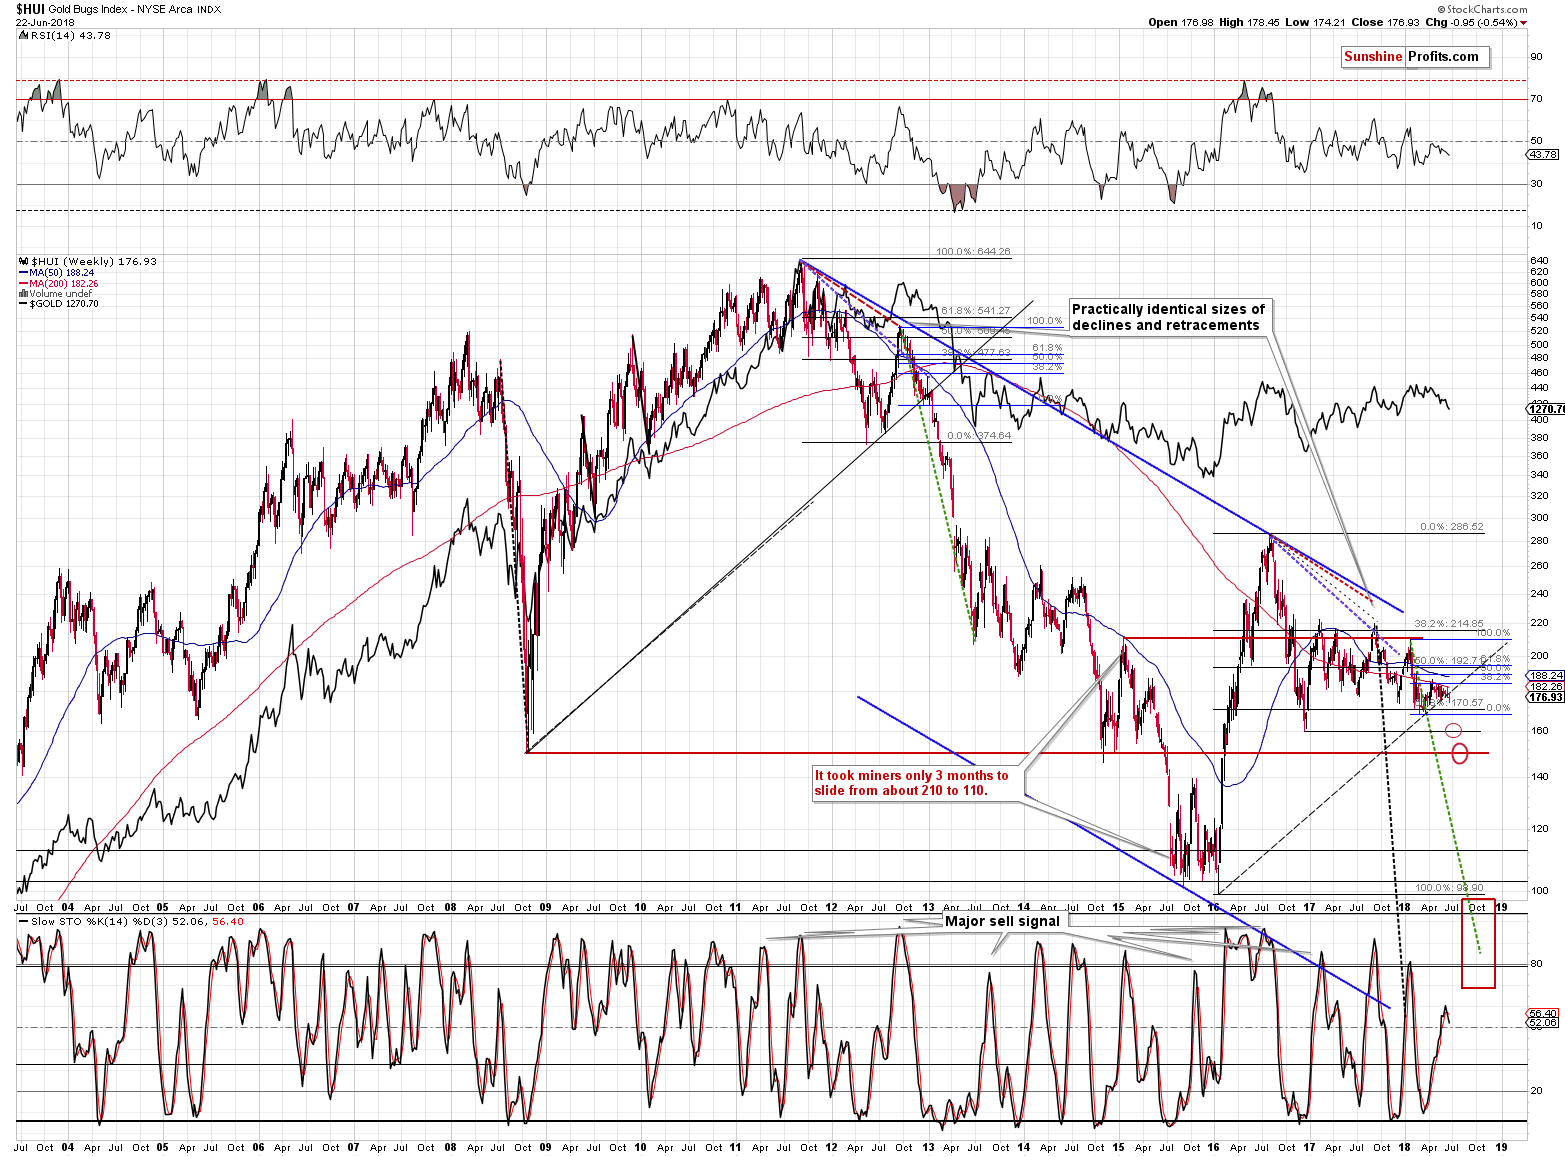
But, there’s much more to this line than just the above. Namely, we saw something similar in late 2012 and early 2013. The HUI Index moved to the important rising support line that was based on major bottoms and it consolidated above it. That’s more or less what we’re seeing at this time. The key thing is what happened next in 2013 and what happened next was the biggest decline in years. The pause at the rising support line was the final stop before the biggest dive. It seems that mining stocks are in the final part of preparing to do the same.
The striking thing about the above analogy is that it’s confirmed by slope of the support line. We copied the current (dashed) support line to the 2008 bottom and if you didn’t notice it previously, it only confirms just how similar both lines are. Speaking of slopes, if you look at the purple dashed lines that start at the 2011 and 2016 tops (they are identical to emphasize the very similar shape of the post-top action), you’ll see that extending them causes them to cross the above-mentioned rising support line practically right at the moment when the decline accelerated. That’s right, it means that it should start any day now.
There are no implications for the next day or a few of them, but the consequences for the following weeks and months are extremely bearish, especially as what we described today is only an addition to multiple other bearish factors that we had described in the previous alerts.
The long-term support line is one of the factors that makes this decline similar to the 2012-2013 one and the confirmed breakdown means that the really volatile part has just begun.
Having said that, let’s take a look at what happened in the USD Index.
USDX at Its Previous Lows
In Friday’s alert, we commented on USD’s performance in the following way:
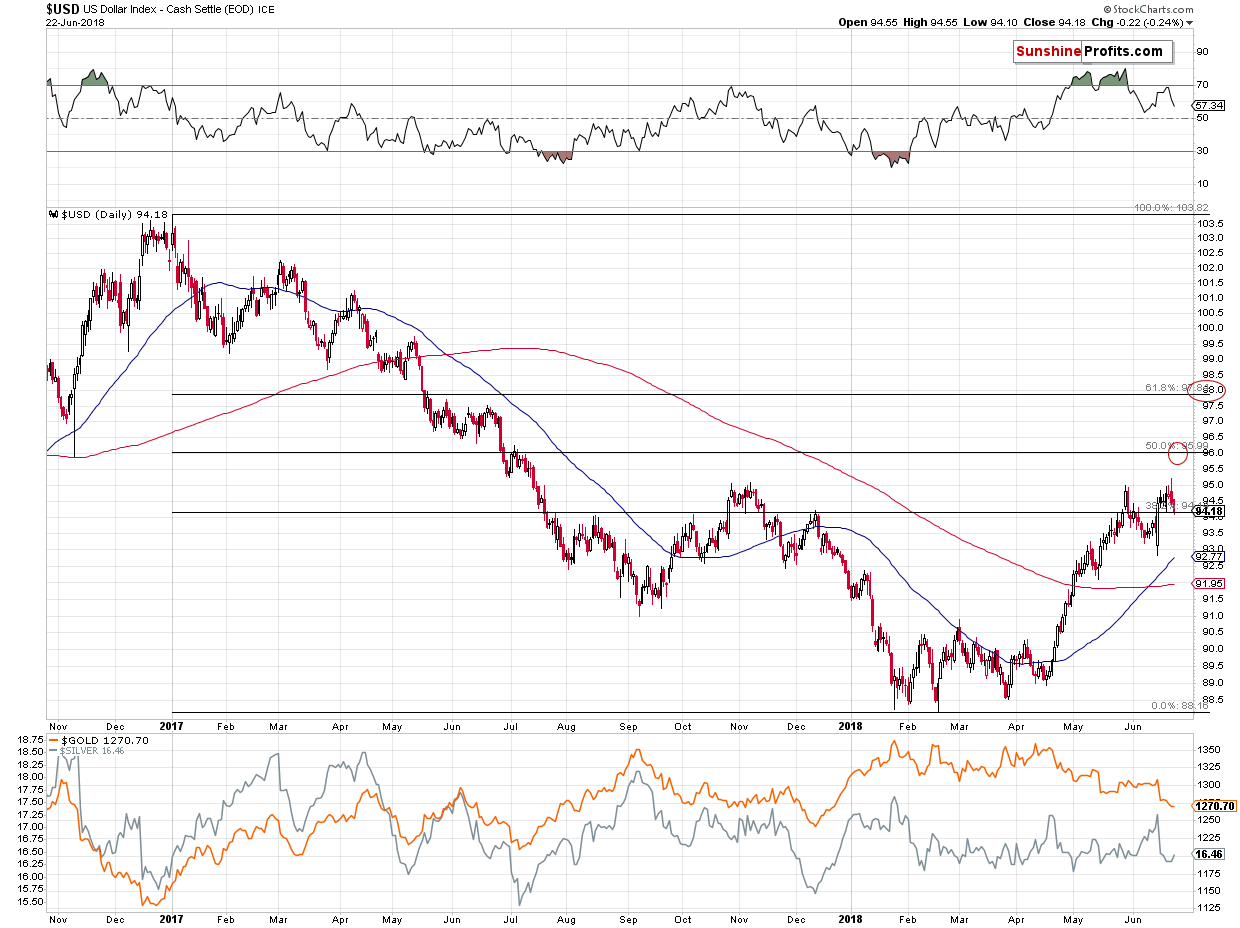
Yesterday’s session turned out to be a shooting star candlestick, which is a bearish development for the short term, especially that it was an invalidation of a breakout above the May high.
Yet, gold didn’t rally despite the daily move lower in the USDX and it’s only $2 higher (at $1,269) despite the USD’s 0.34 move lower in today’s pre-market trading.
This is a weak type of reaction and it’s the opposite of a bullish confirmation and it’s the second of the two main reasons due to which we are not adjusting our current short position at this time.
The USD Index may be correcting, but with a weak reaction in gold, it doesn’t seem that adjusting positions in gold is a good idea. If gold doesn’t want to respond to the USD’s bullish signals, it’s likely to respond to the bearish signals that are likely to follow.
And they are indeed likely to follow. Yesterday’s session might have triggered today’s pre-market decline and it caused the USDX to move back to this week’s early lows, but if the analogy to 2014 is to be upheld (and we haven’t seen anything proving otherwise, only more and more signs confirming the analogy), then we shouldn’t be expecting a meaningful decline here.
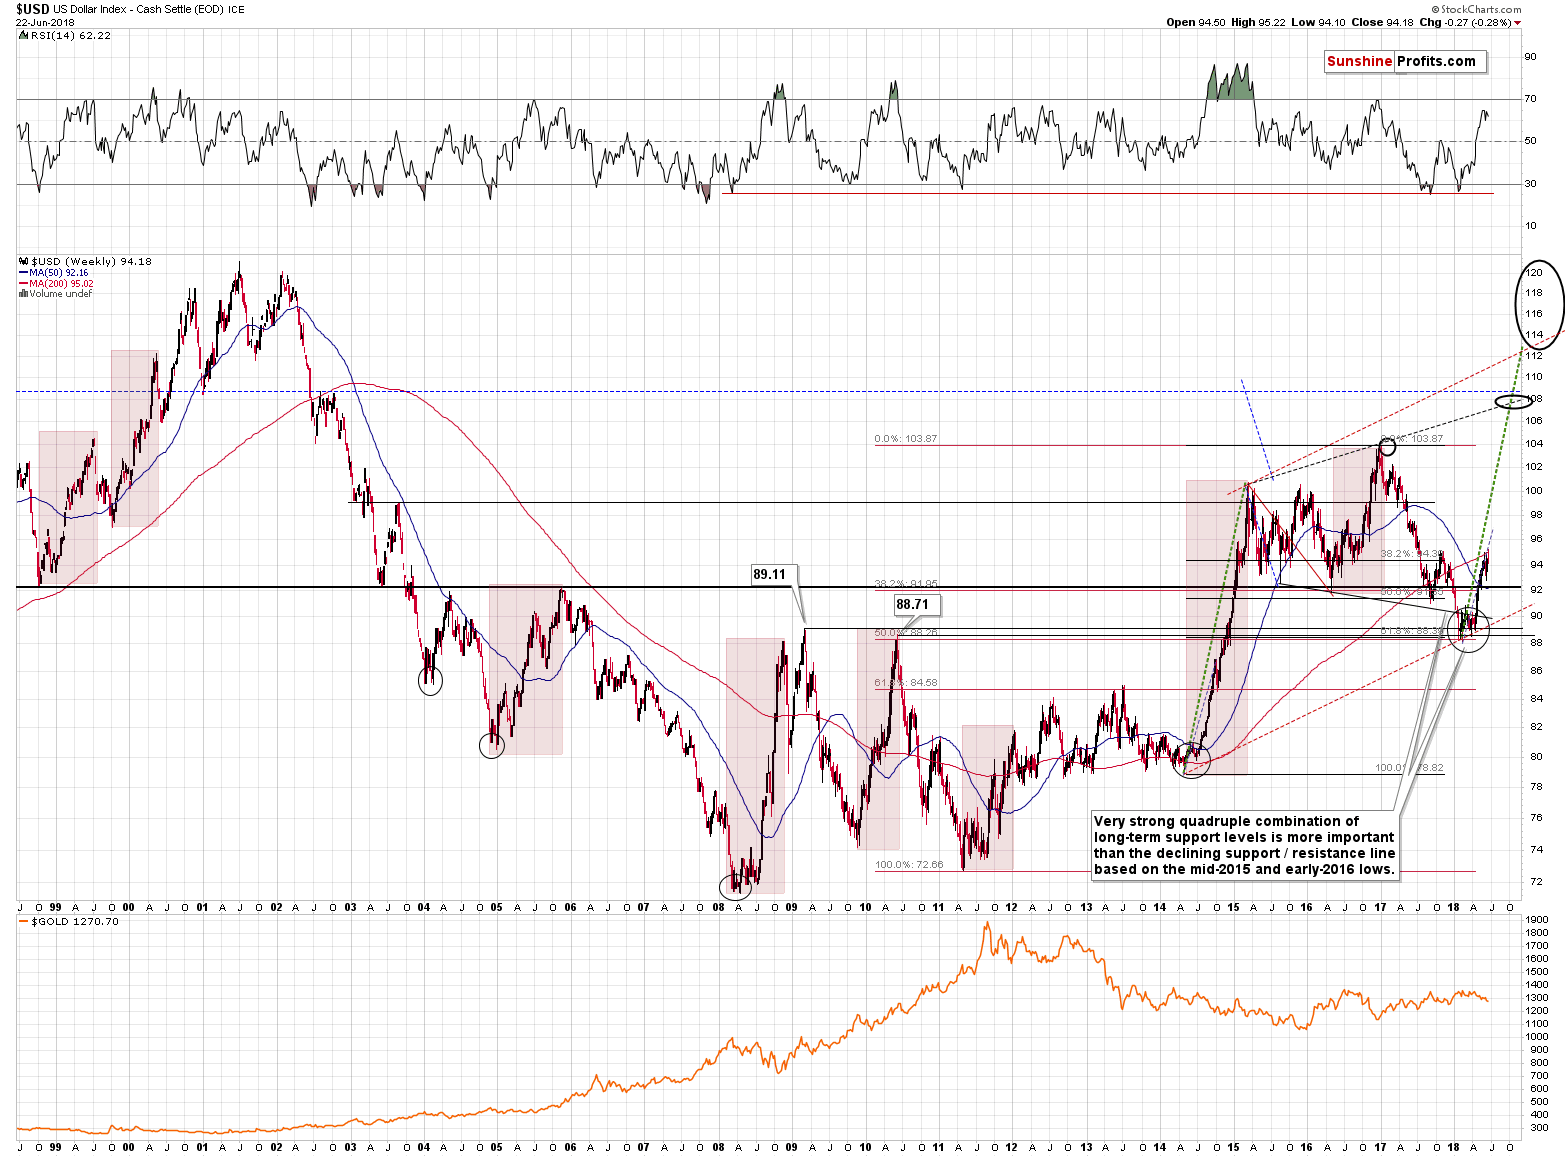
There was one corrective upswing in late 2014 and we have definitely seen one in the past few weeks. While the above analogy doesn’t rule out another few-week long decline entirely, it does make it quite unlikely. Since the USDX didn’t even move to new weekly lows, it seems best to keep the current positions intact and focus on the bigger move. If we see an invalidation of the analogy to 2014 or other major bearish signs for the USDX, we’ll likely close the current forex positions at least temporarily, but at this time it seems too early to do so.
At the moment of writing these words, the price of gold is once again $1,269, so the above comments on gold’s relative performance remain up-to-date. The USD Index closed the session 0.22 lower instead of the above-mentioned 0.34, but gold’s reaction was still weak. The implications are bearish.
On an administrative note, for the past 2 weeks the Gold & Silver Trading Alerts included more forex details than usually as a temporary merger between regular Gold & Silver Trading Alerts and Forex Trading Alerts. This temporary period ends today and the forex analysis now continues in the regular way in its separate section. Naturally, we will still include forex charts to Gold & Silver Trading Alerts from time to time, but only if the situation on these charts is likely to impact the precious metals sector in a material way (just like we’ve done in the previous months and years).
Summary
Summing up, the very short-term outlook for the precious metals sector is rather unclear. We have a cyclical turning point on Wednesday, which suggests that we’ll either see a decline shortly and a bottom on this day, or that the PMs will move higher and top on this day. The former seems more likely, but even if we see the latter scenario, the upside for gold, silver and mining stocks doesn’t seem to be significant. Overall, based on the information right now, it doesn’t seem that adjusting the current short position is justified at this time.
As always, we’ll keep you – our subscribers – informed.
To summarize:
Trading capital (supplementary part of the portfolio; our opinion): Full short positions (200% of the full position) in gold, silver and mining stocks are justified from the risk/reward perspective with the following stop-loss orders and initial target price levels:
- Gold: initial target price: $1,251; stop-loss: $1,382; initial target price for the DGLD ETN: $48.88; stop-loss for the DGLD ETN $37.48
- Silver: initial target price: $15.73; stop-loss: $18.06; initial target price for the DSLV ETN: $27.58; stop-loss for the DSLV ETN $19.17
- Mining stocks (price levels for the GDX ETF): initial target price: $21.03; stop-loss: $23.54; initial target price for the DUST ETF: $28.88; stop-loss for the DUST ETF $21.16
In case one wants to bet on junior mining stocks' prices (we do not suggest doing so – we think senior mining stocks are more predictable in the case of short-term trades – but if one wants to do it anyway, we provide the details), here are the stop-loss details and initial target prices:
- GDXJ ETF: initial target price: $30.62; stop-loss: $36.14
- JDST ETF: initial target price: $59.68 stop-loss: $40.86
Long-term capital (core part of the portfolio; our opinion): No positions (in other words: cash)
Insurance capital (core part of the portfolio; our opinion): Full position
Important Details for New Subscribers
Whether you already subscribed or not, we encourage you to find out how to make the most of our alerts and read our replies to the most common alert-and-gold-trading-related-questions.
Please note that the in the trading section we describe the situation for the day that the alert is posted. In other words, it we are writing about a speculative position, it means that it is up-to-date on the day it was posted. We are also featuring the initial target prices, so that you can decide whether keeping a position on a given day is something that is in tune with your approach (some moves are too small for medium-term traders and some might appear too big for day-traders).
Plus, you might want to read why our stop-loss orders are usually relatively far from the current price.
Please note that a full position doesn’t mean using all of the capital for a given trade. You will find details on our thoughts on gold portfolio structuring in the Key Insights section on our website.
As a reminder – “initial target price” means exactly that – an “initial” one, it’s not a price level at which we suggest closing positions. If this becomes the case (like it did in the previous trade) we will refer to these levels as levels of exit orders (exactly as we’ve done previously). Stop-loss levels, however, are naturally not “initial”, but something that, in our opinion, might be entered as an order.
Since it is impossible to synchronize target prices and stop-loss levels for all the ETFs and ETNs with the main markets that we provide these levels for (gold, silver and mining stocks – the GDX ETF), the stop-loss levels and target prices for other ETNs and ETF (among other: UGLD, DGLD, USLV, DSLV, NUGT, DUST, JNUG, JDST) are provided as supplementary, and not as “final”. This means that if a stop-loss or a target level is reached for any of the “additional instruments” (DGLD for instance), but not for the “main instrument” (gold in this case), we will view positions in both gold and DGLD as still open and the stop-loss for DGLD would have to be moved lower. On the other hand, if gold moves to a stop-loss level but DGLD doesn’t, then we will view both positions (in gold and DGLD) as closed. In other words, since it’s not possible to be 100% certain that each related instrument moves to a given level when the underlying instrument does, we can’t provide levels that would be binding. The levels that we do provide are our best estimate of the levels that will correspond to the levels in the underlying assets, but it will be the underlying assets that one will need to focus on regarding the signs pointing to closing a given position or keeping it open. We might adjust the levels in the “additional instruments” without adjusting the levels in the “main instruments”, which will simply mean that we have improved our estimation of these levels, not that we changed our outlook on the markets. We are already working on a tool that would update these levels on a daily basis for the most popular ETFs, ETNs and individual mining stocks.
Our preferred ways to invest in and to trade gold along with the reasoning can be found in the how to buy gold section. Additionally, our preferred ETFs and ETNs can be found in our Gold & Silver ETF Ranking.
As a reminder, Gold & Silver Trading Alerts are posted before or on each trading day (we usually post them before the opening bell, but we don't promise doing that each day). If there's anything urgent, we will send you an additional small alert before posting the main one.
=====
Latest Free Trading Alerts:
Stocks were mixed on Friday, as investors continued to hesitate following recent fluctuations. The broad stock market is expected to open lower following trade war fears, among other factors. So is this a topping pattern or just correction before another leg up? There are still two possible medium-term scenarios.
Trade War Fears, Global Stock Markets' Decline - Stocks to Continue Lower?
=====
Hand-picked precious-metals-related links:
PRECIOUS-Gold edges lower as dollar firms; trade tensions limit downside
Mauritian Exchange Sees $6.5 Billion Gold Trading in Five Years
=====
In other news:
Trade worries hit world stocks, oil gives back gains
Morgan Stanley Sees Yield Peak in Split With Pimco, JPMorgan
Europe's banks and industrials stocks sink as trade dispute deepens
Tech could soon turn into the market's headache: Wells Fargo's Chris Harvey
Oil drops after OPEC+ output deal, but markets to stay tight
=====
Thank you.
Sincerely,
Przemyslaw Radomski, CFA
Founder, Editor-in-chief, Gold & Silver Fund Manager
Gold & Silver Trading Alerts
Forex Trading Alerts
Oil Investment Updates
Oil Trading Alerts

