

The U.S. stock market indexes were mixed between -0.3% and +0.5% on Friday, extending their short-term consolidation, as investors' sentiment remained neutral. The S&P 500 index continues to trade along 2,750 mark. It currently trades 4.1% below the January's 26th record high of 2,872.87. The Dow Jones Industrial Average gained 0.5%, as it was relatively stronger than the broad stock market, and the technology Nasdaq Composite lost 0.5% on Friday.
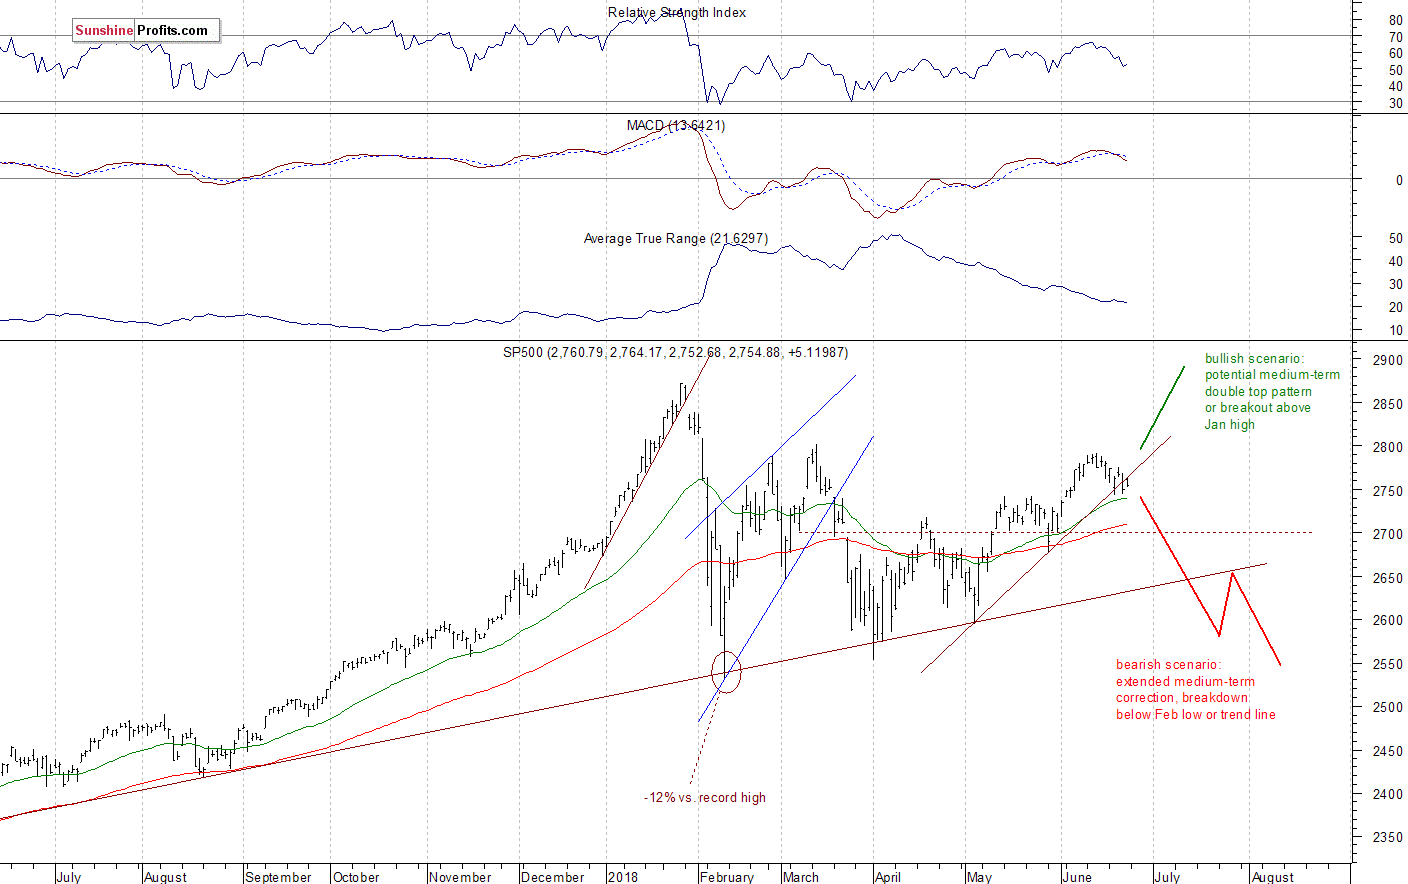
The nearest important level of resistance of the S&P 500 index remains at around 2,780-2,800, marked by the recent local highs along with the mid-March local high. The resistance level is also at 2,830-2,840, marked by the late January short-term consolidation. On the other hand, support level is at 2,750, marked by the previous level of resistance and some recent local lows. The next important level of support is at 2,735-2,740, marked by June the 4th's daily gap-up of 2,736.93-2,740.54. The support level is also at 2,700-2,720.
The broad stock market retraced some of early June advance recently. But it keeps bouncing off support level of around 2,750. Will the uptrend resume? Or is this just a flat correction within a new downtrend? There are still two possible medium-term scenarios - bearish that will lead us below the February low following trend line breakdown, and the bullish one in a form of medium-term double top pattern or breakout towards 3,000 mark. There is also a chance that the market will just go sideways for some time, and that would be positive for bulls in the long run (some kind of an extended flat correction). The S&P 500 index trades below its two-month-long upward trend line:
Negative Expectations, but Will Downtrend Continue?
Expectations before the opening of today's trading session are very negative, because the index futures contracts trade 0.7-1.0% below their Friday's closing prices. The European stock market indexes have lost 0.9-1.2% so far. Investors will wait for the New Home Sales number release at 10:00 a.m. The broad stock market will likely open lower today following global stock markets' decline. Then the S&P 500 index may extend its short-term fluctuation along the level of 2,750. Is this a new downtrend? For now it looks like a correction within the two-month long uptrend. However, if the index breaks below its last week's local lows, we could see more selling pressure.
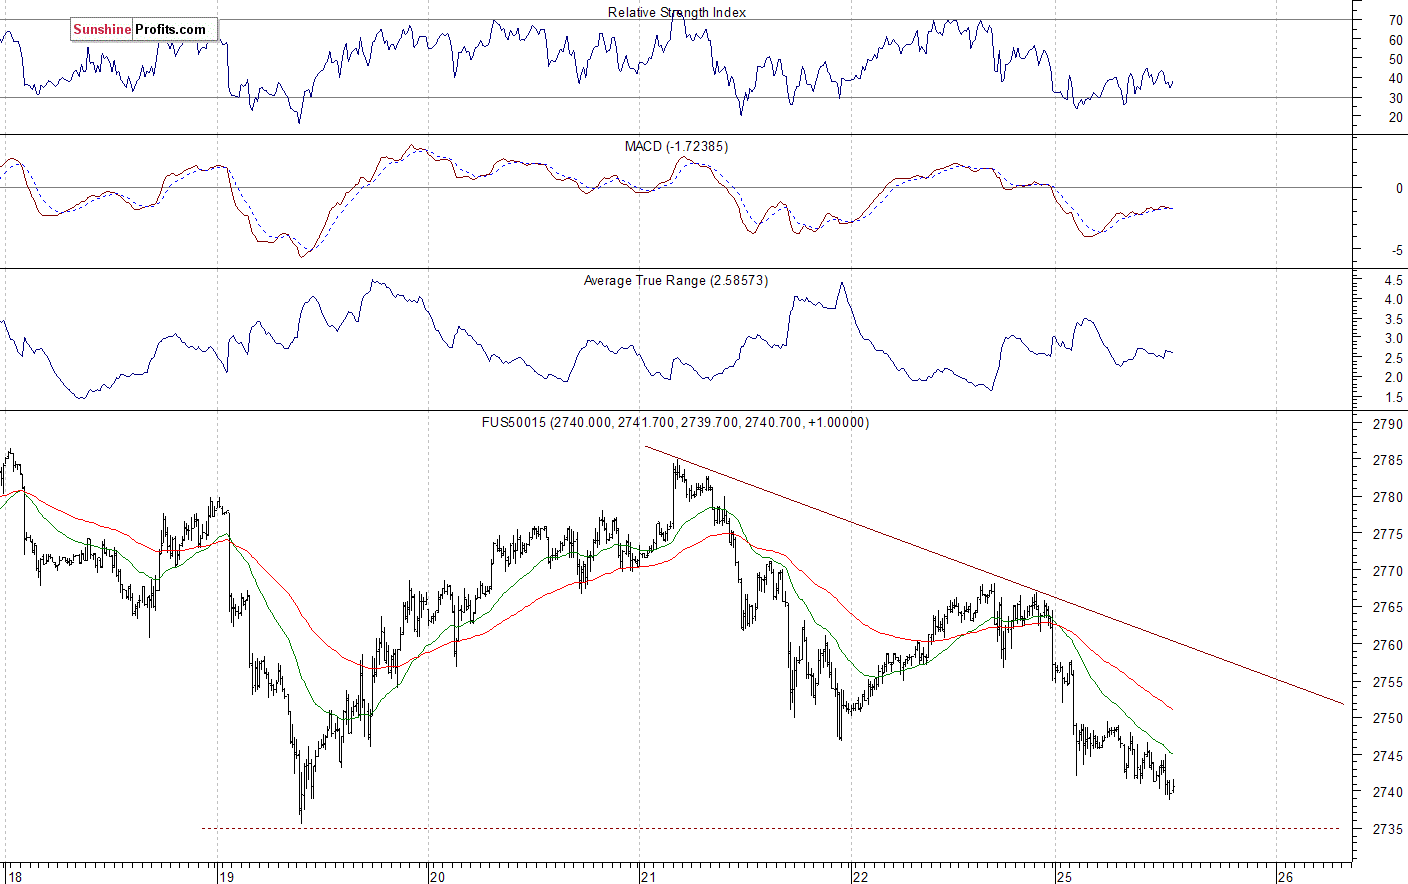
The S&P 500 futures contract trades within an intraday downtrend, as it slightly extends its overnight decline. The nearest important level of resistance is at around 2,750, marked by the short-term local highs. The next resistance level is at 2,760-2,770. On the other hand, level of support is at around 2,735, marked by last week's Tuesday's local low. The futures contract retraces most of its last week's rebound, as we can see on the 15-minute chart:
Nasdaq Below Last Week's Low
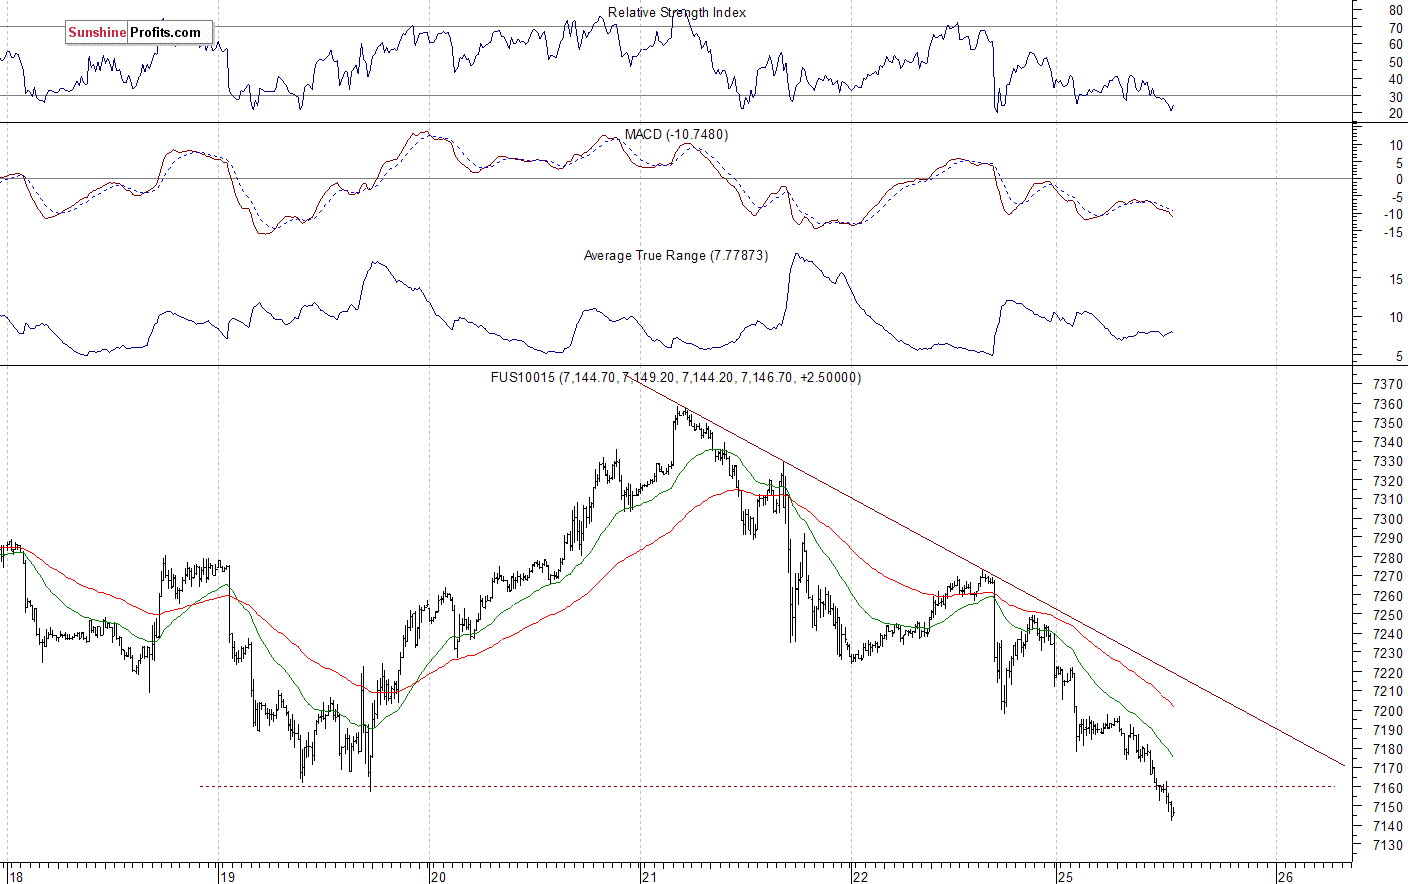
The technology Nasdaq 100 futures contract follows a similar path, as it continues lower following an overnight decline. It retraced all of its rally off last week's Tuesday's low. The Nasdaq 100 lost more than 200 points from the Thursday's overnight new record high of around 7,360. Will it continue lower this time? The nearest important level of support is at around 7,080-7,100. The support level is also at 7,000-7,050. On the other hand, level of resistance is at around 7,200, among others. The Nasdaq futures contract trades slightly below its last week's low, as the 15-minute chart shows:
Apple, Amazon - Both Went Lower, New Downtrend or Just Correction?
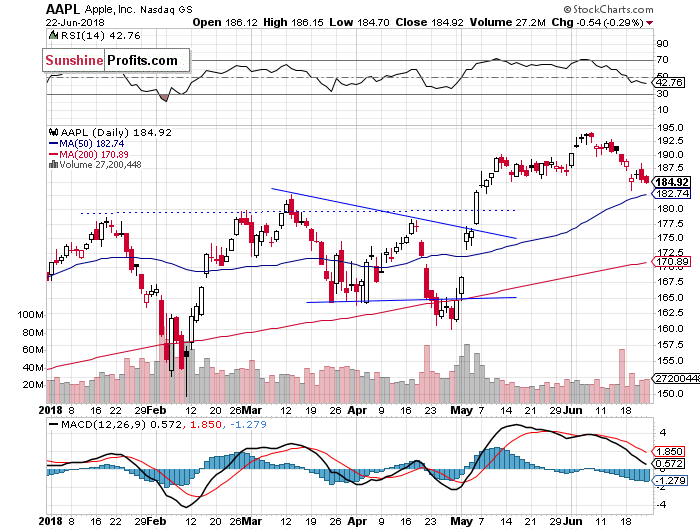
Let's take a look at Apple, Inc. stock (AAPL) daily chart (chart courtesy of http://stockcharts.com). It reached new record high three weeks ago, as it slightly extended its uptrend following a breakout above the price of $190. Then the stock retraced some of its advance, as it fell below $190 again. It continued the short-term downtrend on last week's Tuesday, but then it bounced off support level of around $185, marked by the previous local lows. Will it reverse the decline here? We may see some more short-term fluctuations:
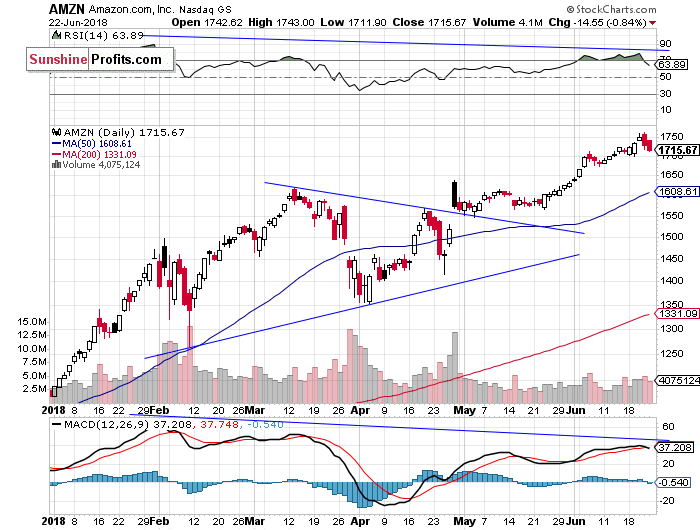
Now let's take a look at Amazon.com, Inc. stock (AMZN) daily chart. It reached the new record high on Thursday, as it was relatively much stronger than the broad stock market. Then it retraced most of its recent advance on Friday. So we may see a downward correction following the recent bull-run. The nearest important level of support is at around $1,670-1,700. We still can see some negative technical divergences:
Dow Jones Closer to Late May Local Lows
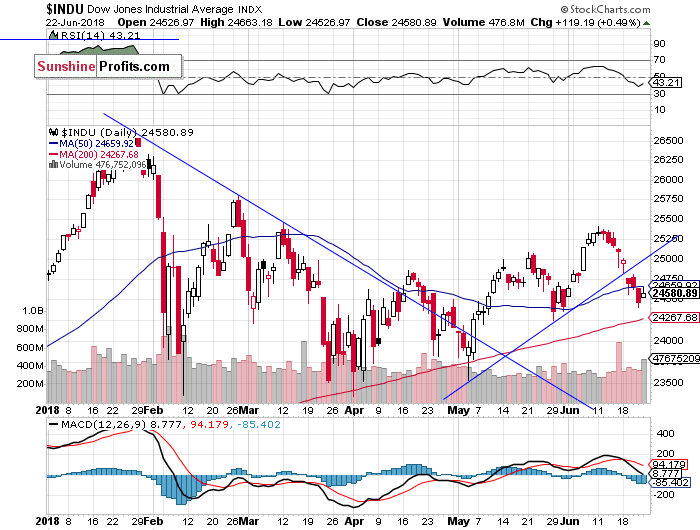
The Dow Jones Industrial Average broke below its two-month-long upward trend line on Tuesday. Then it continued lower, as it fell below the level of 24,500 on Thursday. For now, it looks like some more medium-term sideways price action. However, if DJIA breaks below the support level of around 24,250-24,500, we could see more selling pressure:
The S&P 500 index is expected to open lower today following the global stock markets' overnight weakness. Will the recent downtrend resume? If the index breaks below the support level of around 2,740-2,750, we could see some more selling pressure. For now it looks like a downward correction within a medium-term uptrend.
Concluding, the broad stock market will likely open lower today. We may see some more uncertainty, as the S&P 500 index continues to trade below the important resistance level of around 2,780-2,800. If the index breaks below the support level of around 2,740-2,750, it could continue towards the level of 2,700-2,720.
If you enjoyed the above analysis and would like to receive free follow-ups, we encourage you to sign up for our daily newsletter – it’s free and if you don’t like it, you can unsubscribe with just 2 clicks. If you sign up today, you’ll also get 7 days of free access to our premium daily Gold & Silver Trading Alerts. Sign up today!
Thank you.
Paul Rejczak
Stock Trading Strategist
Stock Trading Alerts
Sunshine Profits - Free Stock Market Analysis
