

Briefly: In our opinion no speculative positions in gold, silver and mining stocks are currently justified from the risk/reward point of view.
Once again not much happened in the precious metals sector yesterday and the only short-term development that was rather significant is that mining stocks moved a bit higher and the volume that accompanied this upswing was once again low – the bearish signal from the previous daily rally was just repeated. Another important thing was gold’s (lack of) reaction to the seemingly bullish news from the Bank of England. Naturally, the rate cut is a bullish factor for gold in the long run, but the lack of real reaction to it is a bearish sign. Both signals, however, were not significant enough to make the short-term outlook very bearish.
There is one (key) thing that very strongly suggests that a big and volatile drop in precious metals prices is just around the corner. We discussed this pattern in greater detail in July, but since many weeks have passed, it’s worth commenting on it again – especially that it continues to be in place and what happened recently seems to confirm it even more. Let’s take a closer look at the chart that we featured back in July (charts courtesy of http://stockcharts.com and chartsrus.com).
Back in July we wrote the following:
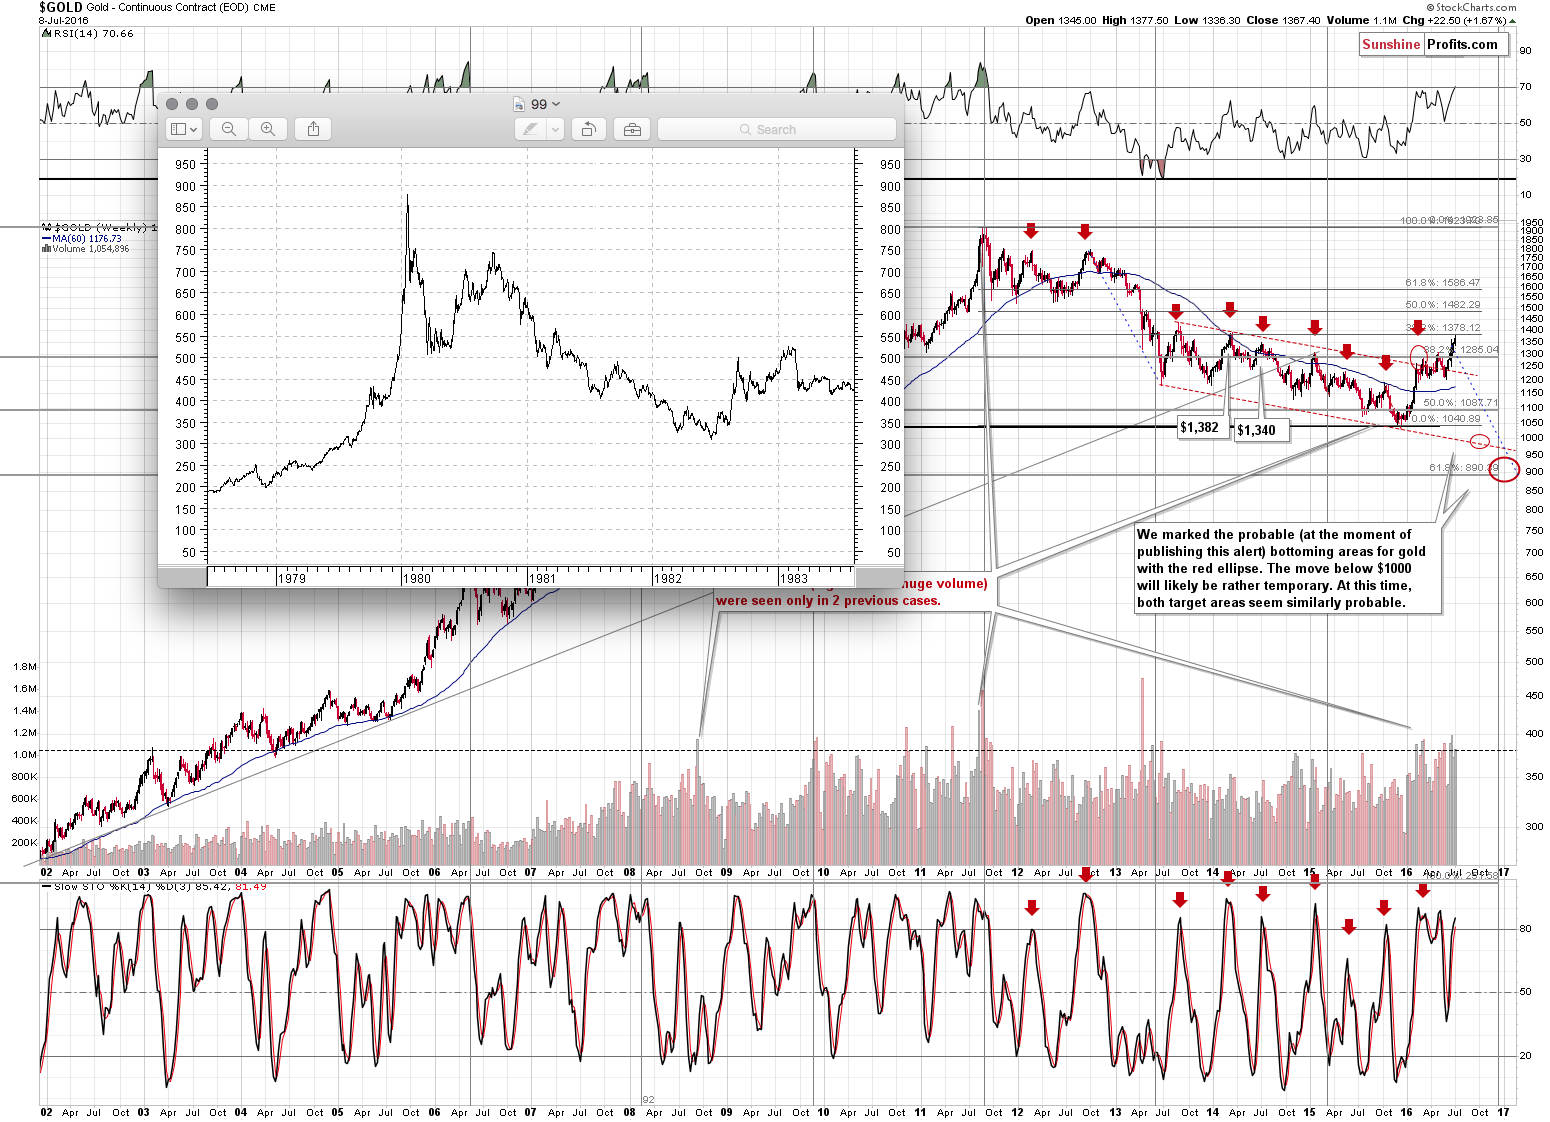
(...) let us re-emphasize that gold tends to repeat its price moves. At times it does it to the letter, but in most cases it is the shape of the move that matters the most. This self-similarity pattern phenomenon can provide a roadmap of the following events – if we detect that we have one that is (Fractalyzer does that automatically, but some things can be also detected manually). There are multiple similarities in the pattern: the parabolic upswing, the 2 tops that followed it, the initial big decline after a breakdown below the initial low, followed by a less steep decline. In both cases after the “final” bottom, the initial rally was very sharp, then we saw some sideways movement and then an additional rally a bit above the previous high.
The above makes the 2 cases very similar already, but that’s not all there is to it. Both post-bottom rallies took a little more than 6 months before the decline resumed. How high did gold rally initially in both cases? More or less to the first visible local high.
The pattern is from the end of the previous bull market (1980 top) and what followed it and while we don’t think the bull market is completely over this time, the emotions that accompanied investors in 1980 are similar to those at the 2011 top. Consequently, there are good reasons to think that the price patterns after these tops can be similar.
What does the similarity mean? That the price pattern is likely to continue, so the follow-up action in the price pattern from the past can tell us a lot about what’s likely to follow.
What is likely to happen next? The same thing – or something very similar to it – that happened in the past after this pattern. In the past, gold rallied only a little above the previous high (the one that formed after the initial sharp rally) and then it topped. After that gold moved to new lows.
We already wrote that back then the rally was in place for a bit above 6 months and the same is the case right now. Consequently, the time may be up for the rally. To be clear, since the entire pattern is very similar but not identical, it could be the case that gold doesn’t decline for another month or so and it would not invalidate the pattern or make the subsequent decline less likely based on it. Overall, the time requirement for the top to be in, is fulfilled.
What about the price? In the past gold moved more or less to the 38.2% Fibonacci retracement level based on the decline and gold is very close to this level also this time. Besides, the second and final top took form above the lowest of the previous local tops, but below the highest local top. That’s where gold is right now as well. Moreover, even if gold rallies a bit more from here, it will still remain within the above pattern.
So, what are the implications of the above? The clear implication is that gold is likely to decline (if not right away, then still rather soon) and the decline is quite likely to take gold to new lows.
Last week, gold moved to the 38.2% Fibonacci retracement based on the entire decline. Consequently, not only does the time requirement seem to be fulfilled, but the same goes for price. Let’s keep in mind that gold moved a few dollars above the retracement before topping, so even a move to $1,400 or so would not invalidate the above. Still, such an upswing is not necessary or likely – after all gold topped right at the retracement and there are many indications of extreme optimism among precious metals investors – strong indications that the top is in (or at hand).
The above is up-to-date as gold is once again close to the mentioned 38.2% Fibonacci retracement level. Why are we bringing this topic back today? Because based on the most recent upswing in gold, the current price pattern is even more similar to what happened previously.
Please note how gold topped in early 1983. The top consisted of 3 smaller tops: the initial one (lowest), the second (highest) and the final one that took gold almost to the second top, but ultimately didn’t exceed it.
Now, with the above in mind, let’s take a look what’s gold been doing lately.
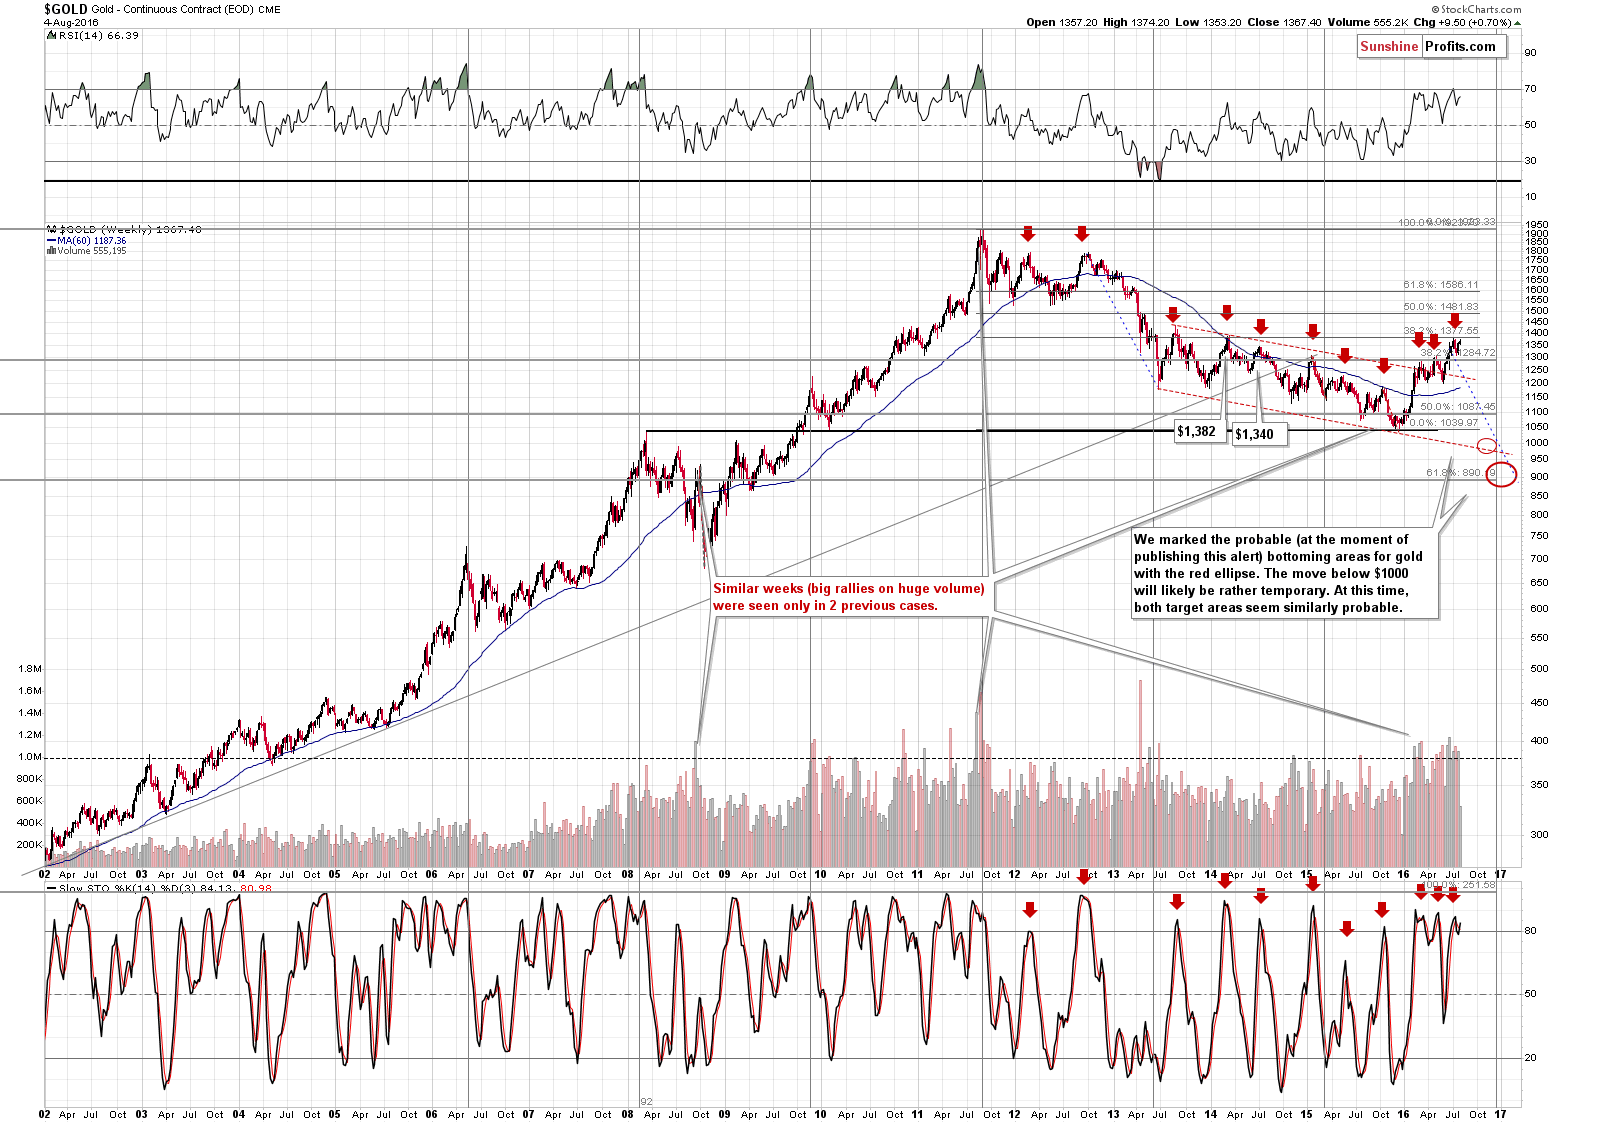
There was an initial top right after the Brexit vote, there was a higher top in early July and right now gold moved very close to the second top, but it didn’t exceed it. This is exactly what happened right before the major plunge in 1983.
How far did gold decline in 1983 after the top? It finally moved to new lows, but initially it declined more or less to the previous local bottom and applying this to the current situation provides us with $1,200 as the initial target (over $150 lower than the current gold price).
Without a few additional short-term bearish confirmations opening speculative short positions seems too risky, but based on the above analogy it is something that we should be planning to do once these confirmations are seen.
Summing up, the analogy to the very bearish pattern of 1980 – 1983 remains in place and based on it we should be preparing for opening short positions in the precious metals sector. We plan do so once we see more bearish confirmations. Until that time, it seems that staying on the sidelines with the speculative capital is justified from the risk to reward point of view.
As always, we will keep you – our subscribers – updated.
To summarize:
Trading capital (supplementary part of the portfolio; our opinion): No positions
Long-term capital (core part of the portfolio; our opinion): No positions
Insurance capital (core part of the portfolio; our opinion): Full position
Plus, you might want to read why our stop-loss orders are usually relatively far from the current price.
Please note that a full position doesn’t mean using all of the capital for a given trade. You will find details on our thoughts on gold portfolio structuring in the Key Insights section on our website.
As a reminder – “initial target price” means exactly that – an “initial” one, it’s not a price level at which we suggest closing positions. If this becomes the case (like it did in the previous trade) we will refer to these levels as levels of exit orders (exactly as we’ve done previously). Stop-loss levels, however, are naturally not “initial”, but something that, in our opinion, might be entered as an order.
Since it is impossible to synchronize target prices and stop-loss levels for all the ETFs and ETNs with the main markets that we provide these levels for (gold, silver and mining stocks – the GDX ETF), the stop-loss levels and target prices for other ETNs and ETF (among other: UGLD, DGLD, USLV, DSLV, NUGT, DUST, JNUG, JDST) are provided as supplementary, and not as “final”. This means that if a stop-loss or a target level is reached for any of the “additional instruments” (DGLD for instance), but not for the “main instrument” (gold in this case), we will view positions in both gold and DGLD as still open and the stop-loss for DGLD would have to be moved lower. On the other hand, if gold moves to a stop-loss level but DGLD doesn’t, then we will view both positions (in gold and DGLD) as closed. In other words, since it’s not possible to be 100% certain that each related instrument moves to a given level when the underlying instrument does, we can’t provide levels that would be binding. The levels that we do provide are our best estimate of the levels that will correspond to the levels in the underlying assets, but it will be the underlying assets that one will need to focus on regarding the signs pointing to closing a given position or keeping it open. We might adjust the levels in the “additional instruments” without adjusting the levels in the “main instruments”, which will simply mean that we have improved our estimation of these levels, not that we changed our outlook on the markets. We are already working on a tool that would update these levels on a daily basis for the most popular ETFs, ETNs and individual mining stocks.
Our preferred ways to invest in and to trade gold along with the reasoning can be found in the how to buy gold section. Additionally, our preferred ETFs and ETNs can be found in our Gold & Silver ETF Ranking.
As always, we'll keep you - our subscribers - updated should our views on the market change. We will continue to send out Gold & Silver Trading Alerts on each trading day and we will send additional Alerts whenever appropriate.
The trading position presented above is the netted version of positions based on subjective signals (opinion) from your Editor, and the Tools and Indicators.
As a reminder, Gold & Silver Trading Alerts are posted before or on each trading day (we usually post them before the opening bell, but we don't promise doing that each day). If there's anything urgent, we will send you an additional small alert before posting the main one.
=====
Latest Free Trading Alerts:
Yesterday, the Bank of England cut its interest rate and introduced a package of measures designed to provide additional monetary stimulus. What does it imply for the gold market?
Bank of England’s Rate Cut and Gold
Britons decided to leave the EU – but why? We invite you to read our today’s article presenting the reasons behind such an outcome and find out why they are important for the gold market.
Why Did Britain Vote to Leave the EU?
U.S. Markit Services PMI remained unchanged at 51.4 in July. What does it mean for the gold market?
July U.S. Markit Services PMI and Gold
S&P 500 index fluctuates following its last month's rally. Is this a relatively flat correction before another leg higher, or some topping pattern? Is holding short position still justified?
Stock Trading Alert: Short-Term Uncertainty As Investors Await Economic Data Releases
=====
Hand-picked precious-metals-related links:
Gold Heads for Second Weekly Advance as Focus Turns to U.S. Jobs
It’s More Expensive To Hold Euros Than Gold – BAML Analyst
=====
In other news:
What to Expect From the Latest Jobs Report
Brexit Bulletin: Carney Rules Out Negative Interest Rates
BoE's Broadbent says would back further cut in rates
Goldman, Gundlach, and Gross Are Worried About the Markets. Time to Get Out?
=====
Thank you.
Sincerely,
Przemyslaw Radomski, CFA
Founder, Editor-in-chief, Gold & Silver Fund Manager
Gold & Silver Trading Alerts
Forex Trading Alerts
Oil Investment Updates
Oil Trading Alerts

