

Briefly: In our opinion speculative short positions (full) in gold and mining stocks are currently justified from the risk/reward point of view.
History often repeats itself and those who don’t know it are risking repeating past behavior regardless of whether it was beneficial or not. Knowing that similar circumstances often lead to similar outcomes can greatly help one avoid unpleasant outcomes, while benefiting from the favorable ones. In case of the capital markets, the above can also mean that similar price patterns and emotions among investors are likely to lead to similar follow-ups as the ones in the past. The trouble is that the patterns are not easy to find. The good news is that it appears we have one in gold right now.
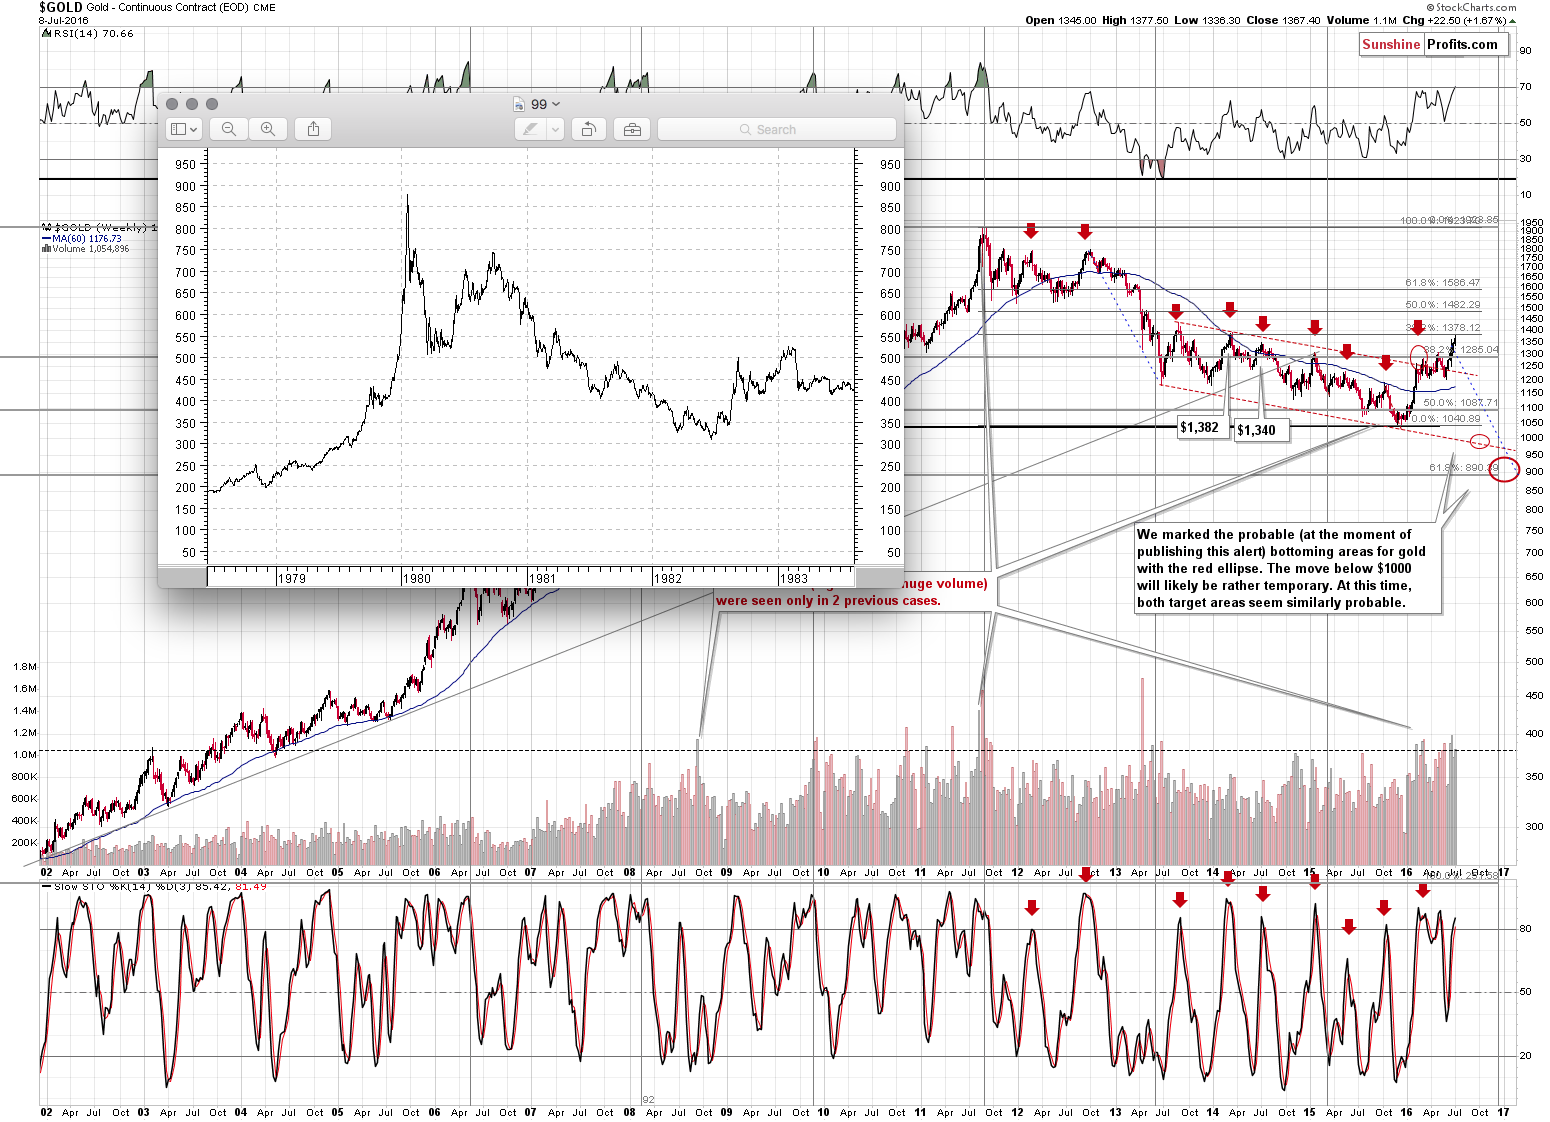
We discussed this pattern last week, but since gold moved higher last week and this pattern is one of the most important issues visible at this time, we’ll discuss it once again. Let’s take a look at gold’s long-term chart (charts courtesy of http://stockcharts.com and http://chartsrus.com).
Last week, we wrote the following about the above chart:
(...) let us re-emphasize that gold tends to repeat its price moves. At times it does it to the letter, but in most cases it is the shape of the move that matters the most. This self-similarity pattern phenomenon can provide a roadmap of the following events – if we detect that we have one that is (Fractalyzer does that automatically, but some things can be also detected manually).
There are multiple similarities in the pattern: the parabolic upswing, the 2 tops that followed it, the initial big decline after a breakdown below the initial low, followed by a less steep decline. In both cases after the “final” bottom, the initial rally was very sharp, then we saw some sideways movement and then an additional rally a bit above the previous high.
The above makes the 2 cases very similar already, but that’s not all there is to it. Both post-bottom rallies took a little move than 6 months before the decline resumed. How high did gold rally initially in both cases? More or less to the first visible local high.
The pattern is from the end of the previous bull market (1980 top) and what followed it and while we don’t think the bull market is completely over this time, the emotions that accompanied investors in 1980 are similar to those at the 2011 top. Consequently, there are good reasons to think that the price patterns after these tops can be similar.
What does the similarity mean? That the price pattern is likely to continue, so the follow-up action in the price pattern from the past can tell us a lot about what’s likely to follow.
What is likely to happen next? The same thing – or something very similar to it – that happened in the past after this pattern. In the past, gold rallied only a little above the previous high (the one that formed after the initial sharp rally) and then it topped. After that gold moved to new lows.
We already wrote that back then the rally was in place for a bit above 6 months and the same is the case right now. Consequently, the time may be up for the rally. To be clear, since the entire pattern is very similar but not identical, it could be the case that gold doesn’t decline for another month or so and it would not invalidate the pattern or make the subsequent decline less likely based on it. Overall, the time requirement for the top to be in, is fulfilled.
What about the price? In the past gold moved more or less to the 38.2% Fibonacci retracement level based on the decline and gold is very close to this level also this time. Besides, the second and final top took form above the lowest of the previous local tops, but below the highest local top. That’s where gold is right now as well. Moreover, even if gold rallies a bit more from here, it will still remain within the above pattern.
So, what are the implications of the above? The clear implication is that gold is likely to decline (if not right away, then still rather soon) and the decline is quite likely to take gold to new lows.
Last week, gold moved to the 38.2% Fibonacci retracement based on the entire decline. Consequently, not only does the time requirement seem to be fulfilled, but the same goes for price. Let’s keep in mind that gold moved a few dollars above the retracement before topping, so even a move to $1,400 or so would not invalidate the above. Still, such an upswing is not necessary or likely – after all gold topped right at the retracement and there are many indications of extreme optimism among precious metals investors – strong indications that the top is in (or at hand).
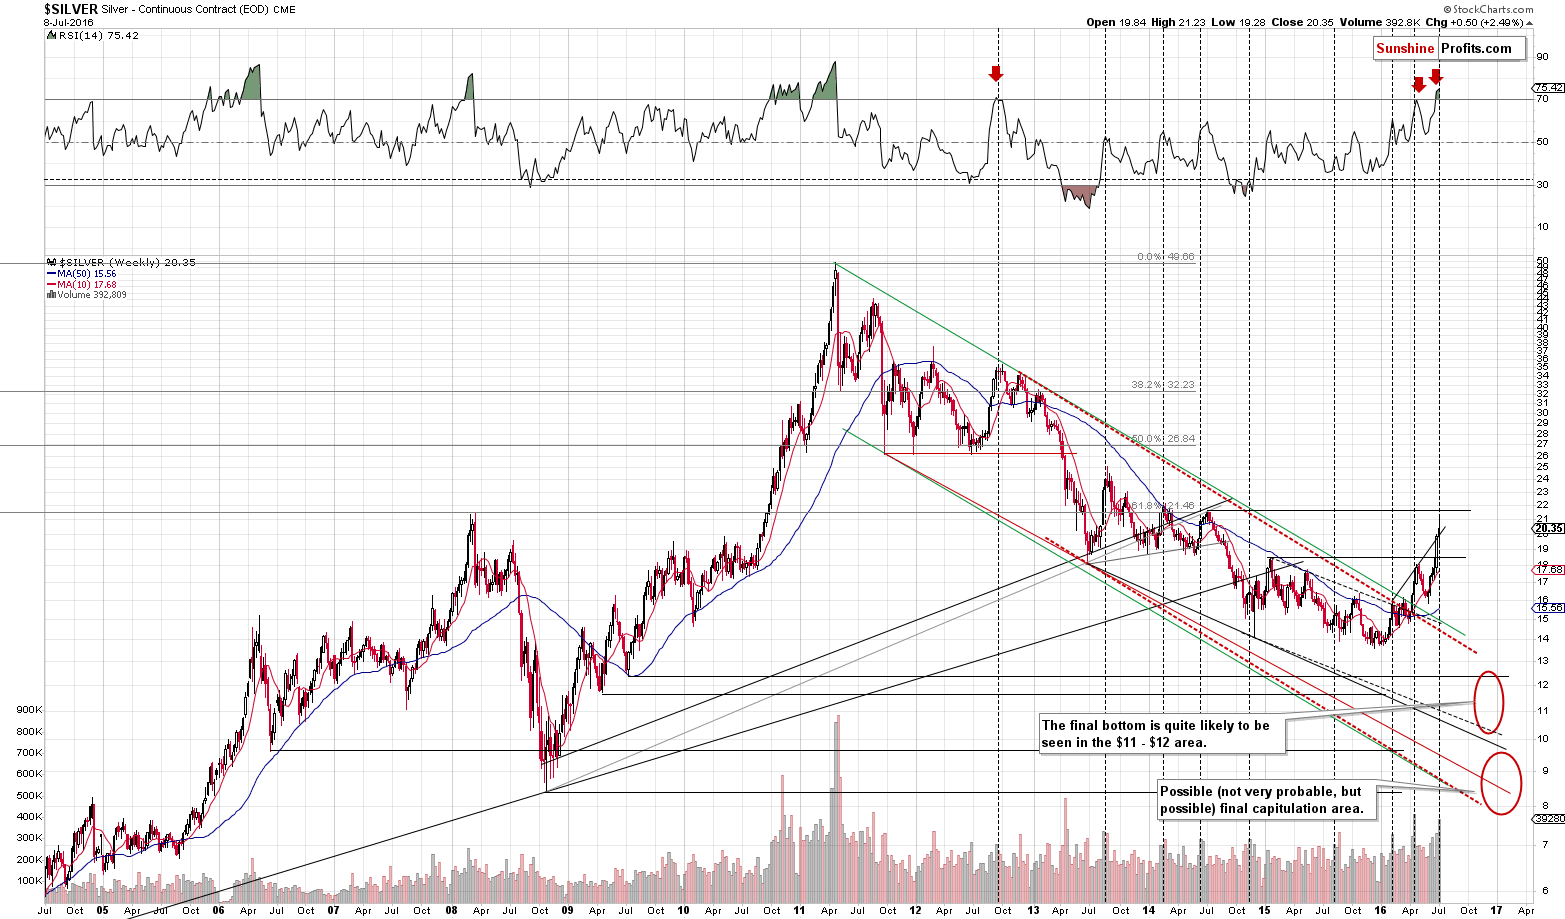
Silver moved higher on an intra-day (and overnight) basis and since silver is known to outperform in the final parts of a given upswing, it’s quite likely that a reversal is not far away. The next resistance level is at $21.63 (mid-2014 high) and since silver topped at $21.23, it could be the case that the rally is over.
Please note that silver’s intra-day moves are still very volatile and today’s pre-market action serves as a good example – silver moved above $20.60 only to slide to $20.20 in a few hours (and the intra-day low was about $19.20 on Friday). It seems that silver is still too volatile to enter a trading position in it.
Before moving to mining stocks, please note that the volume that we saw last week was significant. We marked similar situations with dashed vertical lines – it was usually the case that significant weekly volume was followed by declines either immediately or shortly.
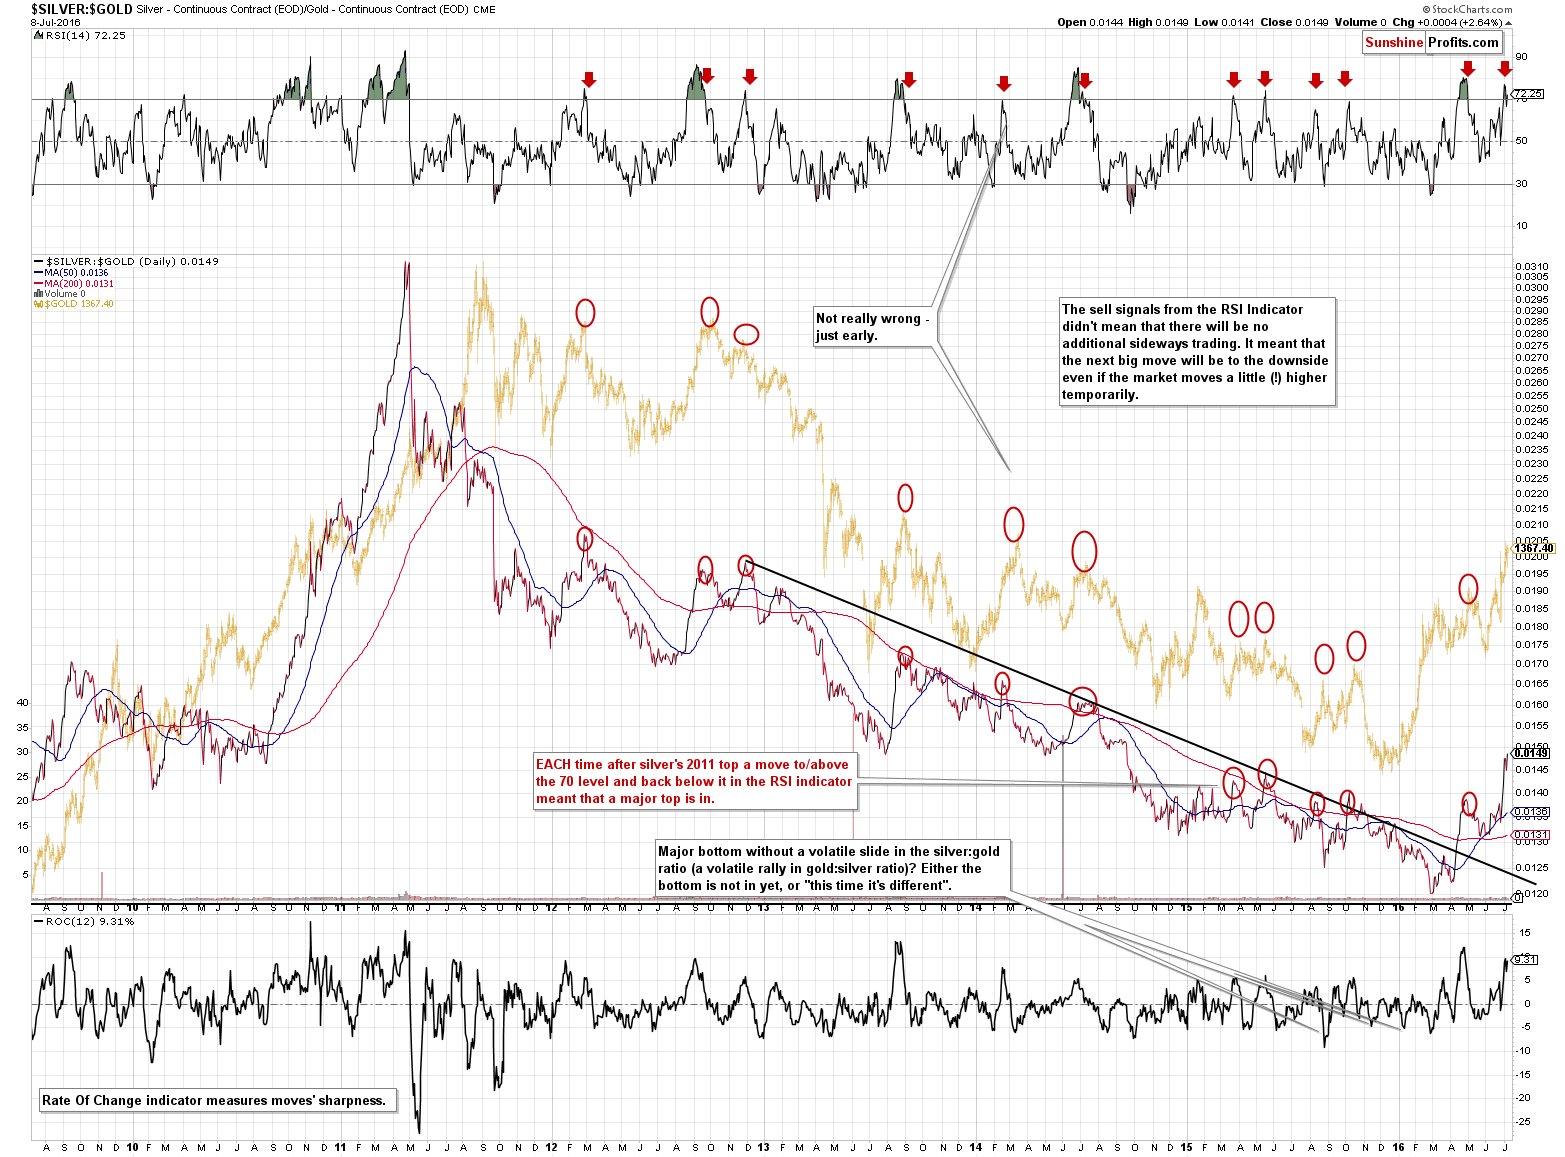
Comparing the price performance of silver vs. gold implies a move lower as well. A strong sell signal is seen when the RSI indicator based on the silver to gold ratio moves back below 70 after being above it. Last week, we saw this development, and the implications are bearish, but since then the ratio has moved above 70 once again. Consequently, we need to be cautious as far as shorting the silver market is concerned, as the white metal can move higher on a very short-term basis only to slide shortly thereafter.
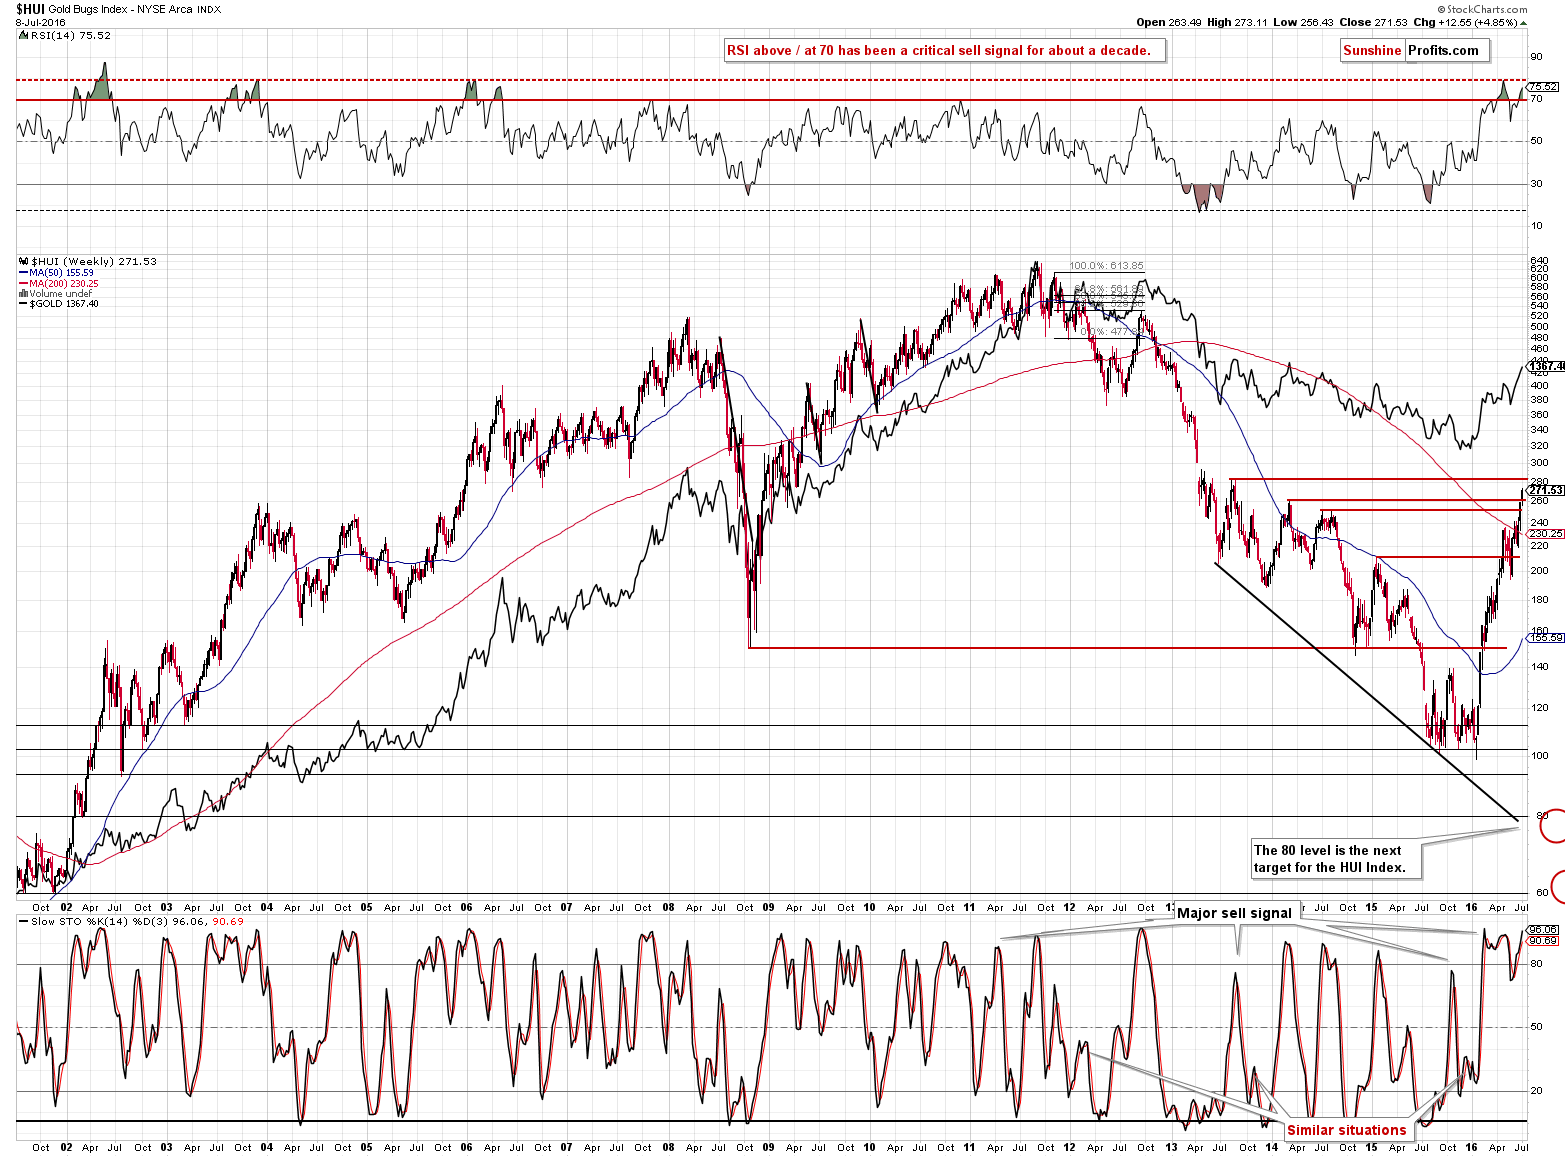
Gold miners moved above one resistance last week, but are above another one. What’s the likely reason behind the rally?
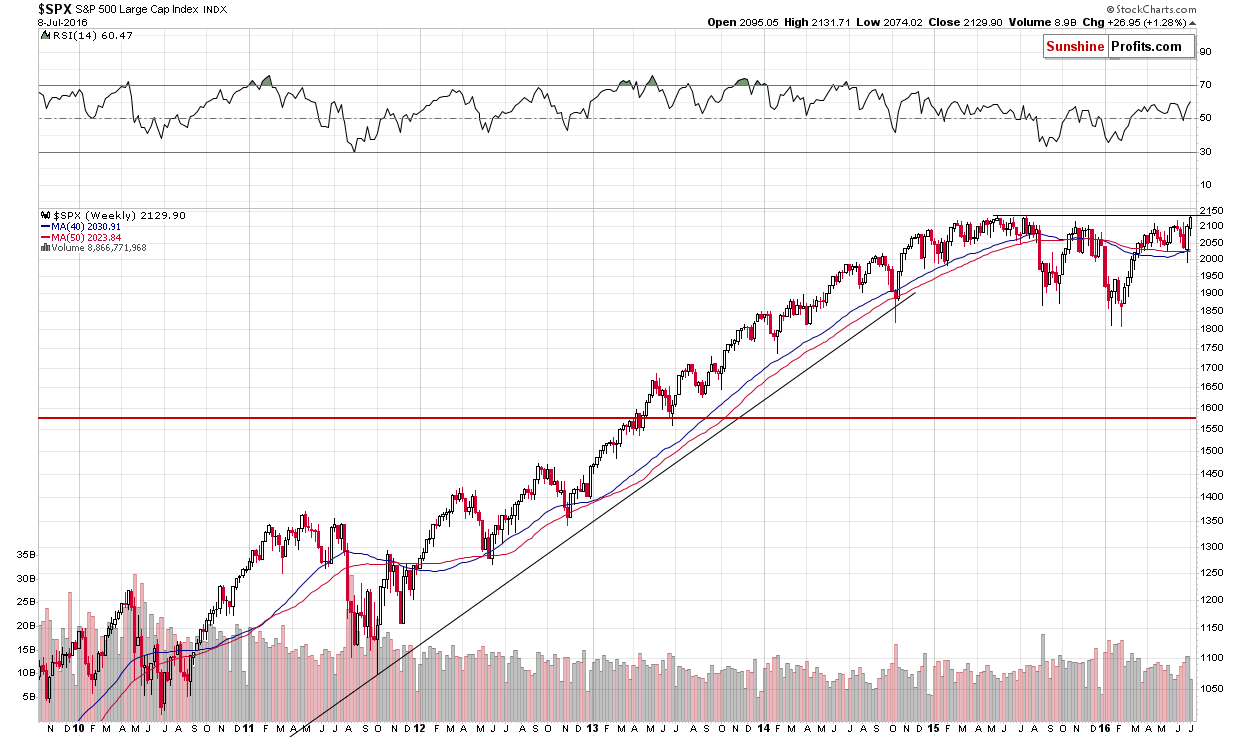
The general stock market moved to its all-time high and miners are positively correlated with it. It was quite likely the case that miners got a boost from the rallying stocks and it seems that stocks could drag miners lower in the coming days as well. Stocks rallied but the weekly volume was low and it makes a breakout above this very important resistance level unlikely.
Besides, gold miners are extremely overbought right now as indicated by the Gold Miners Bullish Percent Index.
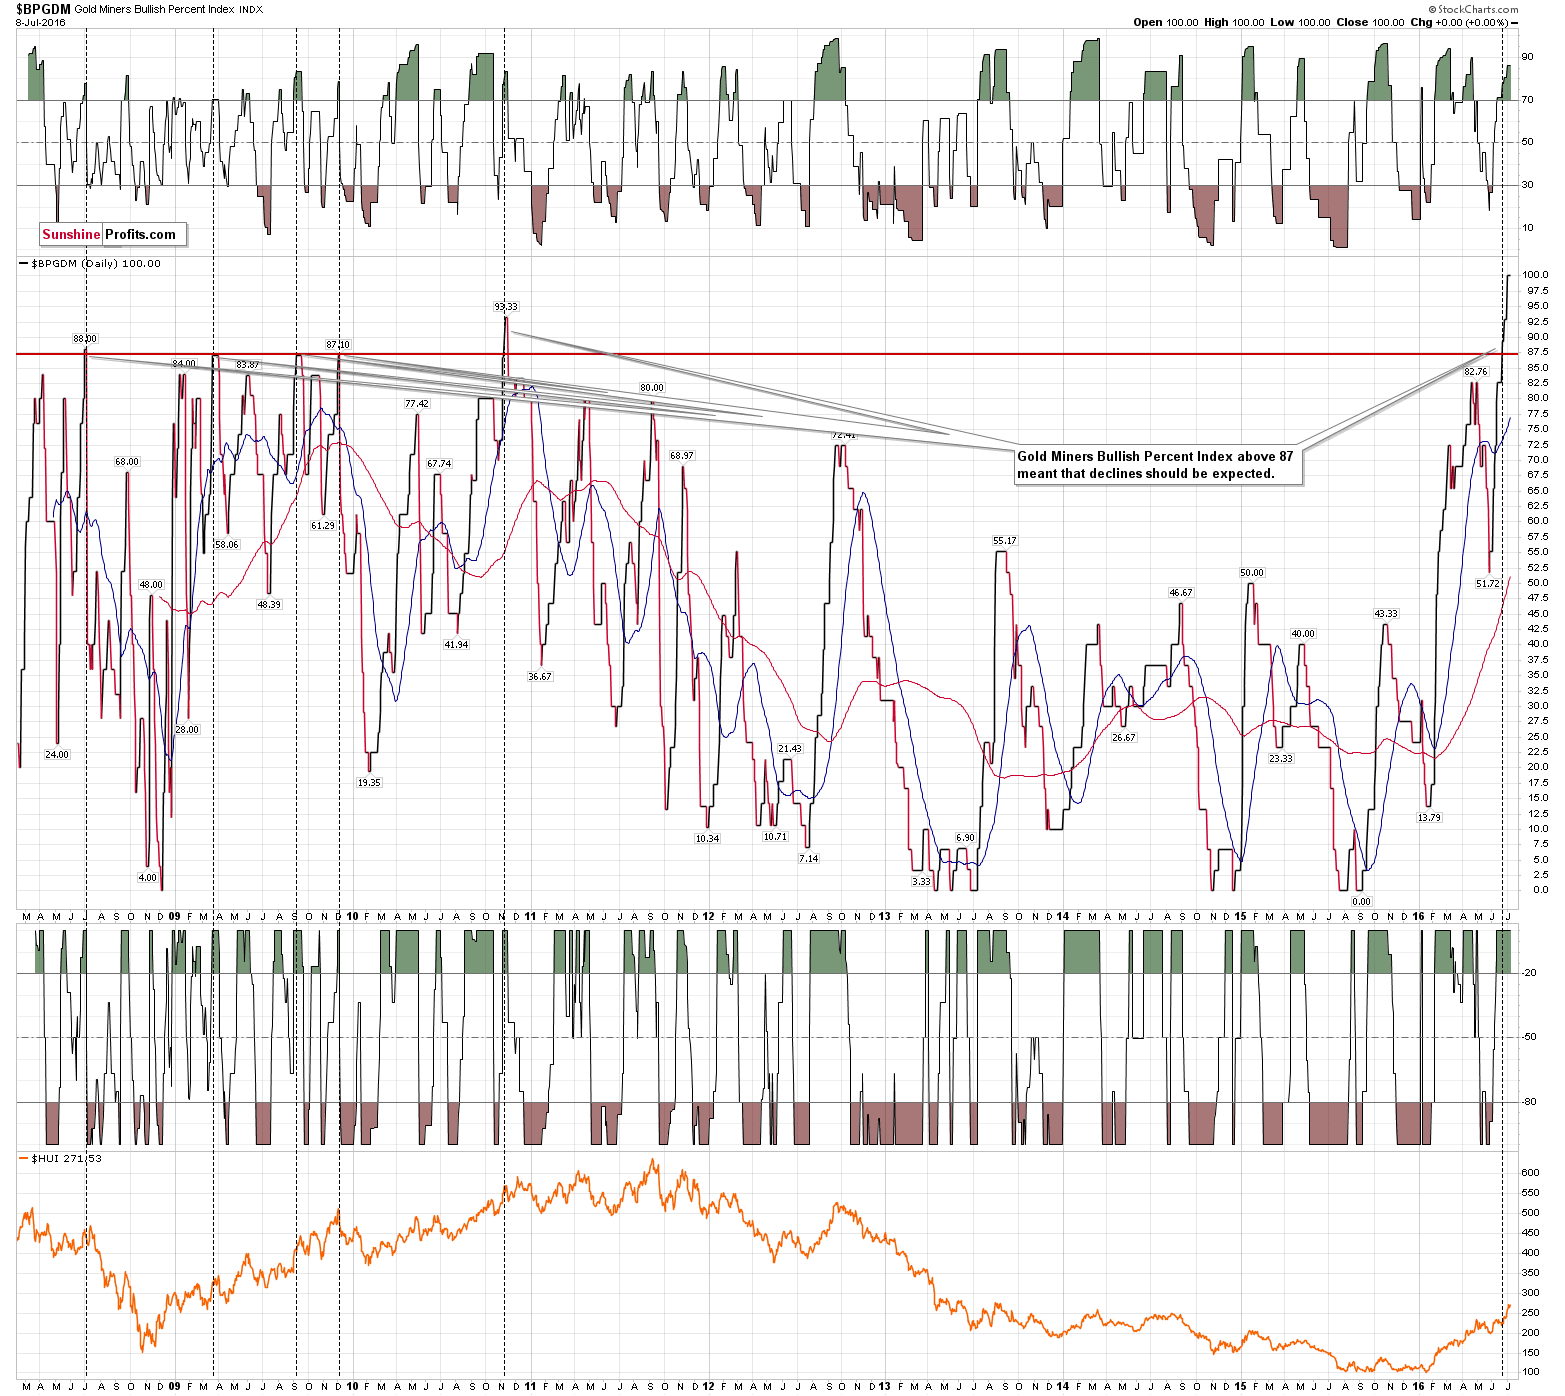
The Gold Miners Bullish Percent Index hit 100 last week, which is an extreme reading and the ultimate high. It shows extreme optimism (just like silver’s outperformance does) and that’s what we see at local tops, not at buying opportunities.
When this index was 0, mining stocks were very close to a local bottom, and the opposite is most likely the case right now.
Summing up, the long-term potential for the precious metals market remains great, but it also appears that this rally is already at or moving close to its end. Gold reaching its key 38.2% Fibonacci retracement level is bearish on its own and it’s even more bearish when we take into account the analogy to what happened in 1982 and 1983. Moreover, the extreme reading in the Gold Miners Bullish Percent Index and silver’s price performance show extreme optimism among precious metals investors (plus gold is making the headlines) and these are the times when one should be fearful, not extremely optimistic. No market can move in a straight line and gold is no exception. The similarity between the current situation and the very similar price pattern from 1982 points to lower precious metals prices in the coming months as well.
As always, we will keep you – our subscribers – updated.
To summarize:
Trading capital (our opinion): Short positions (full position) in gold and mining stocks are justified from the risk/reward perspective with the following entry prices, stop-loss orders and initial target price levels:
- Gold: initial target price: $1,006; stop-loss: $1,423, initial target price for the DGLD ETN: $86.30; stop-loss for the DGLD ETN $44.35
- Silver: No position at this time
- Mining stocks (price levels for the GDX ETF): initial target price: $9.34; stop-loss: $30.77, initial target price for the DUST ETF: $47.90; stop-loss for the DUST ETF $3.62
In case one wants to bet on junior mining stocks' prices (we do not suggest doing so – we think senior mining stocks are more predictable in the case of short-term trades – if one wants to do it anyway, we provide the details), here are the stop-loss details and initial target prices:
- GDXJ ETF: initial target price: $14.13; stop-loss: $50.70
- JDST ETF: initial target price: $61.74; stop-loss: $1.97
Long-term capital (our opinion): No positions
Insurance capital (our opinion): Full position
Plus, you might want to read why our stop-loss orders are usually relatively far from the current price.
Please note that a full position doesn’t mean using all of the capital for a given trade. You will find details on our thoughts on gold portfolio structuring in the Key Insights section on our website.
As a reminder – “initial target price” means exactly that – an “initial” one, it’s not a price level at which we suggest closing positions. If this becomes the case (like it did in the previous trade) we will refer to these levels as levels of exit orders (exactly as we’ve done previously). Stop-loss levels, however, are naturally not “initial”, but something that, in our opinion, might be entered as an order.
Since it is impossible to synchronize target prices and stop-loss levels for all the ETFs and ETNs with the main markets that we provide these levels for (gold, silver and mining stocks – the GDX ETF), the stop-loss levels and target prices for other ETNs and ETF (among other: UGLD, DGLD, USLV, DSLV, NUGT, DUST, JNUG, JDST) are provided as supplementary, and not as “final”. This means that if a stop-loss or a target level is reached for any of the “additional instruments” (DGLD for instance), but not for the “main instrument” (gold in this case), we will view positions in both gold and DGLD as still open and the stop-loss for DGLD would have to be moved lower. On the other hand, if gold moves to a stop-loss level but DGLD doesn’t, then we will view both positions (in gold and DGLD) as closed. In other words, since it’s not possible to be 100% certain that each related instrument moves to a given level when the underlying instrument does, we can’t provide levels that would be binding. The levels that we do provide are our best estimate of the levels that will correspond to the levels in the underlying assets, but it will be the underlying assets that one will need to focus on regarding the sings pointing to closing a given position or keeping it open. We might adjust the levels in the “additional instruments” without adjusting the levels in the “main instruments”, which will simply mean that we have improved our estimation of these levels, not that we changed our outlook on the markets. We are already working on a tool that would update these levels on a daily basis for the most popular ETFs, ETNs and individual mining stocks.
Our preferred ways to invest in and to trade gold along with the reasoning can be found in the how to buy gold section. Additionally, our preferred ETFs and ETNs can be found in our Gold & Silver ETF Ranking.
As always, we'll keep you - our subscribers - updated should our views on the market change. We will continue to send out Gold & Silver Trading Alerts on each trading day and we will send additional Alerts whenever appropriate.
The trading position presented above is the netted version of positions based on subjective signals (opinion) from your Editor, and the Tools and Indicators.
As a reminder, Gold & Silver Trading Alerts are posted before or on each trading day (we usually post them before the opening bell, but we don't promise doing that each day). If there's anything urgent, we will send you an additional small alert before posting the main one.
=====
Latest Free Trading Alerts:
The U.S. economy added 287,000 jobs in June. What does it imply for the Fed policy and the gold market?
June Rebound in Payrolls and Gold
S&P 500 index extended its short-term uptrend on Friday, as investors reacted to economic data announcements. Will it break above last year's all-time high? Or is this still medium-term consolidation? Is holding short position justified?
In the previous weeks, crude oil was trapped between the barrier of $50 and the Apr and early May highs. At the same time gold and silver rebounded sharply, hitting fresh 2016 highs. What can we infer from the relationship between gold, silver and light crude about crude oil future’s moves?
Crude Oil – Precious Metals Link
=====
Hand-picked precious-metals-related links:
Gold inches down on steady dollar, rally in stocks
Citi: "Black Gold" a Better Hedge Than Gold
South Africa girding for another platinum strike
=====
In other news:
Global stocks rise as markets anticipate stimulus
Kyle Bass: A top central banker once told me something that he'd never say publicly
Goldman Sachs: Neither stocks nor bonds look good right now
Japan Abe orders new stimulus package after election win
China's weaker June inflation prompts economists to speculate on interest rate cuts
India Stocks Rally to 11-Month High, Poised to Enter Bull Market
=====
Thank you.
Sincerely,
Przemyslaw Radomski, CFA
Founder, Editor-in-chief, Gold & Silver Fund Manager
Gold & Silver Trading Alerts
Forex Trading Alerts
Oil Investment Updates
Oil Trading Alerts

