

Briefly: In our opinion (full) speculative long positions in gold, silver and mining stocks are currently justified from the risk/reward perspective. Getting back on the long side of the precious metals market with half of the long-term investment capital seems justified from the risk/reward perspective.
Yesterday’s alert featured one of the greatest changes in the previous months (there was a change in the long-term investment capital), so before we proceed to our regular analysis, we would like to clarify what why we think it’s a good idea to get back partly in even though it doesn’t seem that the final bottom is in.
Let’s start by stating the obvious – there is no way to tell with 100% certainty if the bottom is in or not, and there never will be. The future will never be crystal clear – it’s not math where you can be certain of a given outcome. Each trading or investment decision is made in an uncertain situation. The odds of correctly estimating the future outcome in the market increase with one’s experience and after conducting research on the matter. However, one will never be able to be 100% certain of a given outcome in any market. In fact thinking otherwise is dangerous as overconfidence will sooner or later translate into too big positions and losing too much capital when it turns out that the “100%” was really a “70%” and that something doesn’t go as planned 3 times out of 10 (on average).
Consequently, when we make a given decision about trading it's in light of an uncertain outcome. The only thing we can ever do is to estimate the odds of a given outcome and then position different parts of the portfolio accordingly.
In our opinion, with the long-term investment capital and given the long-term uptrend and positive fundamental outlook in a given market (precious metals in this case) the risk is to be out of the market (with speculative capital, the risk is to be in the market). In other words - the default state is to be invested and it makes sense to be out of the market only when the outlook is particularly (!) unfavorable (with speculative capital the default state is not to have any position). The first big report that we ever created was dedicated to this issue. You will find a justification of the above approach in this report.
Before today, your Editor viewed the situation as very unfavorable for the precious metals market. Now, we still view it as unfavorable, but not as strongly as previously. In our opinion it’s not unfavorable enough to justify being completely out of the market with the long-term investment capital, even though the final bottom is probably (!) not in just yet.
What’s next? If the medium-term outlook improves as a consequence of breakouts, we will probably move to full investment positions in the precious metals market. From the long-term perspective, we would be buying close to the bottom and well below the prices at which we had exited the long-term investments months ago (thus greatly outperforming the simple buy-and-hold approach).
If we see important signs of weakness after precious metals rally from here, we will probably return to the “no long-term investment” approach (thus we would probably exit at higher prices than the current ones – increasing the profits).
Having said that, let’s take a look at the charts (charts courtesy of http://stockcharts.com). There will be only a few new charts today, as we featured quite a few of them yesterday and they remain up-to-date.
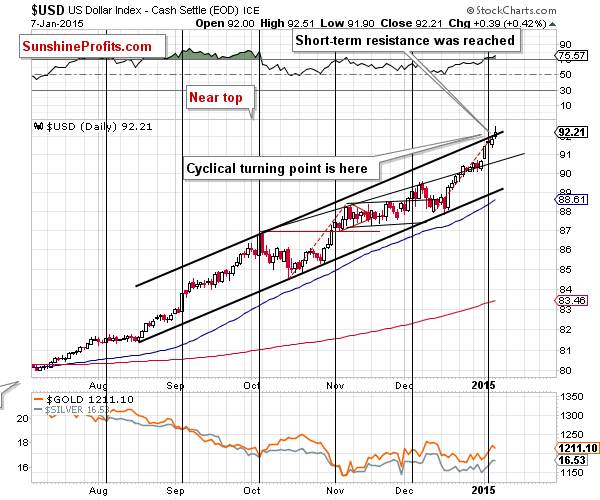
In short, the outlook for the USD Index remains unchanged. Our yesterday’s comments remain up-to-date with an additional note that the rising resistance line was broken only temporarily, so overall we don’t view the breakout as a real and meaningful development:
- The RSI indicator is as overbought as it was in early November 2014, when we saw a local top.
- The cyclical turning point is here and the previous move was definitely up.
- The mid-Dec. rally is just as big as the mid-Oct. – Nov. one, which suggests that this rally may be already over or close to being over.
- We just saw an intra-day reversal.
The above is a bearish combination for the short term.
The combination of both long-term resistance levels was reached [yesterday], which is a bearish factor for the USD Index and a bullish one for the precious metals sector, especially if we consider that metals and miners barely declined yesterday. Let’s keep in mind that this level (92.33 – 92.5) stopped major rallies and declines several times in the past 20 years.
It seems that we will either see a local top in the USD Index very soon or that it’s already in.
Yesterday was yet another day of strength in precious metals. On average, when the USD rallies, the declines in gold are small or nonexistent, and when it just stops to rally, gold rallies. Either way, gold is showing strength. This means that it’s likely to show even greater strength when the USD Index declines.
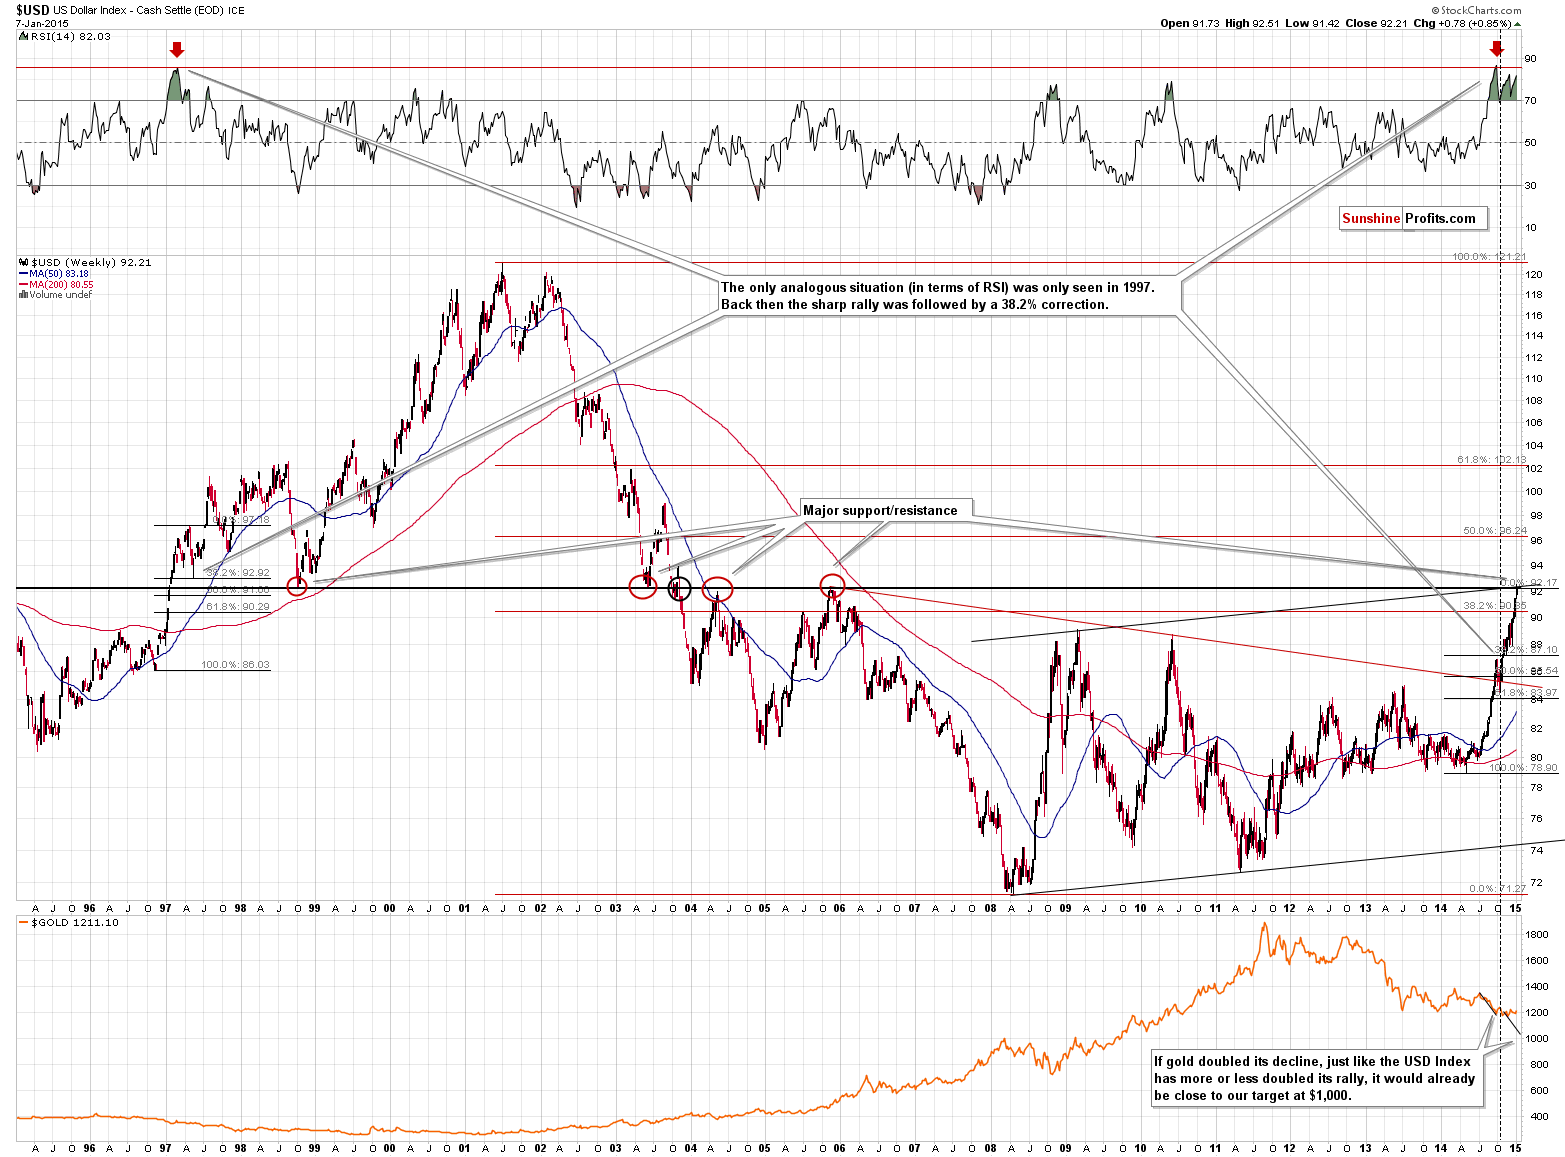
Our yesterday’s comments on the above chart remain up-to-date:
On the above chart we also see that there was only one time when the weekly RSI was as overbought in the past 20 years as it is now – it was in 1997. Back then the USD Index corrected to the first Fibonacci retracement level – 38.2%. If the history repeats itself, we might see a move to 87.10 or so. In other words, the USD Index could slide 5 index points and still remain in a medium-term uptrend. In fact, it could also decline to the 61.8% retracement and remain in an uptrend, but the 38.2% seems to be a more probable target.
Moreover, the above chart clearly shows that gold’s strength is not a one-day or one-week event. It has been refusing to decline more visibly for more or less half of the dollar’s rally.
Additionally, the above gold – USD analogy shows that, in a way, gold “reached” the $1,000 -$1,100 target that we were writing about. If gold hadn’t stopped reacting to the dollar’s strength and had also doubled its previous decline, it would be very close to the $1,000 level. Of course, the price didn’t move as low, but in a way (from the gold-USD link perspective), it’s as likely to move higher as it would be if it had indeed declined as low.
Finally, the above chart shows that getting back on the long side of the precious metals market before today’s session was not justified from the risk/reward perspective. The USD Index was likely to rally which was a major threat to any rally in gold. Consequently, even by buying a bit lower, one would be taking on significant risk. It was likely that big rally in the USD Index would translate into lower gold prices. It turned out that the less likely type of reaction had been seen in the previous several weeks, but that doesn’t mean that betting on the less likely scenario would have been a better choice in the first place – it wouldn’t.
Months ago we wrote that we were waiting to see several things in the precious metals market before saying that getting back on the long side of the market with the long-term investment capital would be a good idea. There were several things to look at, but the HUI moving to its 2008 low, the HUI to gold ratio moving to an important support level (the 2000 low was reached), the juniors sector moving to an important support (the breakdown below the 2008 low was just invalidated) and the USD Index reaching an important long-term resistance were among them. While we have not seen all of them (silver hasn’t underperformed in a major way, the HUI to S&P ratio is not at an important support, and the same goes for the gold stocks to oil stocks ratio, and gold is not extremely hated in the mass media), seeing two major factors (with gold’s strength relative to the USD Index being the most recent development) is enough for the medium-term outlook to improve.
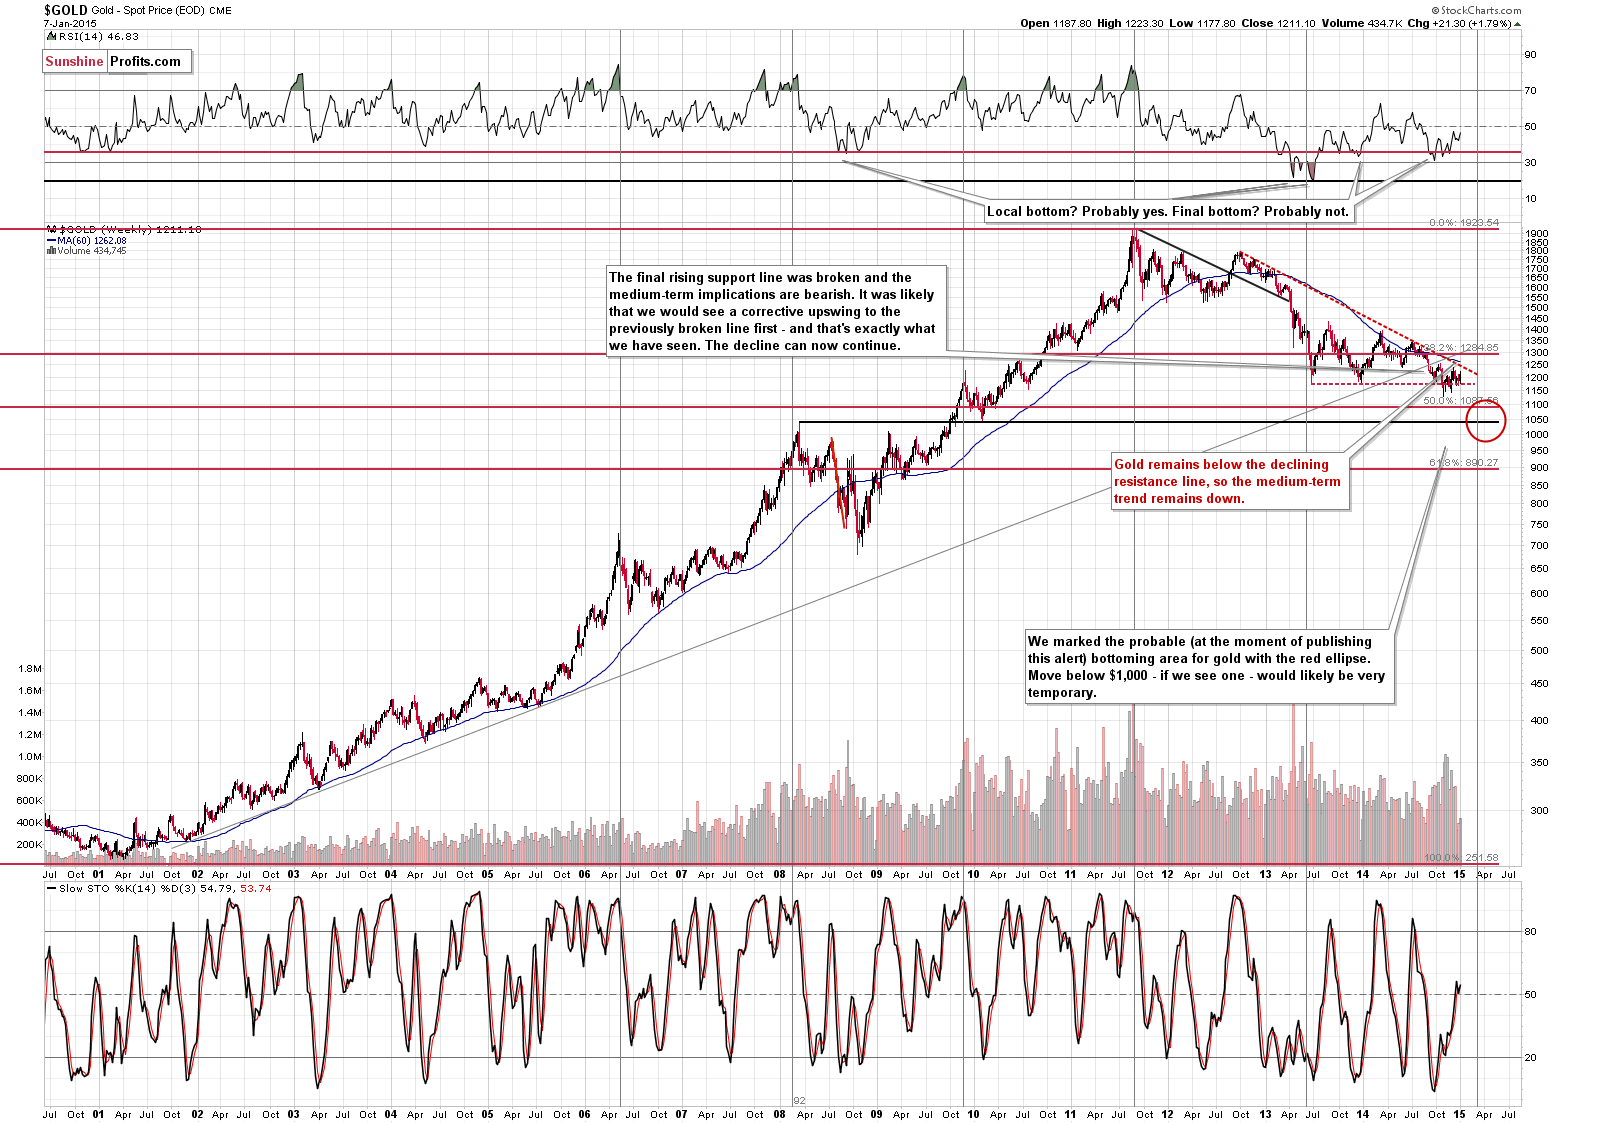
On the long-term gold chart nothing changed and the trend remains down. The declining medium-term resistance line is close to the $1,250 level. Even if this level is broken (it seems likely that it will be the case), the next resistance – the 38.2% Fibonacci retracement or the 2014 highs would be likely to keep the rally in check.
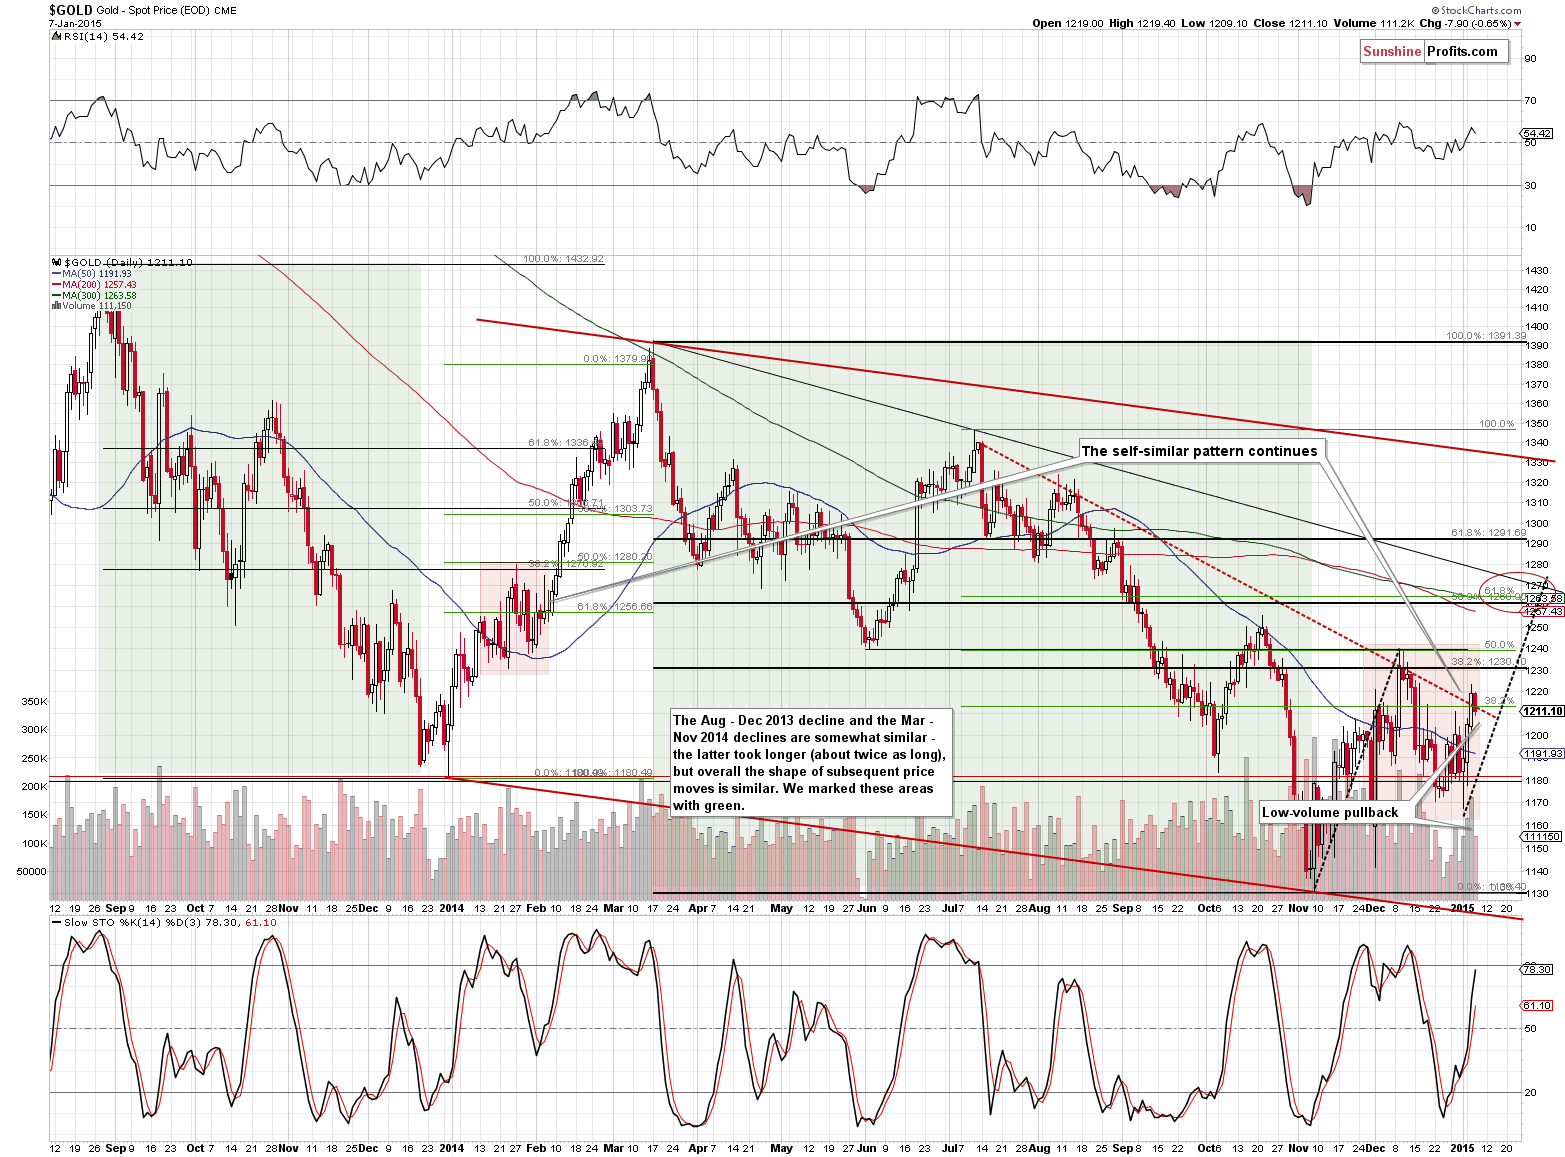
Our yesterday’s comments on the short-term chart remain up-to-date:
(…) In a way (…) gold looks like it’s about to rally as what happened in the areas marked with red rectangles is similar and both red areas follow green areas that are also similar. The more recent decline (green area) took more time than the previous one, so it’s no wonder that the post-decline consolidation took more time as well. Please note that in both cases we saw gold declining initially around the 50-day moving average, then rallying some more (above the previous high) and then a decline that didn’t take gold below the first local low. In Feb 2014, gold rallied shortly thereafter. Consequently, the implications are bullish.
How high could gold go? Probably at least to the previous local top, close to the $1,250 level, which is also where the declining medium-term resistance line is.
On the above chart we marked another – more probable – target price. The red ellipse points to targets around the $1,260 - 1,270 range.
Still, that’s just our initial target. Much will depend on the way gold reacts to the dollar’s decline and the way gold stocks react to gold’s performance – we will be monitoring the situation.
Please note that gold moved just a little lower yesterday and the decline took place on relatively low volume – it seems to be a pause within a short-term rally. We can say the same about yesterday’s price action in silver and mining stocks – it seems to be a pause.
Speaking of mining stocks, yesterday we wrote that the junior mining stocks had moved back above their 2008 low.
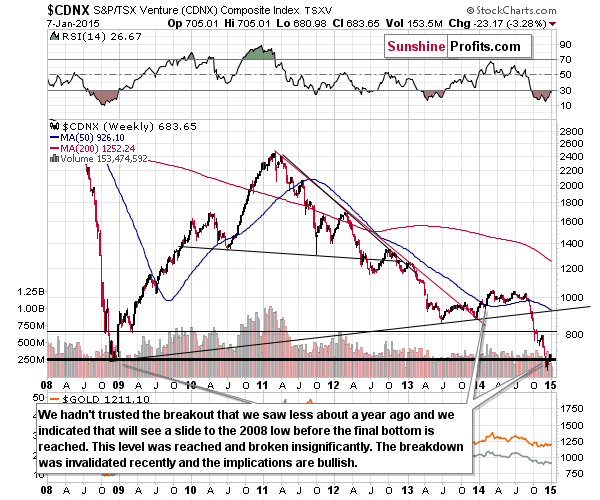
The breakdown below the 2008 low was a significant event, but the invalidation of the breakdown is just as significant. At this time, however, the implications are bullish.
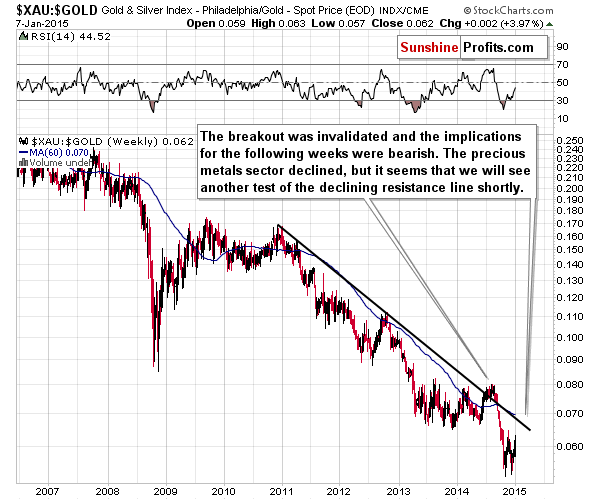
The final chart for today features the XAU to gold ratio. This chart shows that we are likely to see a short-term rally (the ratio is already moving higher and the resistance line has not been reached), but at the same time the trend remains down.
All in all, we can summarize the situation in the same way as we did yesterday:
Summing up, gold’s and mining stocks’ strength (another day proving it) combined with the likelihood of a relatively big corrective downswing in the USD Index made the situation more bullish not only from the short-term perspective, but also from the medium-term one. The trends in gold, silver and mining stocks remain down, so we are likely to see even lower values of precious metals and mining stocks. However, the odds that this will not be the case have increased. Does the risk/reward ratio still favor staying completely out of the precious metals market with the long-term investment capital? While it’s tempting to aim for buying back exactly at the bottom or extremely close to it, the prudent answer to this questions is “no”. The odds that this rally will become something bigger than just a corrective upswing are too high at this time (we subjectively guesstimate these odds at about 40%). Not everything is in place, but enough happened (or is about to happen, like the likely top in the USD Index) to [be] in with half of the long-term investment capital.
To summarize:
Trading capital (our opinion):
It seems that having speculative (full) long positions in gold, silver and mining stocks is a good idea:
- Gold: initial target level: $1,277; stop-loss: $1,179, initial target level for the UGLD ETN: $ 14.00; stop loss for the UGLD ETN $11.10
- Silver: initial target level: $17.46 ; stop-loss: $15.44, initial target level for the USLV ETN: $25.69 ; stop loss for USLV ETN $17.91
- Mining stocks (price levels for the GDX ETN): initial target level: $21.46 ; stop-loss: $18.38 , initial target level for the NUGT ETN: $17.14 ; stop loss for the NUGT ETN $10.93
In case one wants to bet on lower junior mining stocks' prices, here are the stop-loss details and initial target prices:
- GDXJ: initial target level: $28.96 ; stop-loss: $23.87
- JNUG: initial target level: $42.46 ; stop-loss: $23.84
Long-term capital (our opinion): Half positions in gold, half positions in silver, half position in platinum and half position in mining stocks.
We continue to favor senior mining stocks over junior mining stocks, but this will likely change relatively soon as the SP Junior Long Term Indicator is already below the lower of the signal lines and as soon as it turns back up, we will see a “move from seniors to juniors” signal. As far as senior gold stocks and silver stocks selection is concerned for speculative and long-term investment purposes, we continue to view our tools: Golden StockPicker and Silver StockPicker as the optimal way of choosing them.
Insurance capital (our opinion): Full position
Please note that a full position doesn’t mean using all of the capital for a given trade. You will find details on our thoughts on gold portfolio structuring in the Key Insights section on our website.
As a reminder – “initial target price” means exactly that – an “initial” one, it’s not a price level at which we suggest closing positions. If this becomes the case (like it did in the previous trade) we will refer to these levels as levels of exit orders (exactly as we’ve done previously). Stop-loss levels, however, are naturally not “initial”, but something that, in our opinion, might be entered as an order.
Since it is impossible to synchronize target prices and stop-loss levels for all the ETFs and ETNs with the main markets that we provide these levels for (gold, silver and mining stocks – the GDX ETF), the stop-loss levels and target prices for other ETNs and ETF (among other: UGLD, DGLD, USLV, DSLV, NUGT, DUST, JNUG, JDST) are provided as supplementary, and not as “final”. This means that if a stop-loss or a target level is reached for any of the “additional instruments” (DGLD for instance), but not for the “main instrument” (gold in this case), we will view positions in both gold and DGLD as still open and the stop-loss for DGLD would have to be moved lower. On the other hand, if gold moves to a stop-loss level but DGLD doesn’t, then we will view both positions (in gold and DGLD) as closed. In other words, since it’s not possible to be 100% certain that each related instrument moves to a given level when the underlying instrument does, we can’t provide levels that would be binding. The levels that we do provide are our best estimate of the levels that will correspond to the levels in the underlying assets, but it will be the underlying assets that one will need to focus on regarding the sings pointing to closing a given position or keeping it open. We might adjust the levels in the “additional instruments” without adjusting the levels in the “main instruments”, which will simply mean that we have improved our estimation of these levels, not that we changed our outlook on the markets. We are already working on a tool that would update these levels on a daily basis for the most popular ETFs, ETNs and individual mining stocks.
Our preferred ways to invest in and to trade gold along with the reasoning can be found in the how to buy gold section. Additionally, our preferred ETFs and ETNs can be found in our Gold & Silver ETF Ranking.
As always, we'll keep you - our subscribers - updated should our views on the market change. We will continue to send out Gold & Silver Trading Alerts on each trading day and we will send additional Alerts whenever appropriate.
The trading position presented above is the netted version of positions based on subjective signals (opinion) from your Editor, and the automated tools (SP Indicators and the upcoming self-similarity-based tool).
As a reminder, Gold & Silver Trading Alerts are posted before or on each trading day (we usually post them before the opening bell, but we don't promise doing that each day). If there's anything urgent, we will send you an additional small alert before posting the main one.
=====
Latest Free Trading Alerts:
Earlier today, the Australian Bureau of Statistics reported that building approvals increased by 7.5% in November, beating expectations for a 3.5% decline. Thanks to these bullish numbers, AUD/USD bounced off yesterday’s low and climbed above its major resistance line once again. Will we see further rally?
Forex Trading Alert: AUD/USD – Third Time Lucky?
S&P 500 index rebounded following recent move down. Is this a short-term downtrend reversal or just an upward correction?
Stock Trading Alert: Stocks Regain Some Ground After Recent Move Down
=====
Hand-picked precious-metals-related links:
Gold price in 2015: Playing Russian roulette
PRECIOUS-Gold falls further as SPDR fund holdings hit fresh 6-year low
=====
In other news:
Fed looks past a world in turmoil, confident in U.S. recovery
Are bond yields flashing a panic signal?
Why the ECB Won’t Hold a Monthly Monetary-Policy Meeting Today
ECB wants new Greek government to quickly reach deal with creditors: paper
Euro zone deflation fears may be overblown
Bill Ackman: Herbalife is like Bernie Madoff
Paris Attack Underscores a Deeper Malaise
=====
Thank you.
Sincerely,
Przemyslaw Radomski, CFA
Founder, Editor-in-chief
Gold & Silver Trading Alerts
Forex Trading Alerts
Oil Investment Updates
Oil Trading Alerts

