
In short: No changes: small (half) short position in gold, silver, and mining stocks.
The week ended without significant changes on Friday, so what we wrote based on Thursday’s closing prices remains up-to-date. We will, however, provide updated charts to illustrate the situation and emphasize the direction in which the precious metals market is likely to move. Let’s start with gold (charts courtesy of http://stockcharts.com.)
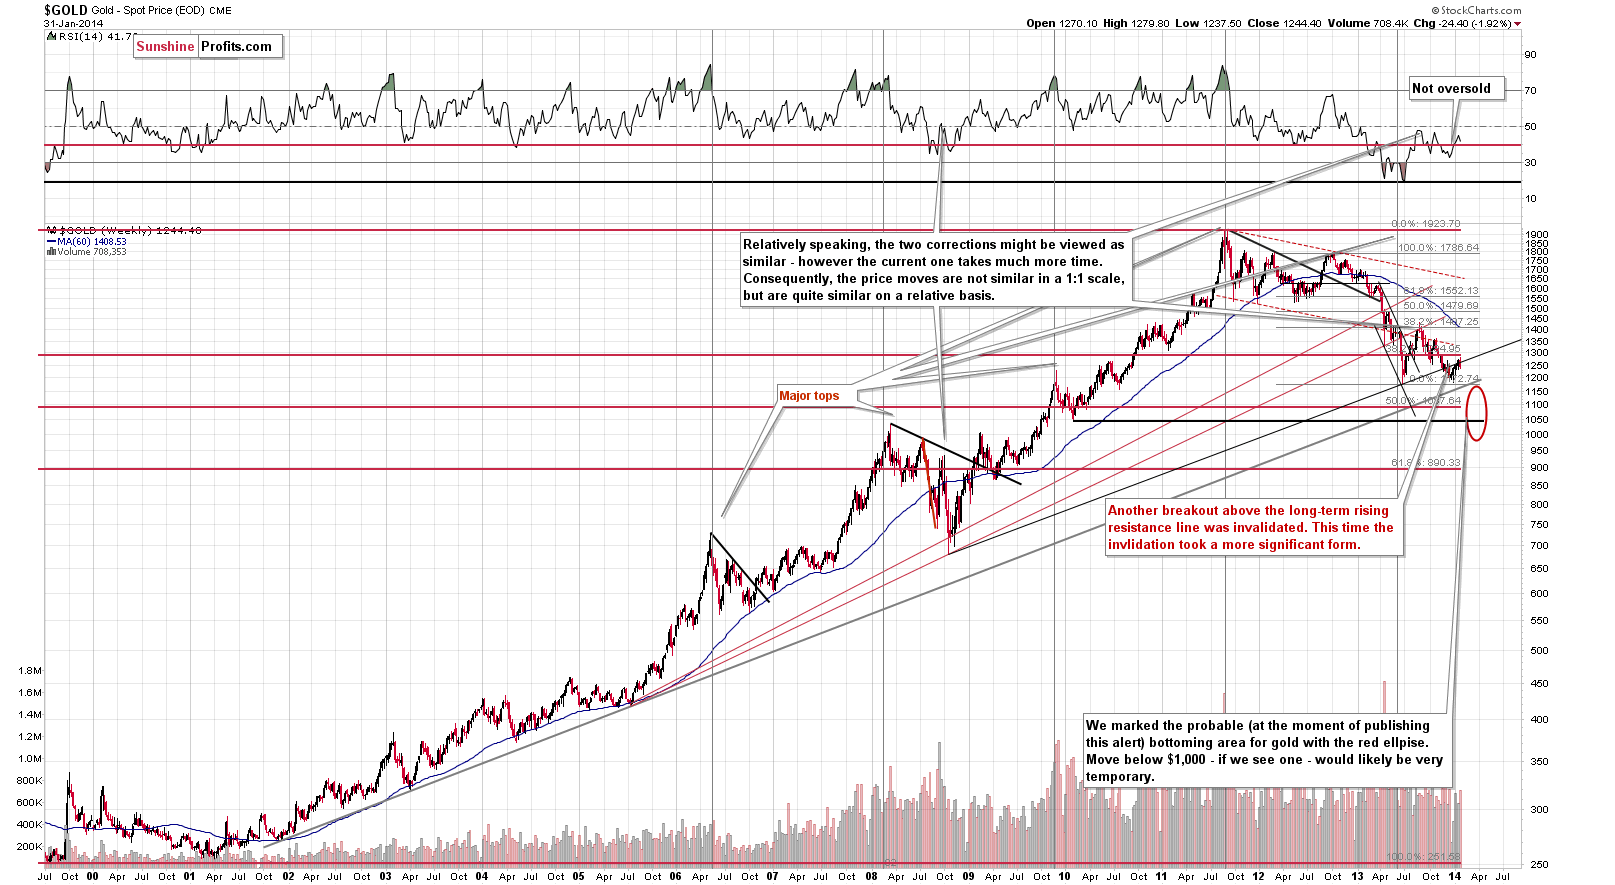
From the long-term perspective, we saw an invalidation of the breakout above the rising long-term resistance line, which, of course, is a bearish sign. Interestingly, gold moved very close to the $1,280 level, not far from the 38.2% Fibonacci retracement level based on the entire 1999 – 2011 rally. There was no move back above the rising resistance line on Friday.
From the medium-term perspective, nothing changed – gold remains below the declining resistance line and the trend remains bearish.
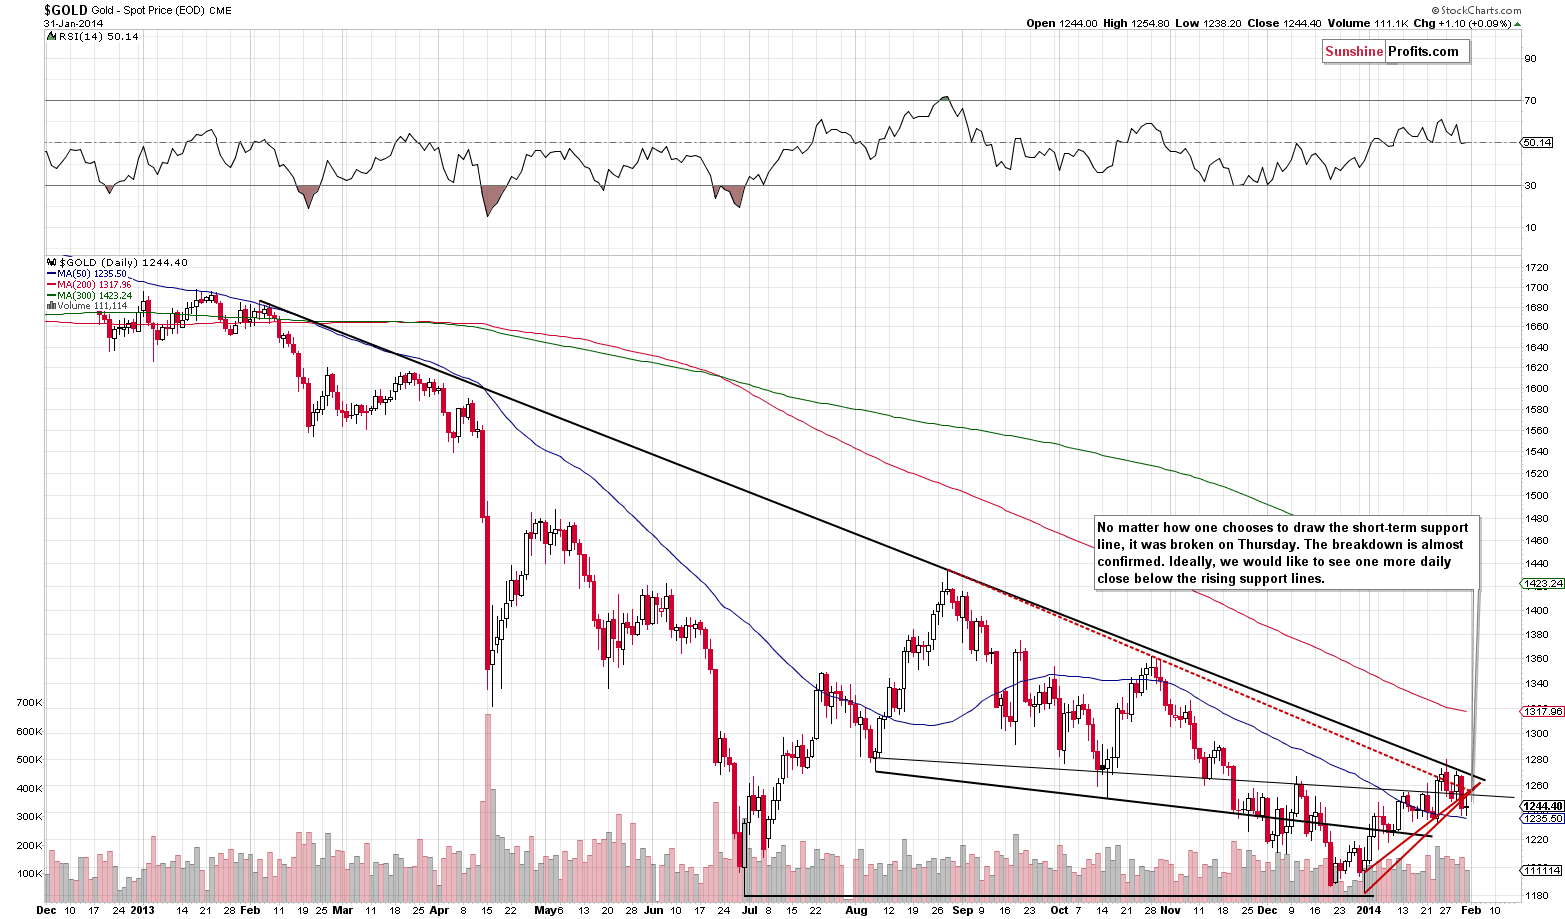
On Thursday, we saw breakdowns below the rising, short-term support lines (based on intra-day lows and based on daily closing prices). Gold didn’t move back above these lines on Friday, so we can view the breakdown as almost verified. If gold closes below these lines also on Monday, we will have a confirmed breakdown and the chance for a move lower in the short term will be even higher. The outlook remains bearish.
From the non-USD perspective, there was not breakout either.
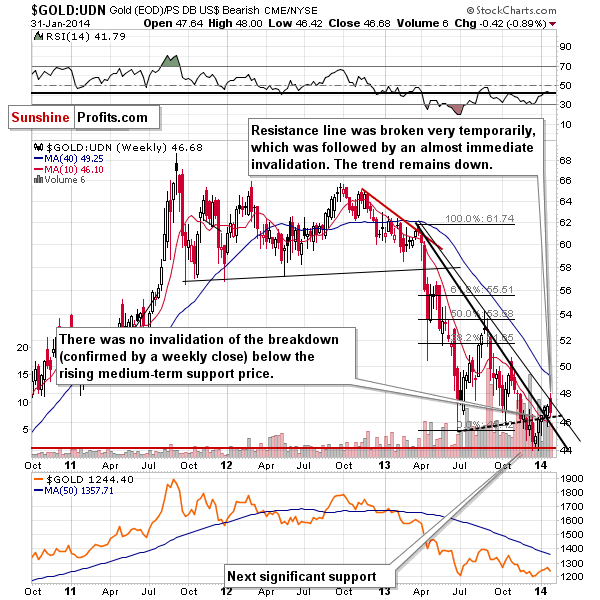
More precisely, there was, but it was invalidated almost immediately. The trend remains down and the invalidation itself can be viewed as a bearish signal.
Meanwhile, silver continues to decline and there are no changes in case of the signals coming from this market – they remain bearish.
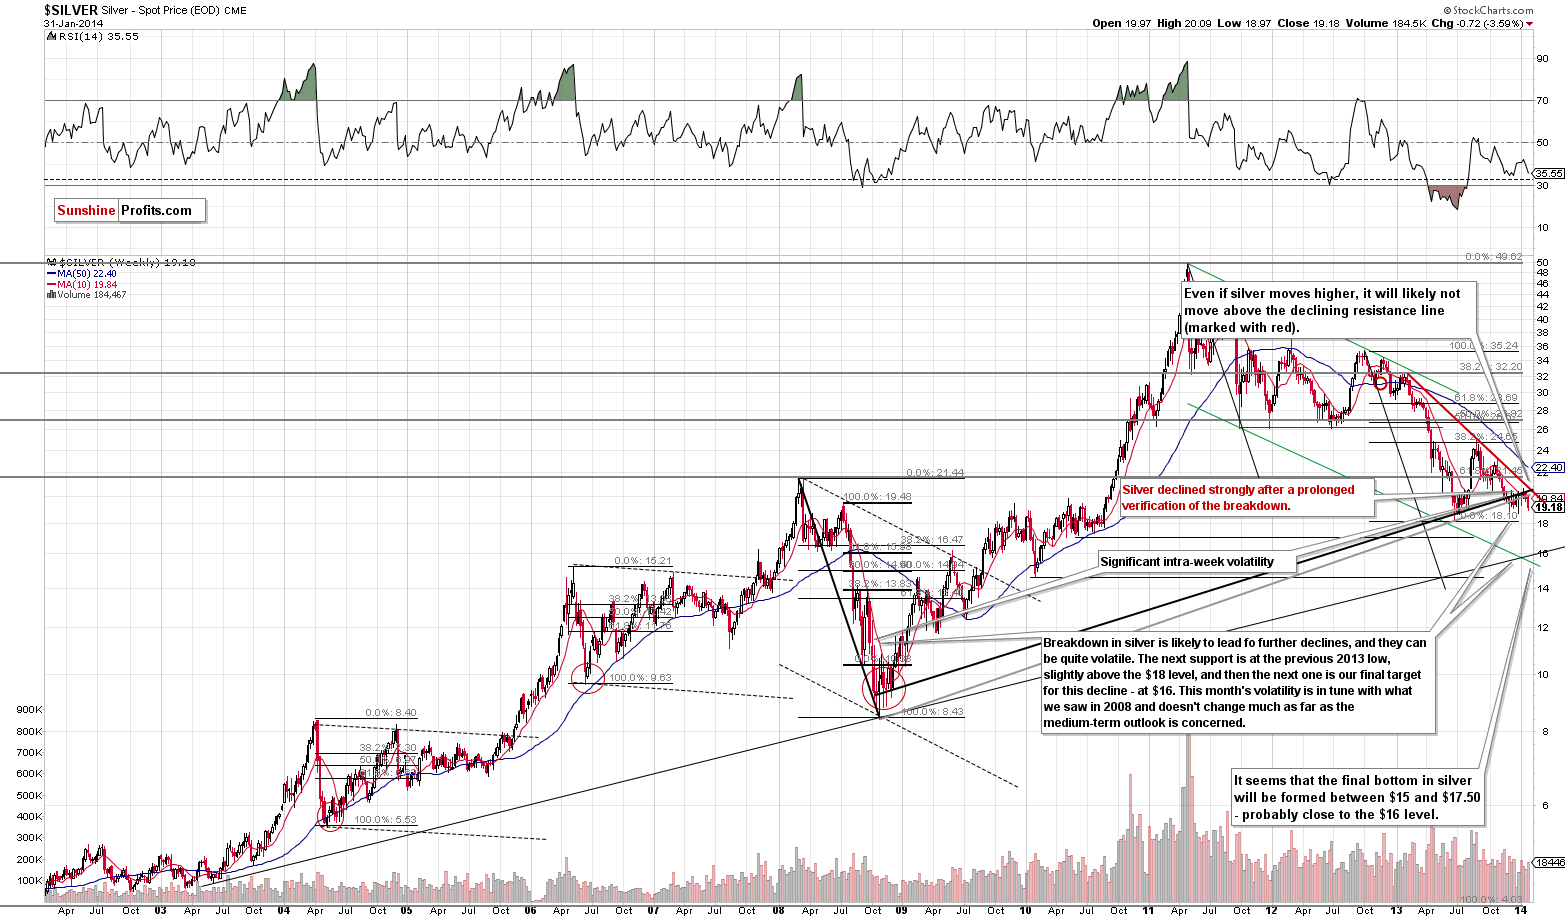
Silver certainly took its time to consolidate below the rising, long-term resistance lines, but it seems that the breakdown is more than confirmed (also by last week’s closing price). Thursday’s strong decline to the previous lows and Friday’s lack of move higher seem to confirm the bearish outlook for the following weeks.
The most visible bullish sign present in the precious metals market is the gold stocks’ breakout above the declining resistance line.
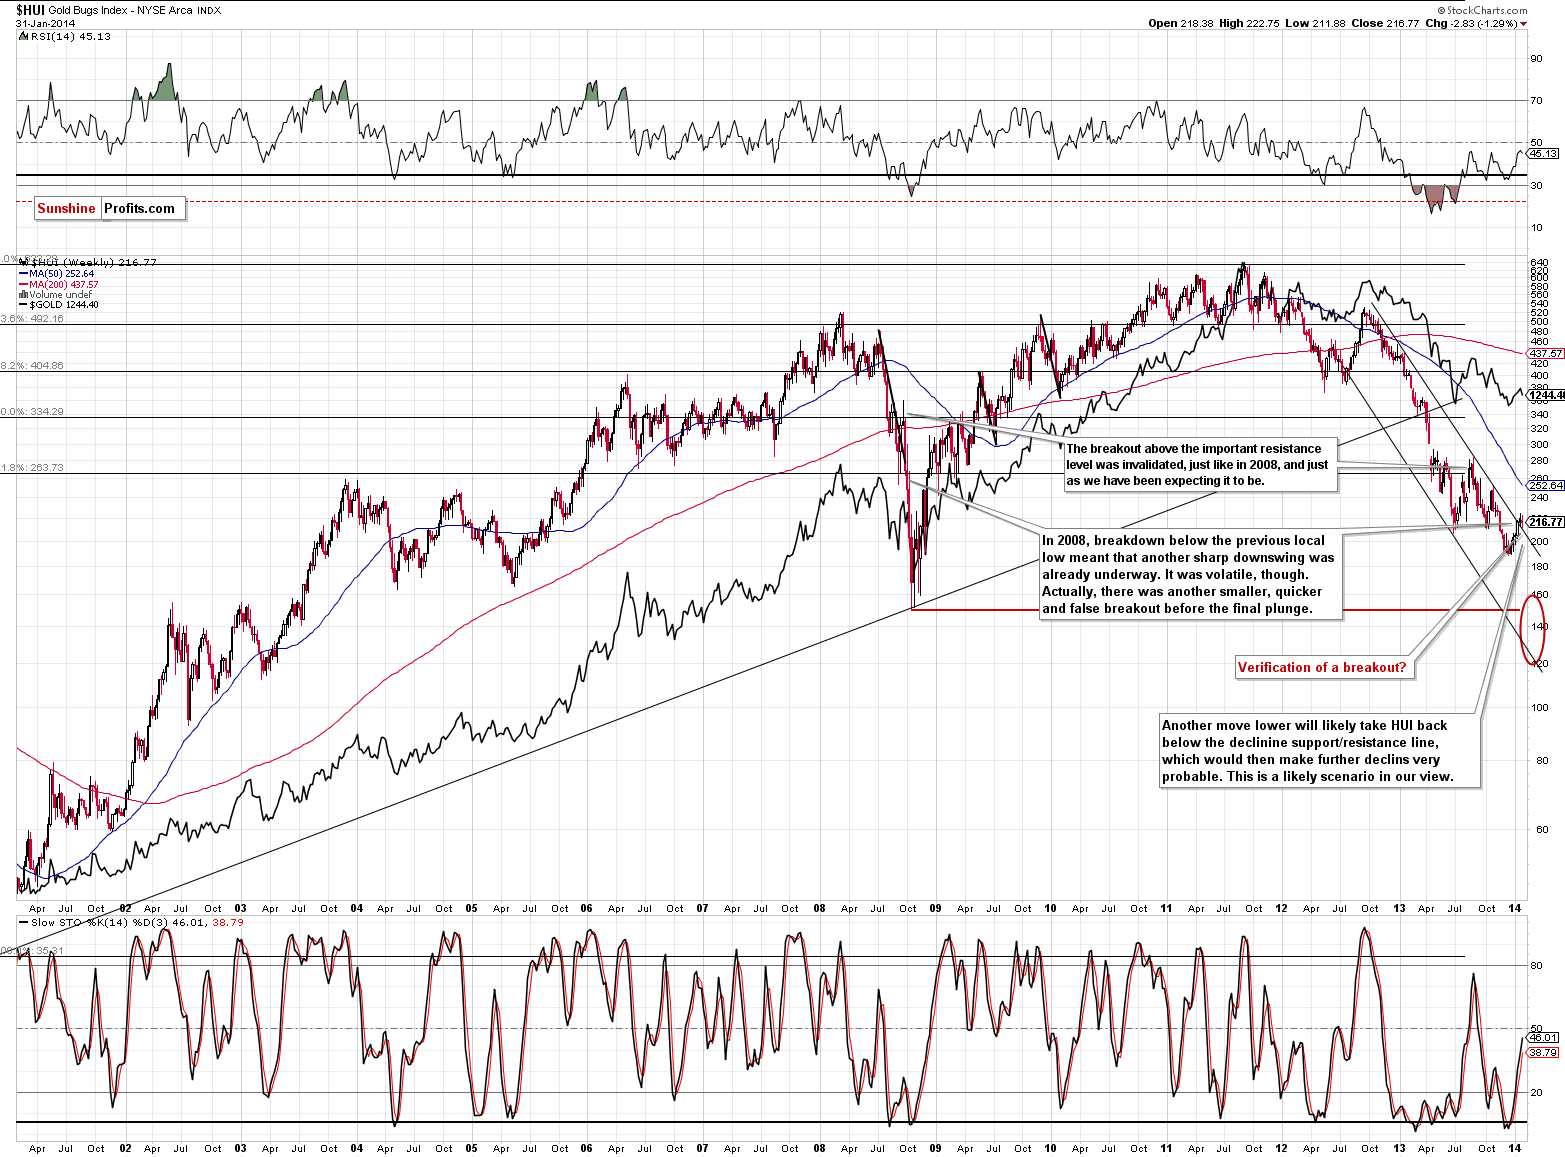
However, please don’t run to buy mining stocks before reading a few more sentences.
The current breakout is small and it’s questionable whether it has been confirmed or not. It was confirmed by 3 daily closes above the declining resistance line, but in terms of price, there has been no significant upswing. This, plus silver’s underperformance and the lack of a breakout in gold makes us want to re-examine the breakout in the HUI Index.
As we wrote previously, the current move higher is similar to what we saw in 2008 right before the final plunge of the entire precious metals sector. There was one more significant correction (like what we saw in July – October 2013) and now we see a small, barely visible one. If they history repeats or at least rhymes, then not only is the current move higher not bullish, but bearish and was to be expected to some extent.
Naturally, one analogy doesn’t entirely invalidate the bullish implication of a breakout, but it does make it much weaker. Consequently, we don’t think that one should view the gold stocks' breakout as very important.
Let’s take a quick look at the situation on the currency markets.
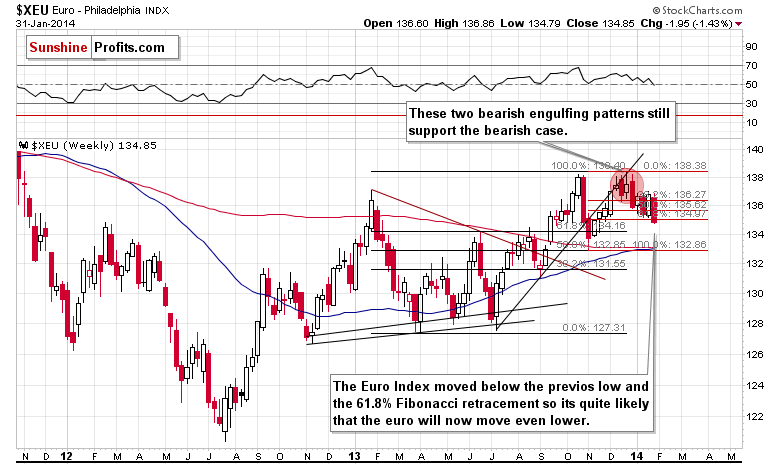
The Euro Index moved below its previous low and also below the 61.8% Fibonacci retracement based on the previous low.
It looks like the European currency will move lower in the coming weeks. This would be bullish for the USD Index and quite possibly bearish for the precious metals sector.
However, not all is just as bullish about the USD Index.
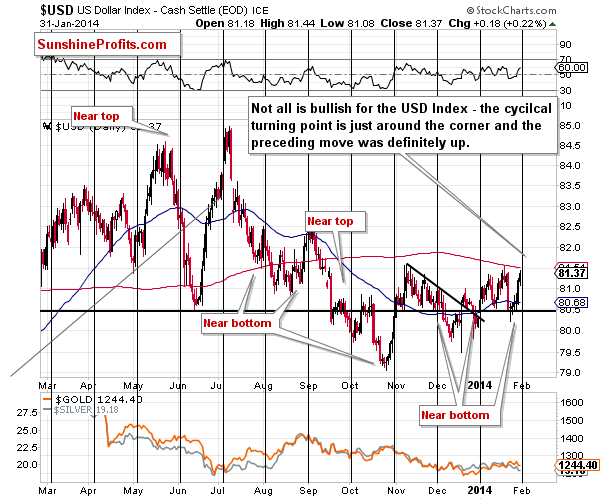
The cyclical turning point is here and the previous move was up, so we might see some sort of pullback or a decline shortly. We don’t expect it to be significant – we expect the next big move in the USD Index to be to the upside based on the long-term and medium-term breakouts.
I (PR) was talking to Nadia Simmons about the current situation in the USD Index and we agreed that if it manages to move above the previous 2014 high, then it could rally much higher – at least (!) to 82.70. Such a move would obviously very likely have a devastating effect on precious metals prices.
In Friday’s Alert we promised to follow-up on the platinum market in the coming days and here we are.
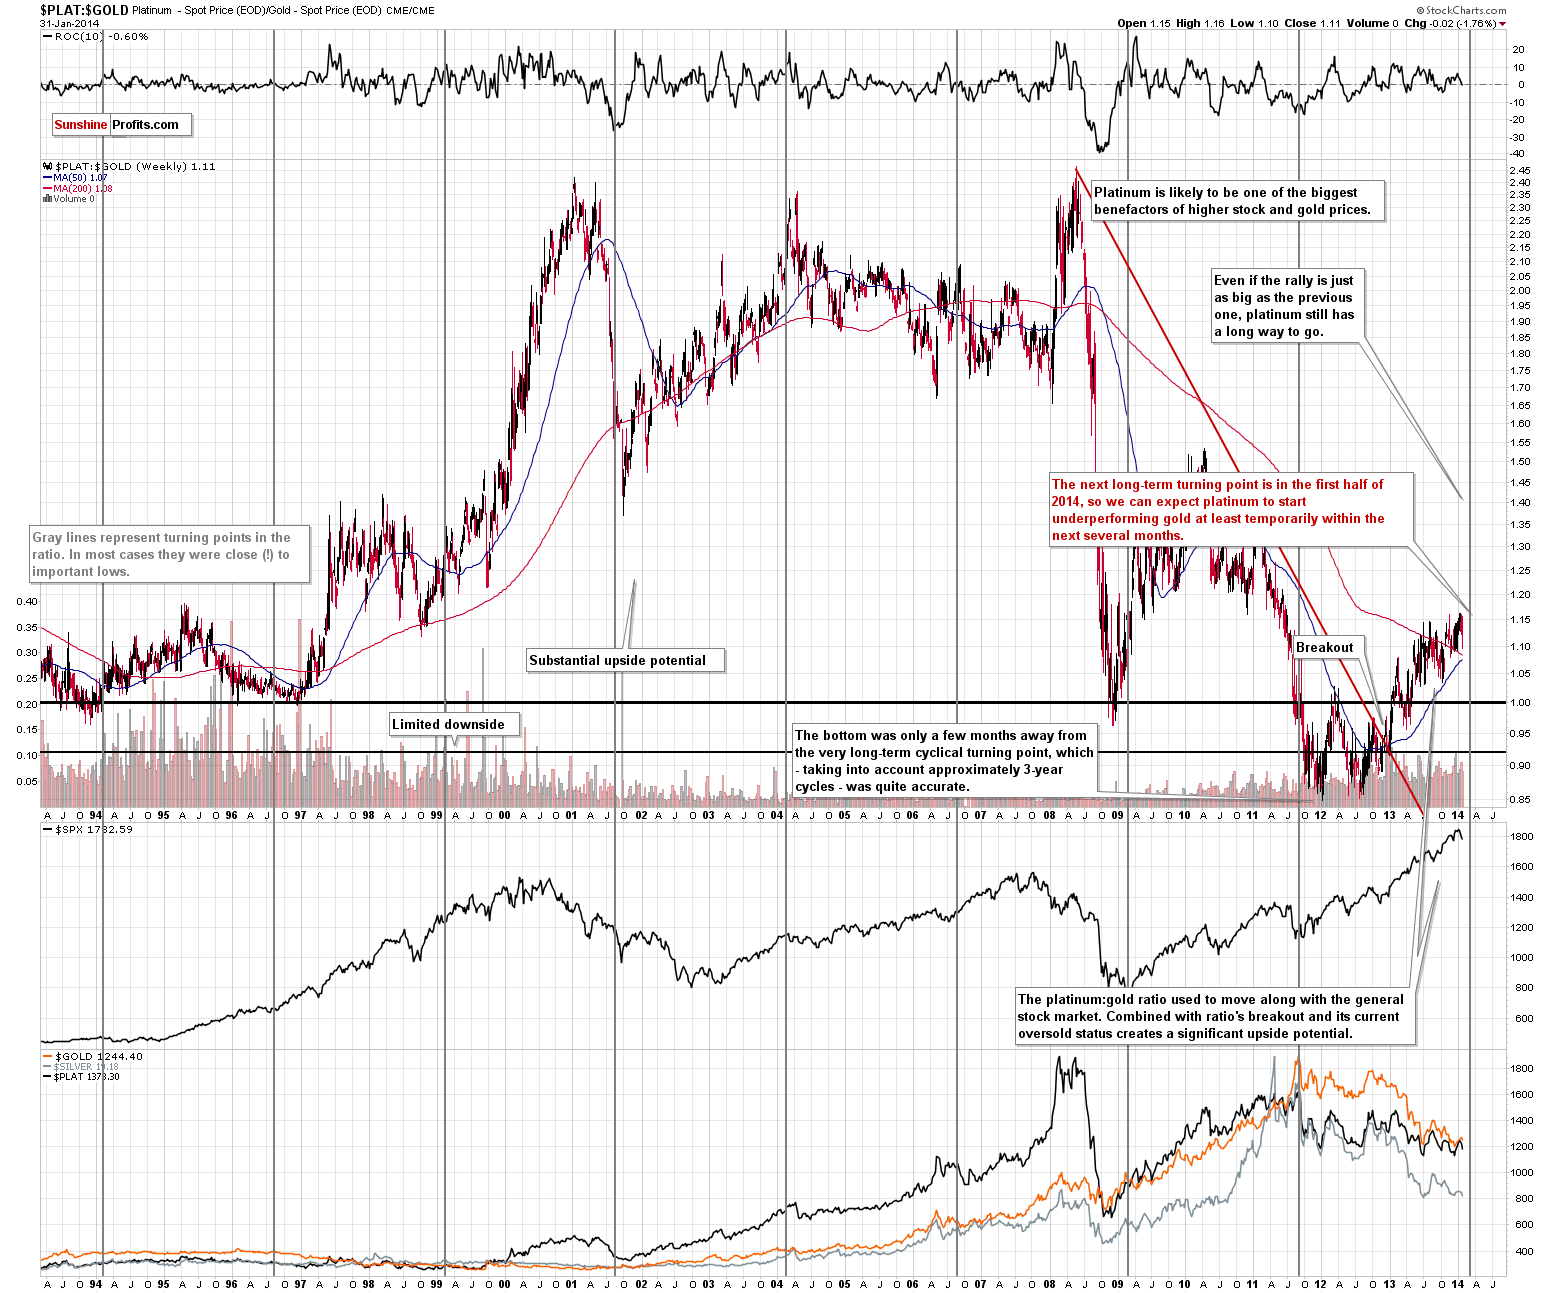
Platinum has had quite a run in the past few years even though we can see that it declined last week. Long-term subscribers will recall that we suggested moving the long-term investments from gold to platinum when the ratio dropped below 1 and then emphasized this decision in the following months. Platinum cheaper than gold – this was a major anomaly and something that we wanted you to take advantage of. Platinum moved higher relative to gold and at this time it’s 10% more expensive than gold.
Is platinum done outperforming? Not likely, but we might see a pause in the trend, especially if we see a bigger correction in the general stock market. Please note that platinum has still a lot ground to make up if it is to trade at a premium to gold similar to what we saw for most of this bull market – close to 1.9 or so. With gold at $1,200, that’s $2,280 (and platinum is priced at $1,369 at the moment of writing these words). That’s quite a powerful upside potential – and if gold also appreciated, say to $2,000, then the above would become $3,800.
Of course these numbers are just estimates based on the assumption that the platinum-to-gold ratio will return to its previous values, which may or may not be the case and a lot seems to depend on the general stock market’s performance, with which platinum is quite highly correlated. Still, it does seem that platinum’s upside potential is higher than the one of gold.
Finally, it seems that the buying opportunity for platinum is ahead of us, similarly to what we think about the buying opportunity for the rest of the precious metals sector – the medium-term trend for gold and silver remains down and the small breakout in the HUI Index is not that meaningful, so we can expect to see a move lower in platinum in the coming weeks as well.
Here are some parts of our website that you may want to visit if you're interested in investing in platinum:
- Platinum as a precious metal
- Importance of physical physical gold, silver, platinum ownership
- "What are your thoughts on platinum as insurance?"
- Precious Metals Portfolio (includes platinum)
- Our interview with Nick Barisheff (with information on platinum's monetary future)
- Thoughts on funding one's retirement with silver (with comments on platinum)
- Report on Precious Metals in Japan with emphasis on Platinum and Palladium
Most of all, if you are looking for a platinum ETF / ETN, be sure to check our gold & silver ETF ranking. Its name can be misleading (and we're thinking about dividing it into a few separate rankings) because it includes more than gold and silver ETFs / ETNs - you will also find information about mining stock funds and platinum/palladium funds. In order to see the latter go to the page, scroll the page to the bottom and access the full screen mode. Then, on the top of the page select "investor ratings" (or "trader ratings" if you want to trade platinum instead of investing in the long run). Then in the header of the table select "benchmark". You may have to click it twice to activate the sorting. Scroll down until you see "PGM" (Platinum Group Metals). You will then be able to compare how many "stars" a given fund received based on numerous fundamental and quantitative factors.
Summing up, taking all of the above into account, we arrive at the same conclusion at which we arrived previously – namely, that it’s a good idea to use a small part of your speculative capital to trade the (likely) coming decline in precious metals. If we see a meaningful confirmation of the bearish case (for instance, a decline on strong volume or a breakdown in the HUI Index), we will likely suggest adding to the position. Naturally, in case of an invalidation of the bearish outlook, we will keep you informed as well. For now, this short position is already profitable.
On an administrative note, we have just published our first Corporate Social Responsibility report. It describes what we did in the CSR area in 2013 and what our plans are for this year. It’s not long (shorter than this alert) and reading it shouldn’t take much of your time. You can access it on our CSR Reports page.
To summarize:
Trading capital: Short position (half) in: gold, silver and mining stocks. We are planning to profit on a significant downswing, so the stop-loss orders will not be that close (however, if something invalidates the bearish outlook, we will let you know ASAP, even if stop-loss orders are not reached).
Stop-loss orders for the short position:
- Gold: $1,307
- Silver: $21.20
- GDX ETF: $27.20
Long-term capital: No positions.
As always, we'll keep you - our subscribers - updated should our views on the market change. We will continue to send out Gold & Silver Trading Alerts on each trading day and we will send additional Alerts whenever appropriate.
The trading position presented above is the netted version of positions based on subjective signals from your Editor, and the automated tools (SP Indicators and the upcoming self-similarity-based tool).
As a reminder, Gold & Silver Trading Alerts are posted before or on each trading day (we usually post them before the opening bell, but we don't promise doing that each day). If there's anything urgent, we will send you an additional small alert before posting the main one.
Thank you.
Sincerely,
Przemyslaw Radomski, CFA

