

Briefly: in our opinion, full (100% of the regular position size) speculative long positions in gold are justified from the risk/reward point of view at the moment of publishing this Alert.
In yesterday’s extensive analysis, I explained the foundations on which I’m basing a very bearish outlook for the precious metals sector for the following months, and if you haven’t read it yet, I encourage you to do so today.
In today’s analysis, I’ll focus on the short-term deviation from the above-mentioned bearish outlook, as it seems – based on what we saw yesterday – that we’re likely to see a corrective upswing, which might be particularly visible in gold.
Possible Move Upwards Ahead
Why would the above be the case? Because history has been rhyming very well recently (with 2012, that is), and based on what happened at that time, it seems that it’s high time for gold to correct. Sure, gold is likely to fall substantially in the next several months, but it doesn’t mean that it will fall in a straight line. And if we’re going to see straight lines down, it's more likely (based on gold’s past performance) that we’ll see those close to the end of the huge decline, not relatively soon in it.
So, you’re telling me that you’re just counting on history being repeated almost to the letter, and you based a trading position only on that?
No. Not “just” that.
- There are multiple reasons why gold is likely to correct even without taking into account this powerful analogy to the past, and I’m going to cover them below.
- The analogy to 2012 is not “just” an analogy, it’s “the” analogy – it’s been confirmed in so many ways and not just by gold’s, but also by gold stocks’ performance.
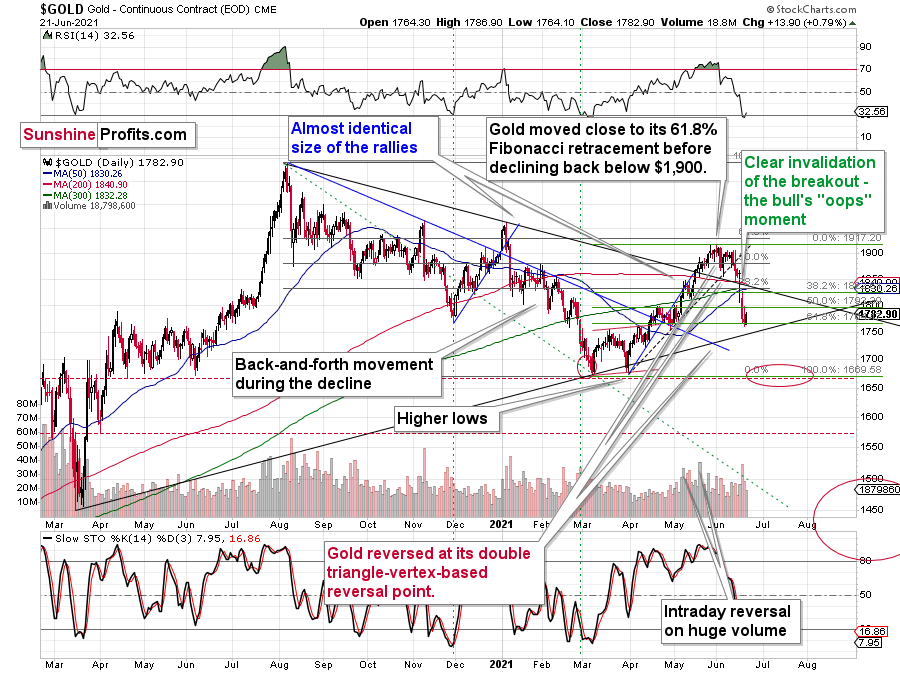
The RSI has just moved back above the 30 level, and this was a buy signal in many cases in the past. Early March 2021 was an exception, but gold didn’t decline far before rallying then anyway.
Also, gold has just invalidated the tiny breakdown below the 61.8% Fibonacci retracement level, which is bullish on its own. Moreover, it happened right between the previous local high and low (the late-April high and low).
Approximately, the same thing triggered a counter-trend rally at the beginning of November 2012.
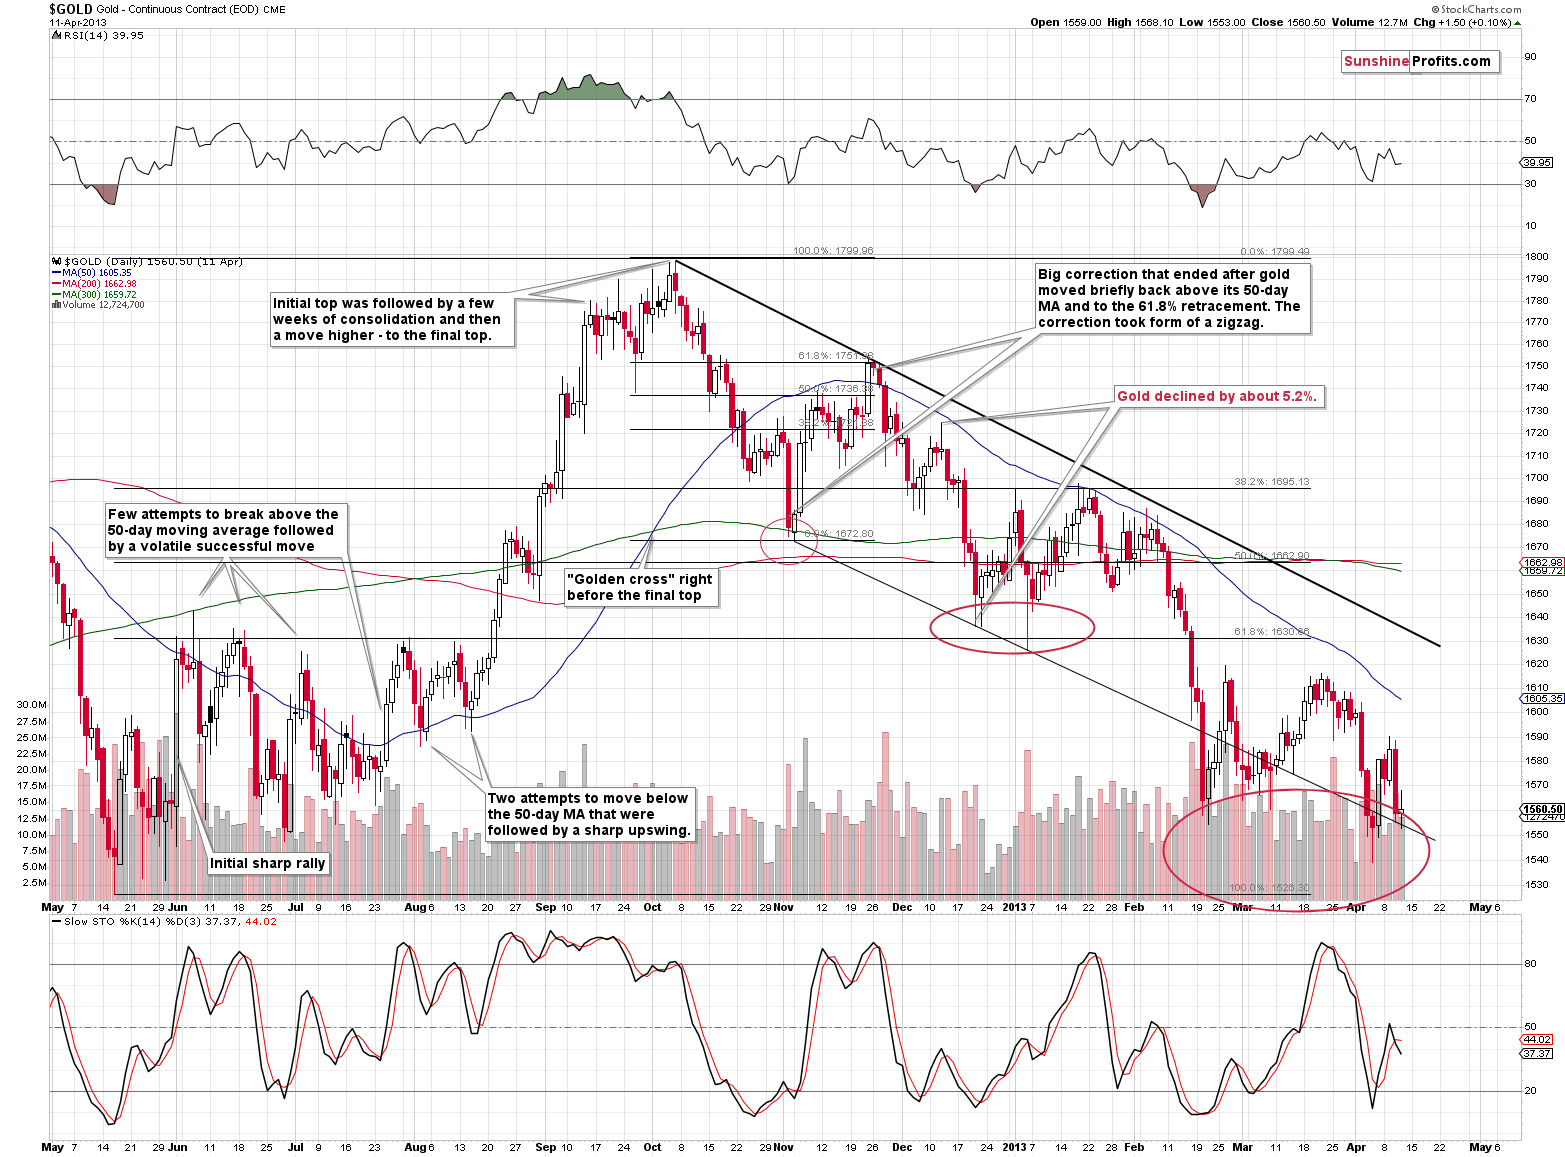
On the day of the bottom, gold rallied just a bit and the volume was relatively low. This happened right after a volatile decline took place on big volume; we saw exactly the same thing yesterday.
But how strong was the corrective upswing in 2012 before the yellow metal resumed its downtrend? Well, it corrected 61.8% of its previous decline and that would align with a rally to ~$1,860 while still preserving the medium-term downtrend.
My plan here is not to wait until gold rallies to its 61.8% retracement. Instead (if history repeats itself, that is) my plan will be to exit the long positions after the easy part of the rally, ideally after the first several days, with gold close to its 50% retracement. And why do I prefer that?
Bearish Objective Remains Intact
Well, first of all, because it’s the easy part of the rally that I want to focus on since the medium-term outlook is very bearish, and I view long positions now as the counter-trend positions. This means that I view them as relatively risky. Consequently, I would prefer to be back on the short side of the precious metals market, as soon as it’s no longer “very” likely that we’ll see a corrective upswing.
Second, back in 2012, gold miners didn’t present their best opportunity to re-enter short positions when gold topped, but actually after gold’s first wave higher.
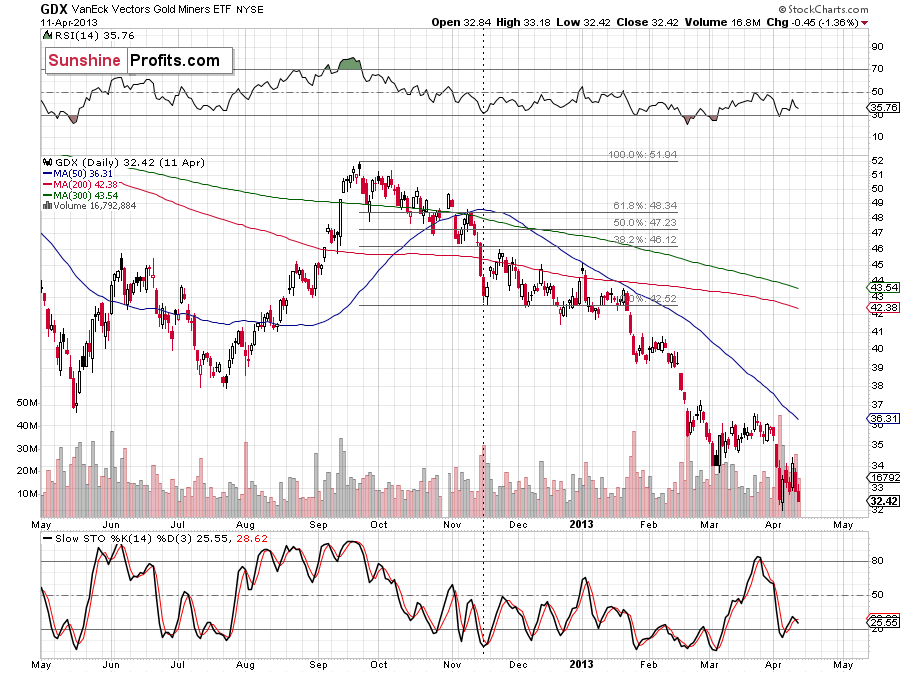
The GDX ETF rallied the most during the easy part of gold’s rally, and it didn’t move to new highs later, even though gold did. Consequently, since the priority here is not to miss the huge downswing, it seems justified to exit long positions when the easy part of the rally is over.
Why? The HUI Index chart shows us how much there is to profit from.
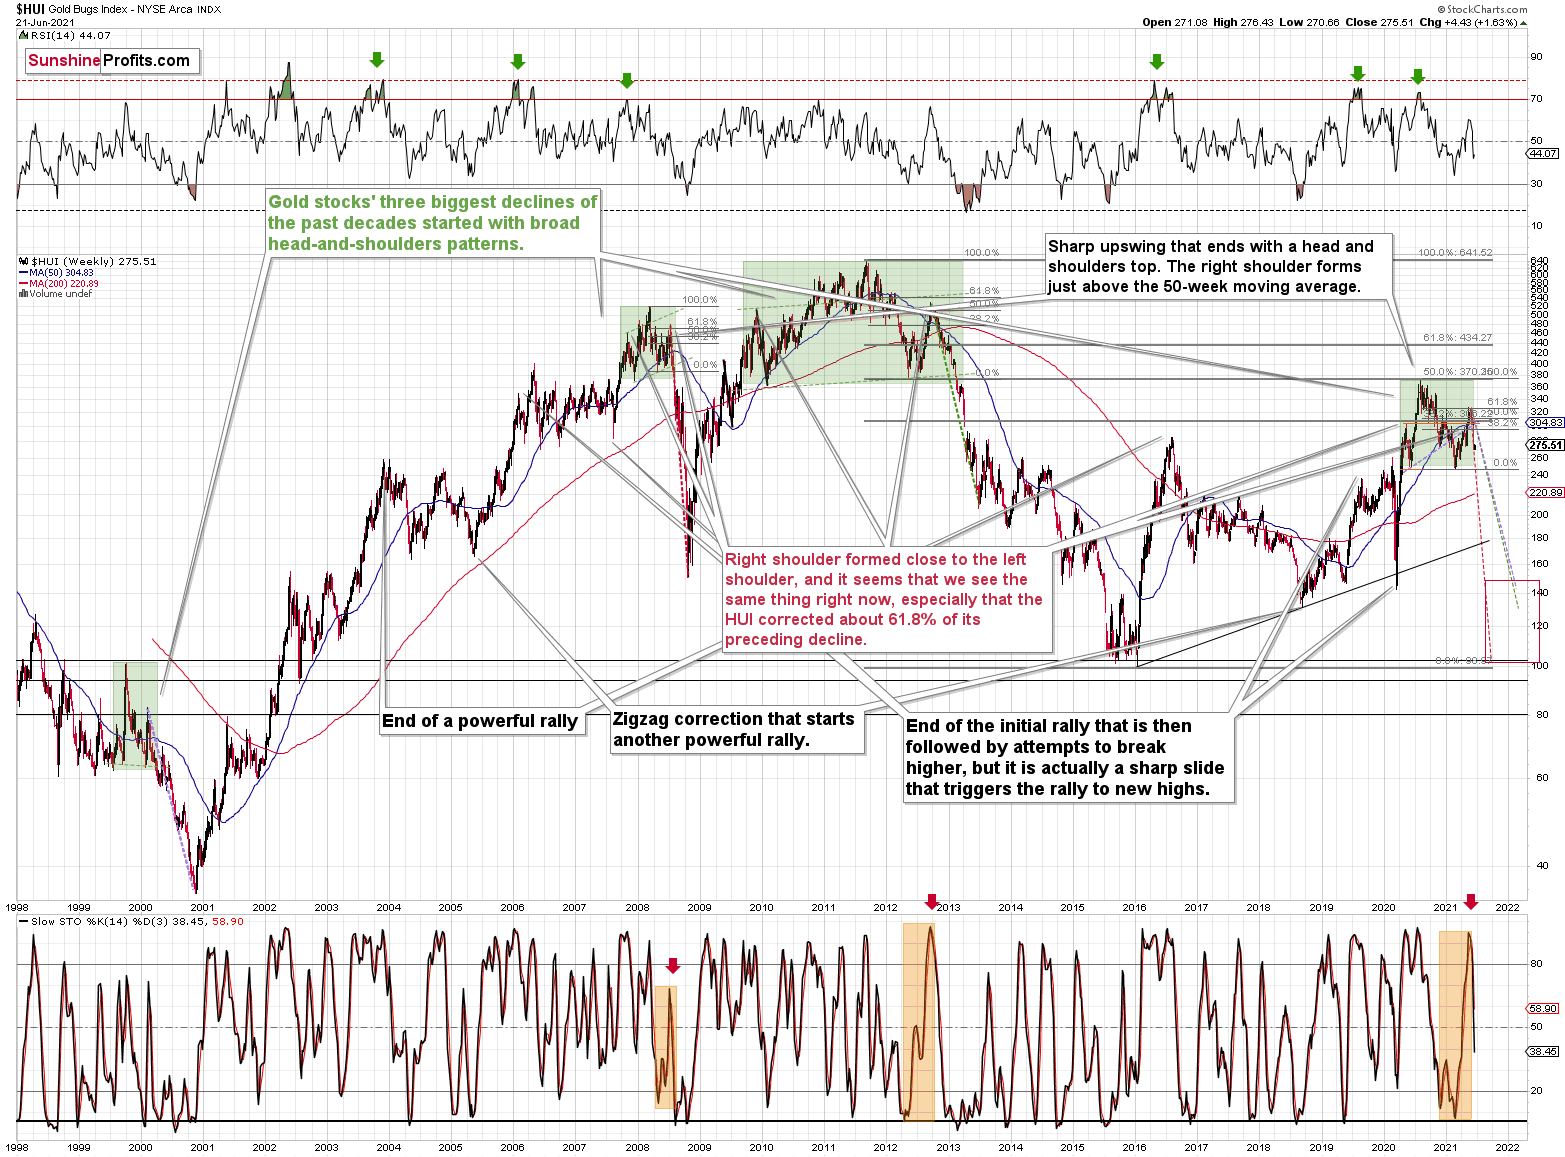
The sizes of the declines that we saw in similar times (in 2008 and 2012) were truly astonishing.
Ok, so how high might the GDX move during this correction?
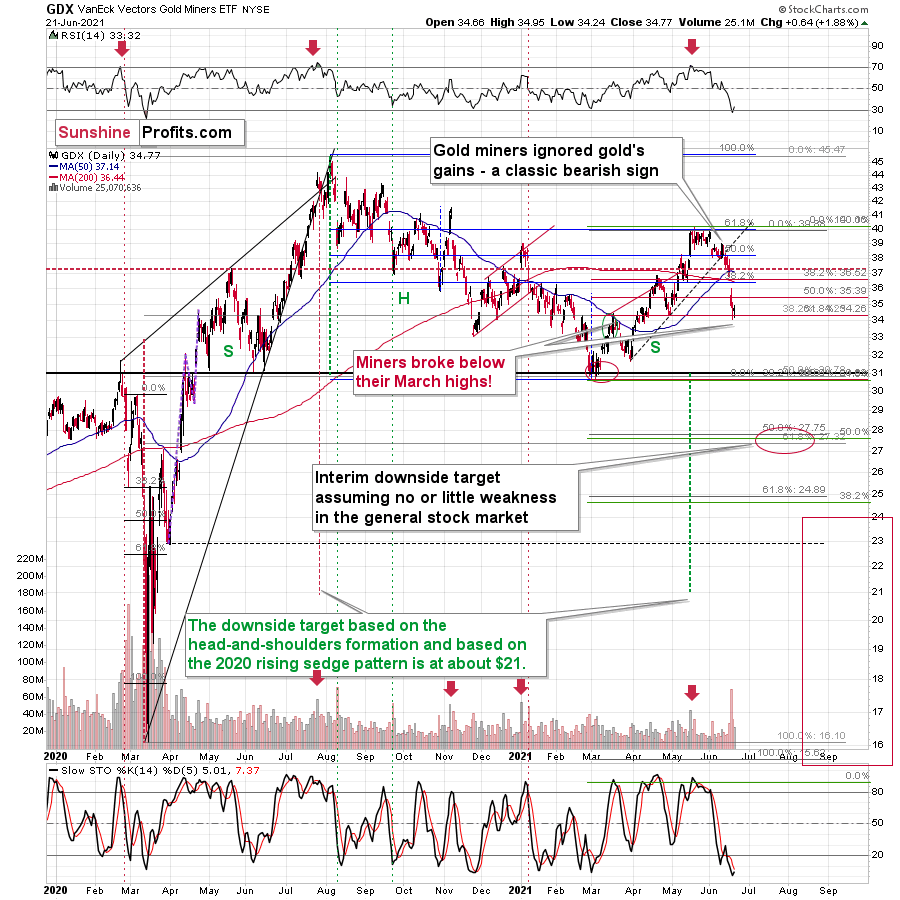
In my view, the GDX ETF could rally to about $37 or so. That’s where we see several resistance lines, also the one created by the upper border of a price gap. The April high and the 50-day moving average add to the strength of the resistance.
The rally to ~$37 could become the right shoulder of a short-term head-and-shoulders formation, with the April high being the left shoulder. The implications of this formation would be bearish as they would imply a quick slide to the March lows.
Meanwhile, the USD Index moved back below its 61.8% Fibonacci retracement, while the RSI indicator based on it moved back below 70.
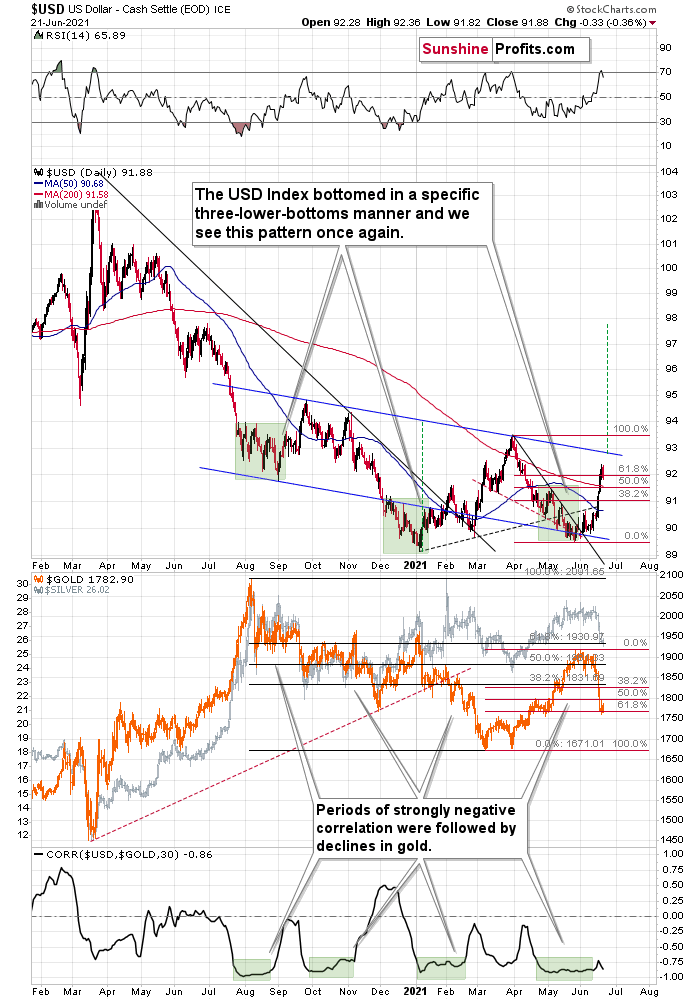
This likely means that we’ll see a quick pullback, as the USD Index seems to have rallied too far too fast. I previously wrote that it’s theoretically possible (and not that unlikely) that the USDX would rally even higher based on how big, medium-term rallies started in the past. However, the invalidation of the 61.8% retracement and the lost momentum confirmed by the RSI suggest that a breather here is more likely.
Having said that, let’s take a look at the markets from a more fundamental point of view.
The Talk of the Town
While I’ve been warning for months that the U.S. Federal Reserve (FED) will likely taper its asset purchases much sooner than investors expect, the gossip has finally reverberated across the financial markets.
To explain, I wrote on Jun. 21:
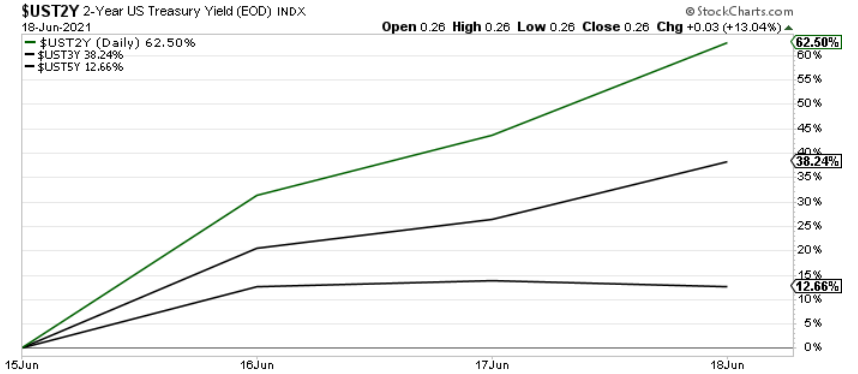
With the FED’s announcement turning the financial markets upside down, the U.S. 10-Year Treasury yield’s rollercoaster performance didn’t capture the magnitude of the move. For example, with the front-end of the U.S. yield curve becoming increasingly unhinged, the U.S. 2-Year, 3-Year and 5-Year Treasury yields surged by more than 62%, 38% and 12% respectively following the FED’s announcement.
Please see below:
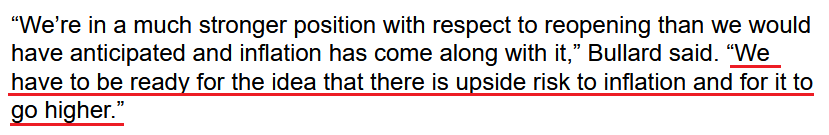
To that point, with the FED’s critics growing louder by the day, even its own members are sounding the alarm on inflation. Case in point: after St. Louis FED President James Bullard told CNBC on Jun. 18 that officials saw “more inflation than we were expecting” and added that “I think it’s natural that we’ve tilted a little bit more hawkish,” he reiterated his stance on Jun. 21.
Please see below:
 Source: Bloomberg
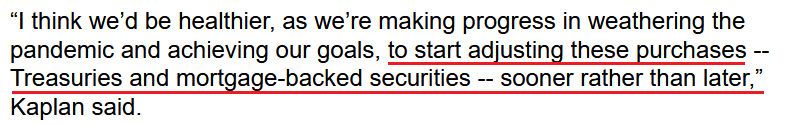
Singing a similar tune, Dallas FED President Robert Kaplan also said on Jun. 21 that the liquidity splurge has run its course and that “the issue on the table today and in the near term is the timing and adjustment of these purchases.”
Please see below:
 Source: Bloomberg
If that wasn’t enough, former U.S. Treasury Secretary Lawrence Summers also voiced his concern that the FED is already materially behind the inflation curve.
“Much of the consensus of professional forecasters in February was that we would have inflation just above 2% this year,” he said. “We’ve already had more inflation than that in the first five months of the year. This suggests that people should not just modify their forecasts but should think about what their errors of thinking were that led them to be so far off in their forecasts.”
Piling on the poor FED, former U.S. Treasury Secretary Steven Mnuchin added on Jun. 21 that “there’s no question the FED needs to go into a period of normalizing rates and normalizing the portfolio … and I do think the markets are underestimating this risk.”
And why does he believe that?
Well, for one, Bank of America’s latest Global Fund Manager Survey revealed that institutional investors are “bullishly positioned for permanent growth, transitory inflation and a peaceful FED taper.” Essentially, they expect a Goldilocks environment. And with that, the narrative is that inflation has already peaked.
Please see below:
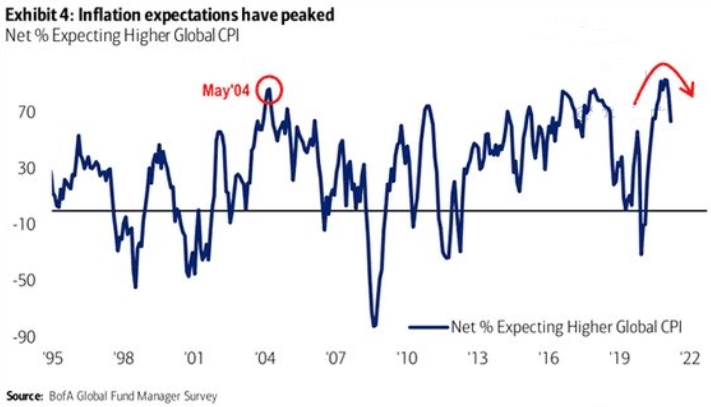
The blue line above tracks the net percentage of investors forecasting a higher global Consumer Price Index (CPI). If you analyze the right side of the chart, you can see that the blue line has fallen considerably from its prior high. However, with the Personal Consumption Expenditures (PCE) Index scheduled for release on Jun. 25, another inflationary surprise could be lurking around the corner.
To explain, the FED increased its year-over-year (YoY) headline PCE Index forecast from a rise of 2.40% YoY to a rise of 3.40% YoY on Jun. 16. However, with the Commodity Producer Price Index (PPI) surging by 18.98% YoY – the highest YoY percentage increase since 1974 – the wind still remains at inflation’s back. Moreover, with all signs pointing to a YoY print of roughly 4% to 4.50% on Jun. 25, the “transitory” narrative could suffer another blow on Friday.
For context, I wrote on Jun. 16:
If we begin with the reported figure [an 18.98% YoY increase], the commodity PPI implies a roughly 4.50% YoY increase in the Personal Consumption Expenditures (PCE) Index.
Please see below:
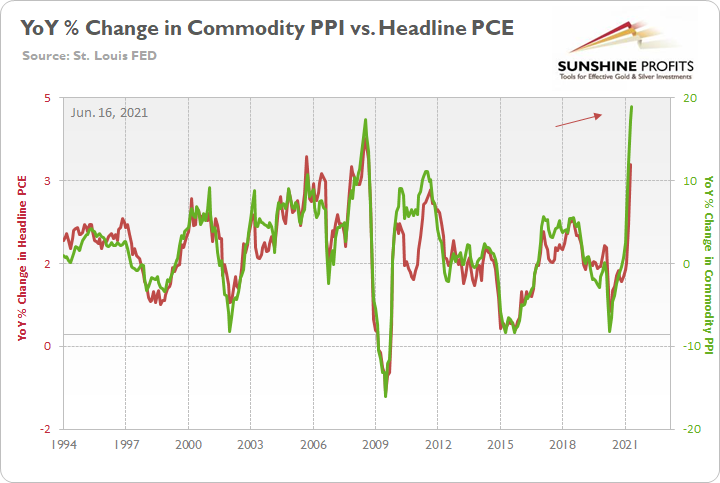
To explain, the green line above tracks the YoY percentage change in the commodity PPI, while the red line above tracks the YoY percentage change in the headline PCE Index. If you analyze the right side of the chart, you can see that a material gap is clearly visible. What’s more, if we substitute the 18.98% jump with the non-base-effects comparison of 12.60%, it still implies a rise in the headline PCE Index of roughly 3.60%.
Let’s Taper Now… But Don’t Tell Anyone
Furthermore, while investors aren’t paying much attention, the FED’s tightening cycle has already begun:
- The New York FED announced on Jun. 3 that it “will begin gradual sales of its holdings of corporate bond exchange- traded funds (ETFs) on June 7.”
- The FED increased the interest rate on excess reserves (IOER) from 0.10% to 0.15% on Jun. 16.
- The U.S. federal funds rate rose from 0.06% to 0.10% on Jun. 17.
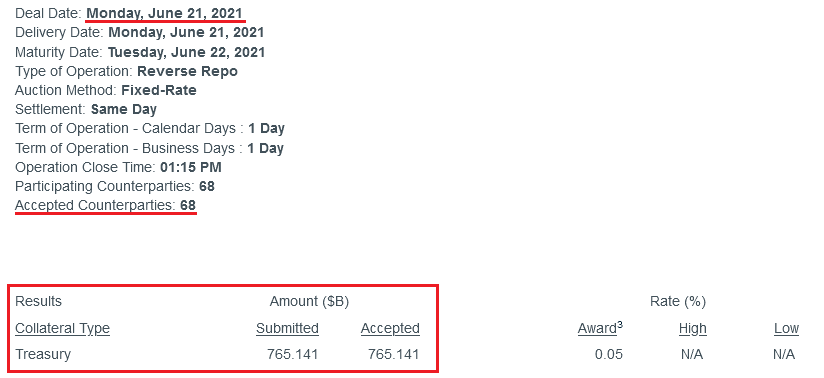
- The FED sold a record $765 billion worth of reverse repurchase agreements on Jun. 21.
Please see below:
 Source: NY FED
To explain, a reverse repurchase agreement (repo) occurs when an institution offloads cash to the FED in exchange for a Treasury security (on an overnight or short-term basis). And with U.S. financial institutions currently flooded with excess liquidity, they’re shipping cash to the FED at an alarming rate.
More importantly, though, after the $400 billion level was breached in December 2015, the FED’s rate-hike cycle began. On top of that, the liquidity drain is at extreme odds with the FED’s QE program. For example, the FED aims to purchase a combined $120 billion worth of Treasuries and mortgage-backed securities per month. However, with daily reverse repurchase agreements averaging $520 billion since May 21, the FED has essentially negated 4.33 months’ worth of QE in the last month alone.
Likewise, I noted at the beginning that the U.S. 2-Year Treasury yield surged by more than 62% following the FED’s announcement on Jun. 16. And with the short-term benchmark exhibiting a correlation of 0.98 with the U.S. federal funds rate since 1977, further momentum could have the FED sweating bullets over the summer.
Please see below:
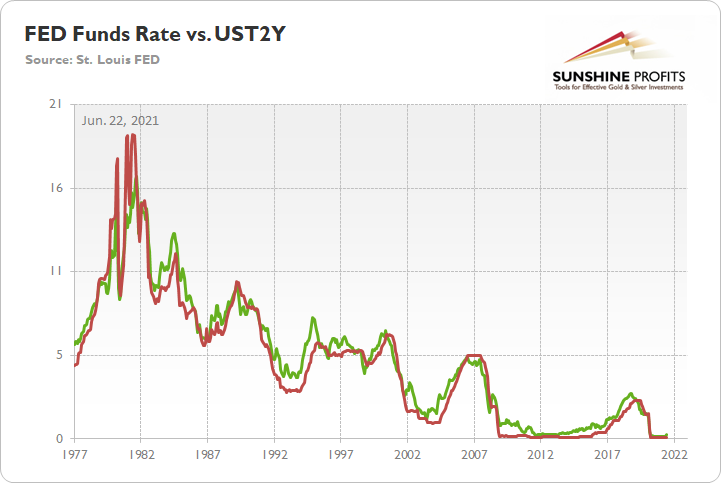
To explain, the green line above tracks the U.S. 2-Year Treasury yield, while the red line above tracks the U.S. federal funds rate. If you analyze the relationship, you can see that the two often follow in each other’s footsteps. Thus, if the former continues its rally, the FED may find itself behind the interest rate curve.
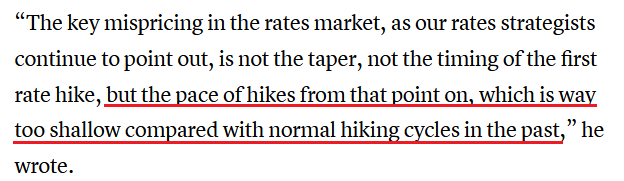
To that point, Hans Mikkelsen, credit strategist at Bank of America, told clients on Jun. 21 that he expects the FED “to soon begin tapering its [QE] purchases, and to start hiking interest rates earlier than expected – and, most importantly, much faster than currently priced in the markets,”
Please see below:
 Source: CNBC
Trends Are Changing
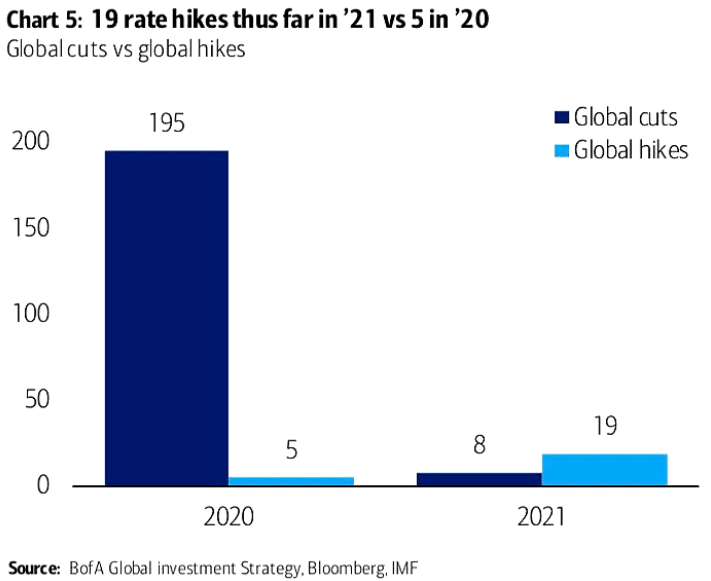
In addition, while 2020 was the year of the cut, 2021 is shaping up to be the year of the hike. To explain, 195 global interest rate cuts were witnessed in 2020 with only five hikes offsetting the dovish nirvana. Conversely, in 2021, we’ve already witnessed 19 global rate hikes and only eight offsetting rate cuts. As a result, not only is liquidity drying up in the U.S., but the global faucet is also starting to creak.
Please see below:
On top of that, with rising interest rates spelling trouble for the PMs over the medium term, the reduction in liquidity could spur volatility across U.S. equities and exacerbate the PMs’ potential selling pressure in the coming months.
Please see below:
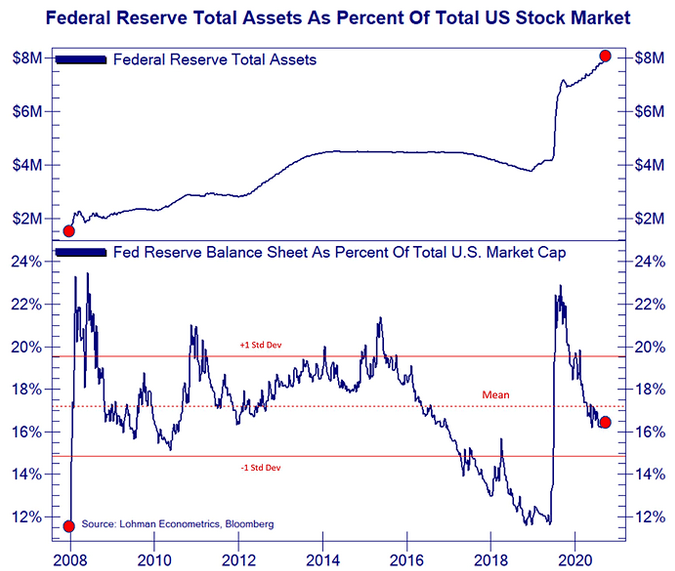
To explain, the blue line at the top half of the chart tracks the FED’s balance sheet, while the blue line at the bottom half of the chart tracks the FED’s balance sheet as a percentage of U.S. equities’ total market cap. If you analyze the right side of the chart, you can see that the FED’s influence peaked in 2020 and has been in free fall ever since. Moreover, with the central bank poised to tighten the liquidity screws in the coming months, a reenactment of late 2018 could weigh heavily on the PMs.
From a valuation perspective, Bank of America’s Global earnings per share (EPS) model signals that growth peaked in April 2021 and that weak quarterly prints could result in high volatility over the next 12 months.
Please see below:
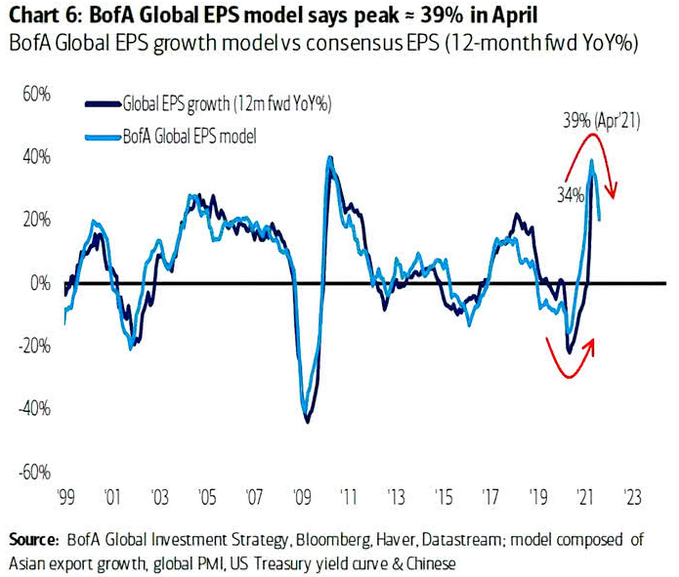
To explain, the dark blue line above tracks the 12-month forward YoY percentage change in global EPS growth, while the light blue line above tracks the future trajectory predicted by BofA’s Global EPS model. If you analyze the right side of the chart, you can see that the light blue line has already moved sharply lower. And if the dark blue line follows suit, global equities could come under severe pressure as investors recalibrate their expectations.
Watch for Out of Tune Singing
Finally, while I’ve mentioned on several occasions that FED officials already know that they have to taper (they just don’t want to disclose it publicly and cause a sell-off in the stock and bond markets), their divergent messaging is another sign that a climax is approaching.
Please see below:
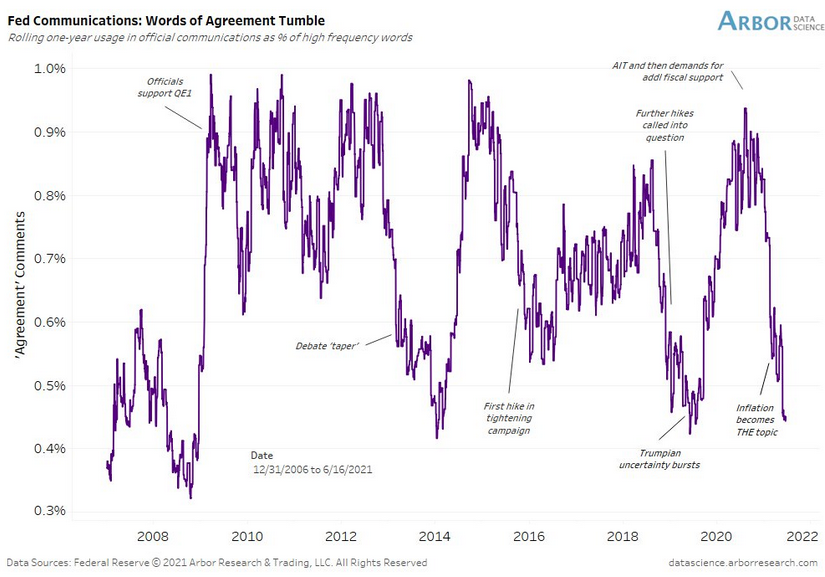
To explain, Arbor Data Science tracked FED officials’ “words of agreement” during various speaking arrangements. When the purple line is rising, it means that FED officials all support the same narrative. Conversely, when the purple line is falling, it means that FED officials are sending conflicting signals. If you focus your attention on the right side of the chart, you can see that divergent rhetoric is now at its highest level since the taper tantrum in 2013 and when the FED reversed course in 2019 following a barrage of interest rate hikes (depicted by the purple lines being extremely low). Moreover, with the last 17 FED communications showing a further deterioration in “words of agreement,” taper talk should heat up even more over the next few months.
In conclusion, the PMs rallied on Jun. 21 and healed some of their wounds from the past week. And while a short-term bounce remains likely, it’s important to stay mindful of the medium-term catalysts that could pressure the PMs in the coming months. For example, while the front-end of the U.S. yield curve raced to new highs and trampled the PMs, the U.S. 10-Year Treasury yield failed to participate. And with the Treasury benchmark materially undervalued relative to realized inflation and U.S. GDP growth prospects, joining the party could add to the PMs’ troubles over the medium term.
Overview of the Upcoming Part of the Decline
- The corrective upswing seems to be over, and gold seems to have started its big decline – one similar to what we saw in 2008 and 2012-2013. We’re likely to see a short-term bounce, though.
- After miners slide in a meaningful and volatile way, but silver doesn’t (and it just declines moderately), I plan to switch from short positions in miners to short positions in silver. At this time, it’s too early to say at what price levels this would take place – perhaps with gold close to $1,600. I plan to exit those short positions when gold shows substantial strength relative to the USD Index, while the latter is still rallying. This might take place with gold close to $1,350 - $1,500 and the entire decline (from above $1,900 to about $1,475) would be likely to take place within 6-20 weeks, and I would expect silver to fall the hardest in the final part of the move. This moment (when gold performs very strongly against the rallying USD and miners are strong relative to gold – after gold has already declined substantially) is likely to be the best entry point for long-term investments, in my view. This might also happen with gold close to $1,475, but it’s too early to say with certainty at this time.
- As a confirmation for the above, I will use the (upcoming or perhaps we have already seen it?) top in the general stock market as the starting point for the three-month countdown. The reason is that after the 1929 top, gold miners declined for about three months after the general stock market started to slide. We also saw some confirmations of this theory based on the analogy to 2008. All in all, the precious metals sector would be likely to bottom about three months after the general stock market tops.
- The above is based on the information available today, and it might change in the following days/weeks.
Please note that the above timing details are relatively broad and “for general overview only” – so that you know more or less what I think and how volatile I think the moves are likely to be – on an approximate basis. These time targets are not binding or clear enough for me to think that they should be used for purchasing options, warrants or similar instruments.
Summary
To summarize, while the medium-term trend in the precious metals market remains down, it seems that we’re about to see a counter-trend rally shortly. In my opinion, gold is likely to be its main benefactor, and I plan to keep the long position intact only for the easy part of the rally. It could be over within a week, and I expect the big downswing to be resumed within the next 1-3 weeks.
After the sell-off (that takes gold to about $1,350 - $1,500), I expect the precious metals to rally significantly. The final part of the decline might take as little as 1-5 weeks, so it's important to stay alert to any changes.
Most importantly, please stay healthy and safe. We made a lot of money last March and this March, and it seems that we’re about to make much more on the upcoming decline, but you have to be healthy to enjoy the results.
As always, we'll keep you - our subscribers - informed.
By the way, we’re currently providing you with a possibility to extend your subscription by a year, two years or even three years with a special 20% discount. This discount can be applied right away, without the need to wait for your next renewal – if you choose to secure your premium access and complete the payment upfront. The boring time in the PMs is definitely over and the time to pay close attention to the market is here. Naturally, it’s your capital, and the choice is up to you, but it seems that it might be a good idea to secure more premium access now, while saving 20% at the same time. Our support team will be happy to assist you in the above-described upgrade at preferential terms – if you’d like to proceed, please contact us.
To summarize:
Trading capital (supplementary part of the portfolio; our opinion): Full speculative long positions (100% of the full position) in gold are justified from the risk to reward point of view with the following binding exit profit-take price levels:
Gold: binding profit-take exit price: $1,836; stop-loss: none
Alternatively, if one seeks leverage, we’re providing the binding profit-take levels for the UGL. The binding profit-take level for the UGL: $61.48; stop-loss for the UGL: none
Long-term capital (core part of the portfolio; our opinion): No positions (in other words: cash
Insurance capital (core part of the portfolio; our opinion): Full position
Whether you already subscribed or not, we encourage you to find out how to make the most of our alerts and read our replies to the most common alert-and-gold-trading-related-questions.
Please note that we describe the situation for the day that the alert is posted in the trading section. In other words, if we are writing about a speculative position, it means that it is up-to-date on the day it was posted. We are also featuring the initial target prices to decide whether keeping a position on a given day is in tune with your approach (some moves are too small for medium-term traders, and some might appear too big for day-traders).
Additionally, you might want to read why our stop-loss orders are usually relatively far from the current price.
Please note that a full position doesn't mean using all of the capital for a given trade. You will find details on our thoughts on gold portfolio structuring in the Key Insights section on our website.
As a reminder - "initial target price" means exactly that - an "initial" one. It's not a price level at which we suggest closing positions. If this becomes the case (like it did in the previous trade), we will refer to these levels as levels of exit orders (exactly as we've done previously). Stop-loss levels, however, are naturally not "initial", but something that, in our opinion, might be entered as an order.
Since it is impossible to synchronize target prices and stop-loss levels for all the ETFs and ETNs with the main markets that we provide these levels for (gold, silver and mining stocks - the GDX ETF), the stop-loss levels and target prices for other ETNs and ETF (among other: UGL, GLL, AGQ, ZSL, NUGT, DUST, JNUG, JDST) are provided as supplementary, and not as "final". This means that if a stop-loss or a target level is reached for any of the "additional instruments" (GLL for instance), but not for the "main instrument" (gold in this case), we will view positions in both gold and GLL as still open and the stop-loss for GLL would have to be moved lower. On the other hand, if gold moves to a stop-loss level but GLL doesn't, then we will view both positions (in gold and GLL) as closed. In other words, since it's not possible to be 100% certain that each related instrument moves to a given level when the underlying instrument does, we can't provide levels that would be binding. The levels that we do provide are our best estimate of the levels that will correspond to the levels in the underlying assets, but it will be the underlying assets that one will need to focus on regarding the signs pointing to closing a given position or keeping it open. We might adjust the levels in the "additional instruments" without adjusting the levels in the "main instruments", which will simply mean that we have improved our estimation of these levels, not that we changed our outlook on the markets. We are already working on a tool that would update these levels daily for the most popular ETFs, ETNs and individual mining stocks.
Our preferred ways to invest in and to trade gold along with the reasoning can be found in the how to buy gold section. Furthermore, our preferred ETFs and ETNs can be found in our Gold & Silver ETF Ranking.
As a reminder, Gold & Silver Trading Alerts are posted before or on each trading day (we usually post them before the opening bell, but we don't promise doing that each day). If there's anything urgent, we will send you an additional small alert before posting the main one.
Thank you.
Przemyslaw Radomski, CFA
Founder, Editor-in-chief

