

Briefly: in our opinion, full speculative short positions (250% of the regular position size) in gold, silver, and mining stocks are justified from the risk/reward point of view at the moment of publishing this Alert.
Gold miners plunged yesterday and silver broke to new 2020 lows in today's pre-market trading. Even though our short positions are only a week old, they are already very profitable.
Let's start today's analysis with an update on what we wrote yesterday with regard to the coronavirus scare.
Coronavirus and Gold Prices
In our previous analyses, we analyzed the interest in the Google searches for "coronavirus" which we used as a proxy for fear thereof. In the previous weeks we featured the chart below (courtesy of Google Trends) and we described it in the following way:
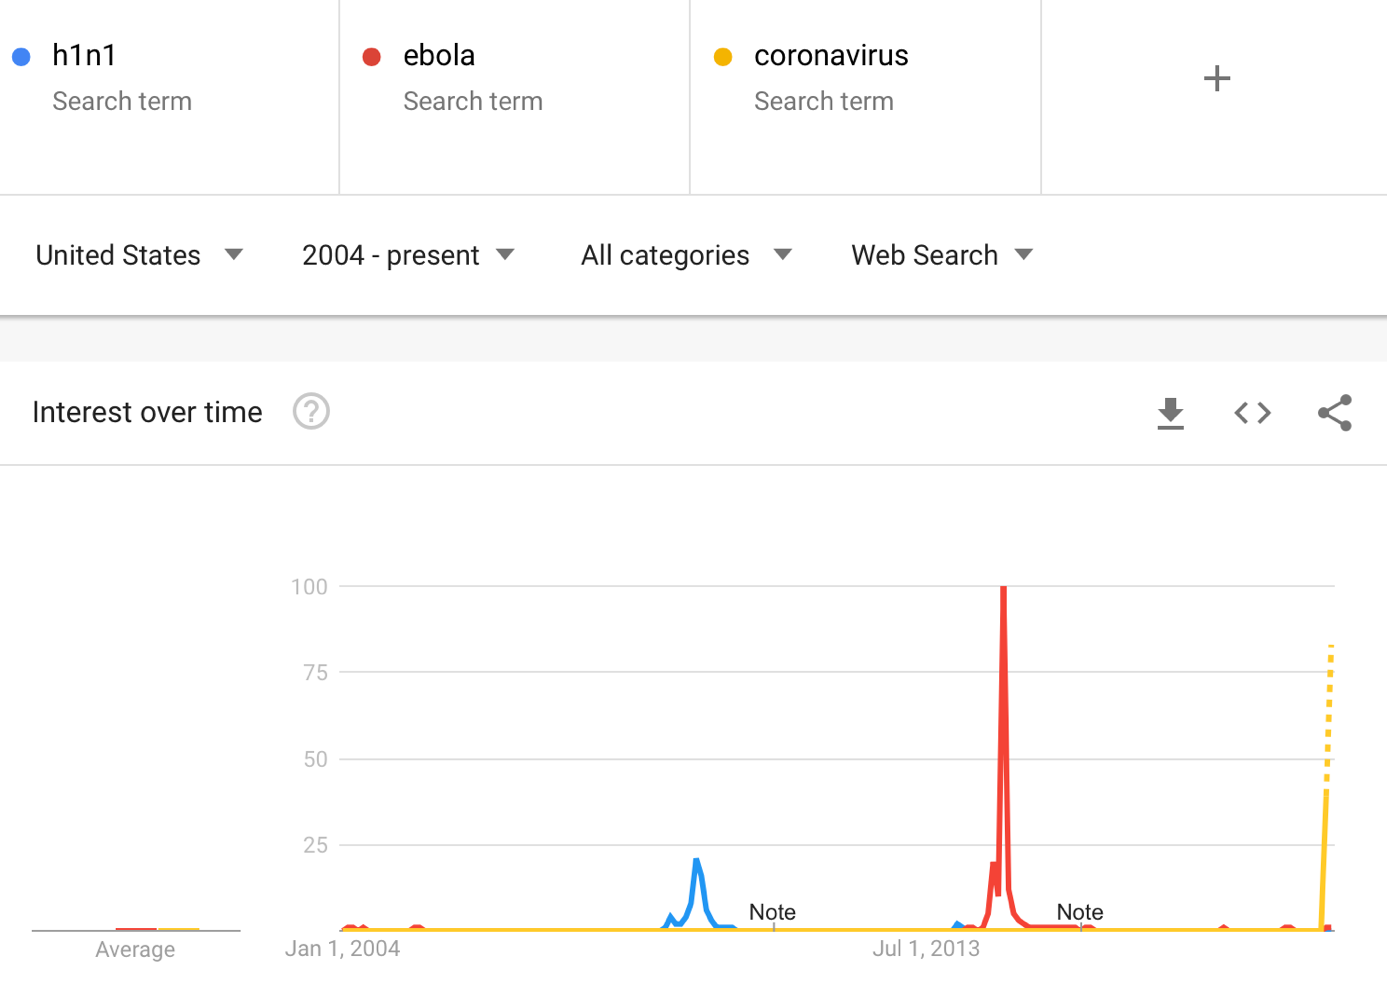
(...) at the 2014 peak, people were searching for ebola more than they are searching for coronavirus right now. It seems that people were more scared of ebola in 2014 than they are scared of the coronavirus right now.
Or - which is more likely true - the fear has not yet peaked this time.
Why would this be more likely? Because we should also take into account the increased usage of Internet worldwide as well as increased use of social media in general. It's becoming increasingly easier to share content, reactions, and emotions online. That's quite likely why the spike interest in ebola of 2014 is so much bigger than the spike in interest in h1n1 that we saw in 2008. Consequently, we can expect the coronavirus interest to peak at levels greater than those at which the ebola interest peaked in 2014.
And what's happening right now?
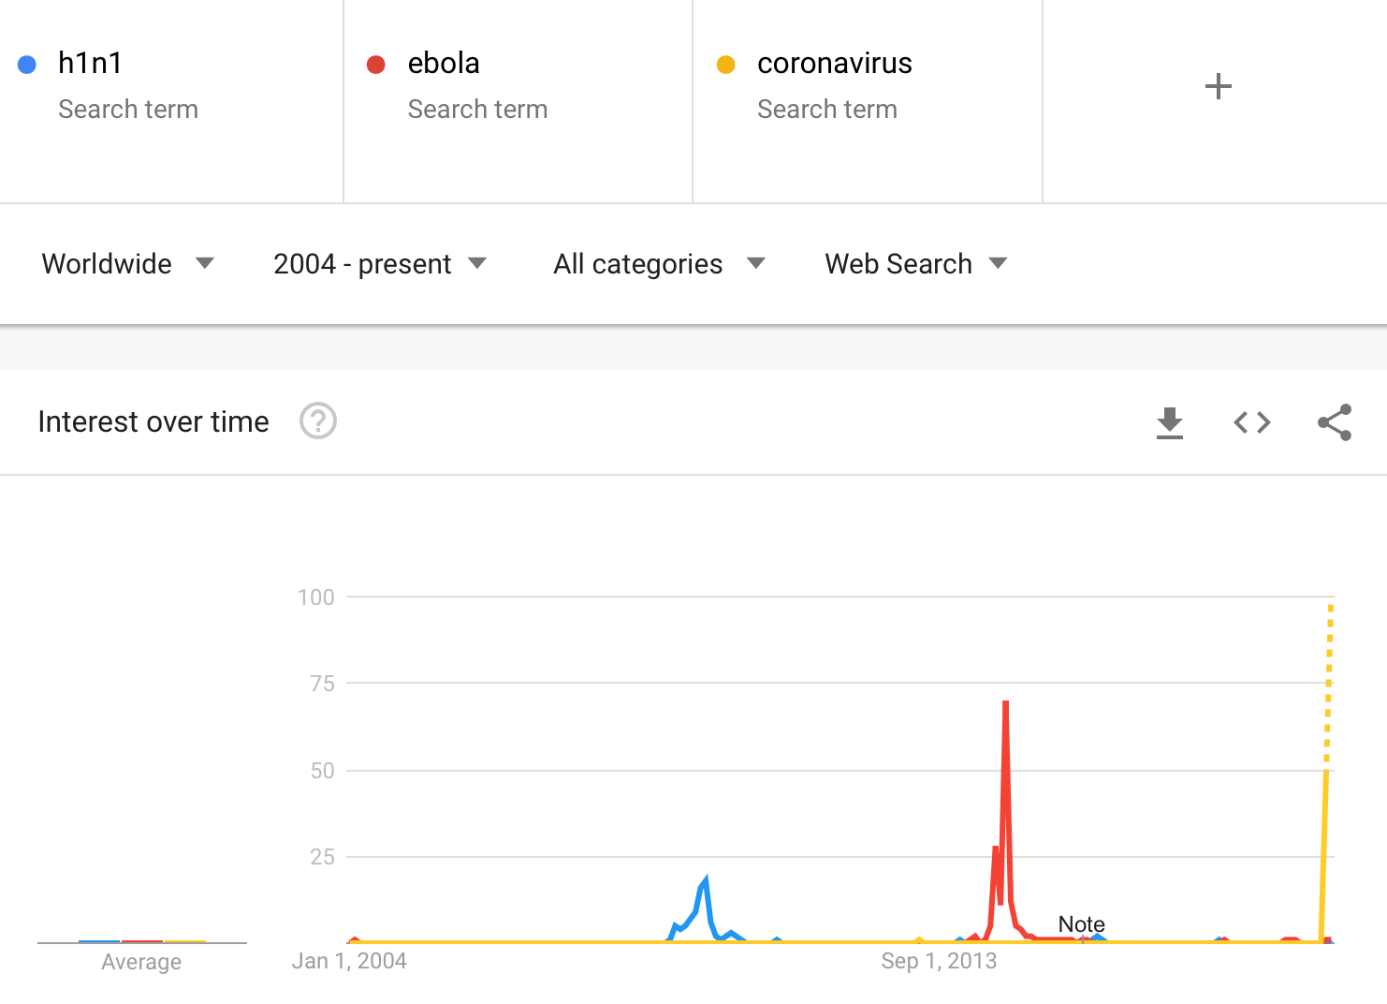
The projected search numbers for February are now much bigger than the ebola searches of 2014, just as we had indicated. This might be the peak, or we might still be ahead of it.
While the viruses are different, the fear of viruses is similar and the way people react to it, is also relatively similar - at least in case of capital markets. So, we can estimate how people might react right now, based on how they reacted to the ebola scare of 2014.
And how did gold react when the ebola scare was getting more serious, and what happened once the fear subsided? What did stocks and the USD Index do?
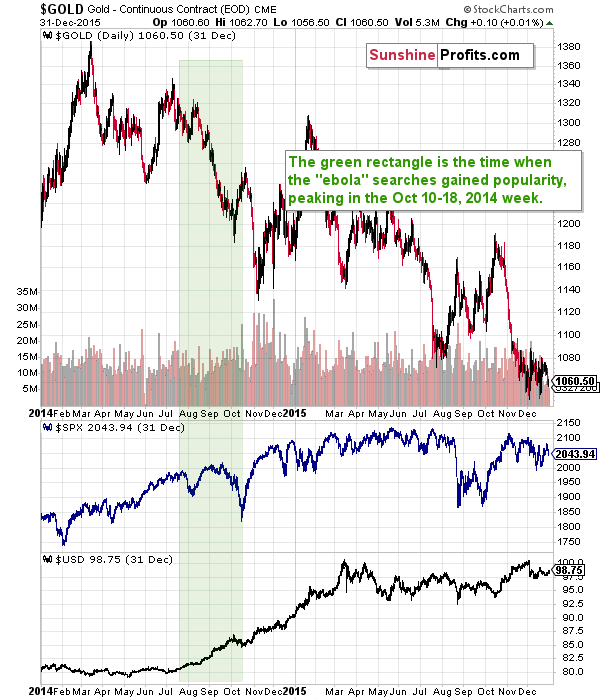
Gold price actually declined throughout most of the scare and only rallied during the final part of the scare - when the search interest for ebola peaked. There was also one small corrective upswing at the beginning of August.
The USD Index did the opposite - it was rallying for most of the time and only corrected in the final part of the scare.
The stock market, however, was very sensitive to the changes in ebola interest. Stock declined visibly, reacting clearly and strongly to both increases in ebola interest. During the peak interest, stocks declined about 10% from their previous 2014 high. So far, stocks have declined only about 3.3% from their recent high. And they rallied to new highs after the initial downswing.
Gold moved higher by about 6% in the final corrective upswing and it took about 2 weeks.
The USD Index declined about 2.6% at that time, which was 29% of the preceding short-term upswing.
Fast forward to the current situation. Gold moved up by over 7% (the upswing took about 2.5 weeks), the stock market declined over 12% (including today's pre-market decline in the S&P 500 futures) from its recent peak and the USD Index corrected about 1.5%. That's about 40% of the preceding short-term upswing.
The moves are not identical, but they have just become extremely similar. In fact, the current reaction is bigger, which is not that surprising, given the likely bigger economic impact of the COVID-2019 compared to ebola in 2014.
This means that the markets might have already reached their tipping points (gold) or are about to do so (stocks, USD Index).
Based on how the stock market and the USD Index performed recently, the odds that the coronavirus scare has already peaked, have increased substantially. This also means that the factor that likely caused gold to soar recently is already over or about to be over. This further confirms the bearish outlook for the precious metals market in both the short and medium term.
Please note that the USD Index moved to the lower border of our previous target area - to the combination of the rising support line and the 38.2 Fibonacci retracement level. It even moved slightly below the latter.
USD Index, Silver and Stocks
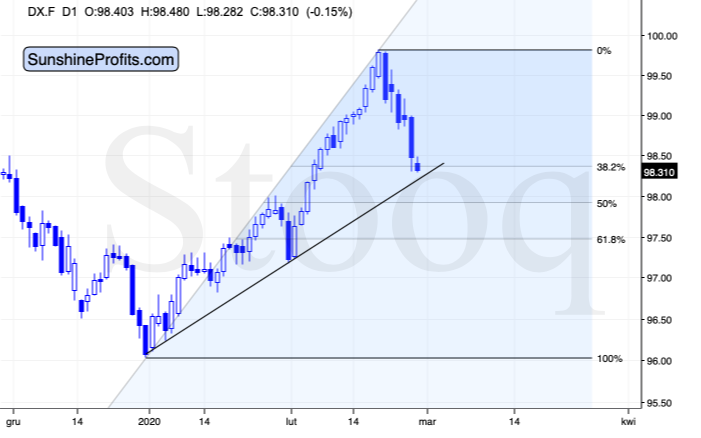
This means that the bottom for the USDX might be at hand... Which means that the precious metals sector is likely to get another push lower. In fact, silver is already declining substantially in today's pre-market trading.
On February 20, we wrote the following:
During the final part of the ebola scare, gold moved higher by about 6% temporarily, before declining. Applying this to the latest local low ($1,536.40) provides us with $1,628.58 - about $1,630 as the next likely target.
The viruses are not identical, but the way people are afraid of them is similar. Thus, the way in which they aim to protect themselves may be similar as well. Still, that's more of a ballpark estimate than a precise target.
The targets are more precise in case of silver and mining stocks. They are simply likely to move to the previous 2020 highs. Since both broke above their late-January highs in terms of the closing prices, it the 2020 highs become the next strong resistance that would stop the rally.
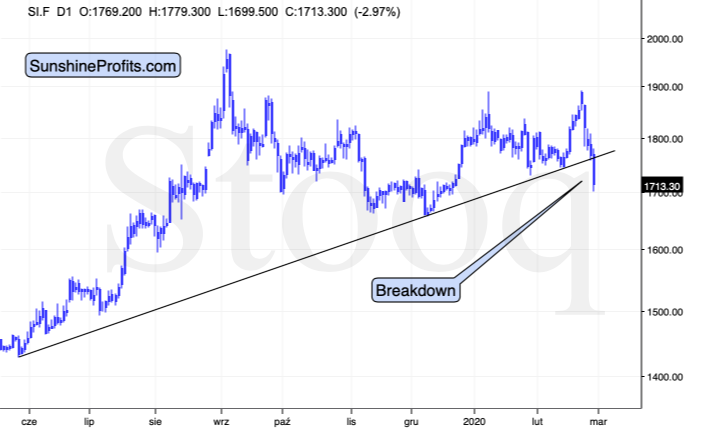
Silver did exactly that (and miners moved higher for just 2 days after reaching their previous 2020 highs). It took just a few days for silver to slide to new yearly lows and to break below the rising medium-term support line. And the USD Index rally hasn't even resumed just yet.
Since we are discussing the impact of other markets, let's take a moment to consider the general stock market.
Taking into account today's pre-market slide, the S&P 500 futures are down almost 13% this week. That's profound, because we haven't seen this kind of weekly decline for more than a decade. In fact, the last time that we saw a bigger weekly decline, was during the 2008-2009 slide. And you know what happened to stocks, metals, and miners back then.
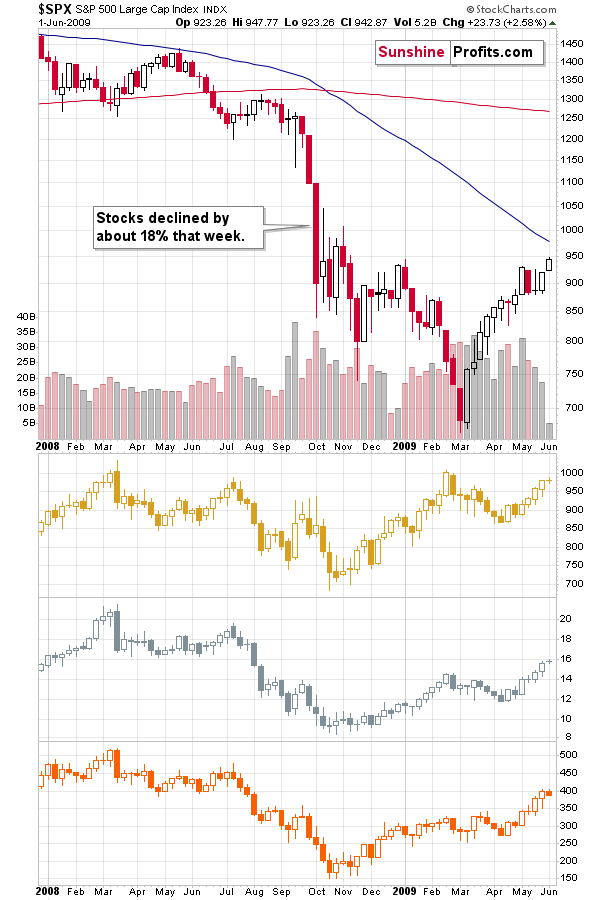
They all fell very hard. In particular, silver and mining stocks were hit with enormous force. We've been writing for months that silver has been repeating it's 2008 performance with respect to its price movement and we now see a hint from the stock market that the 2008-style slide might already be taking place right now.
The Lessons from 2008
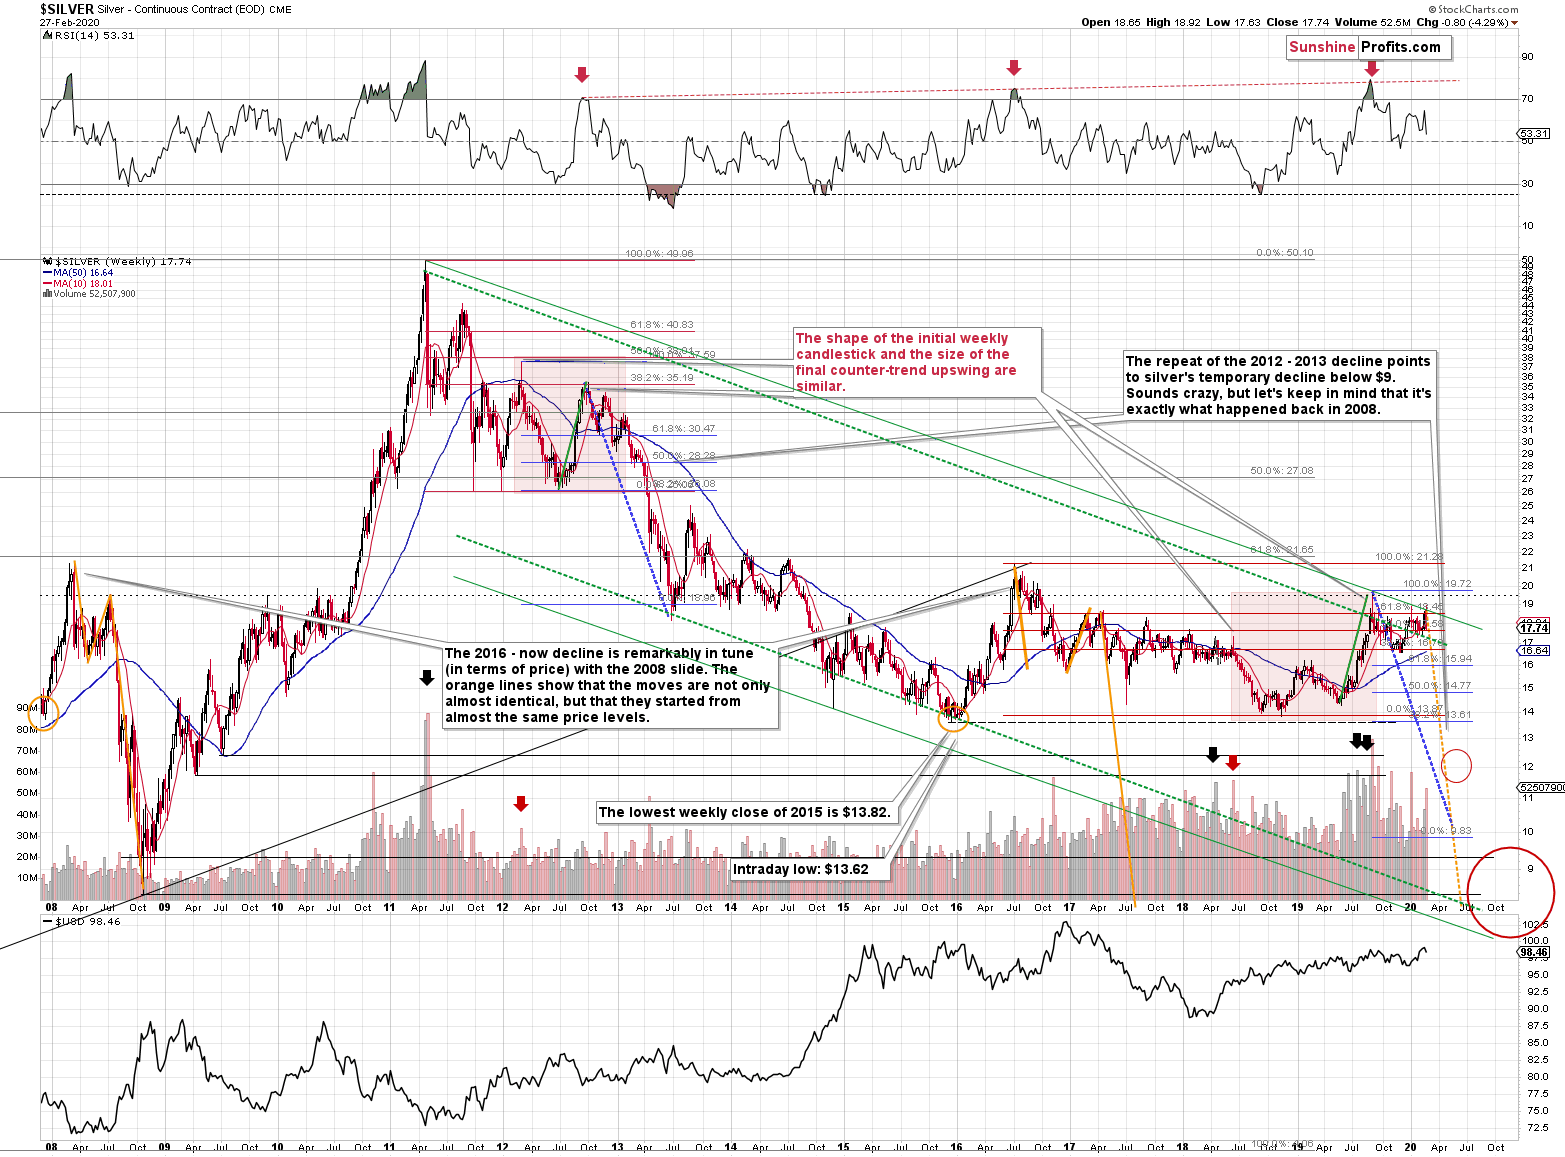
Please note that the even the starting prices of the 2008 slide and the most recent high are very similar. The orange lines emphasize the similarity. We will discuss them more thoroughly in Monday's analysis. For now, let's get back to the stock market's volatility and the 2008 analogy.
In 2008, the S&P 500 fell about 18% during one week, so this move was much bigger than the one that we're seeing this week (at least so far - the week is not over, after all). And the current slide is how the decline actually started, while back in 2008, we saw it more or less in the middle of the move.
This means that the 2008 analogy should be viewed as approximate, and not like a 1:1 copy. Back in 2008, the 18% weekly decline meant a few-week long pause within the decline. Right now, it's unclear if we'll see one at this time. We could, as the stock market is approaching its support in the form of August and October lows. On the other hand, the momentum is so strong that the decline could easily extend into the next week or longer, before we see any meaningful rebound.
Moving back to the big picture, let's keep in mind what happened on the currency front in 2008, as it's in prefect tune with what we've been describing as the likely medium-term outlook for the USD Index. If the USD Index is going to soar similarly to how it soared in 2008 (which is not that unlikely), gold could decline profoundly. And with declining stock market, silver and miners are likely to be hit with double strength.
Summary
Summing up, the big decline in the precious metals market seems to have just begun. The sizes of declines in mining stocks and silver certainly suggest that - especially the ease, with which the white metal moved to new yearly lows. It seems that our profitable short positions will become even more profitable soon.
As always, we'll keep you - our subscribers - informed.
To summarize:
Trading capital (supplementary part of the portfolio; our opinion): Full speculative short positions (250% of the full position) in gold, silver, and mining stocks are justified from the risk/reward perspective with the following stop-loss orders and binding exit profit-take price levels:
- Gold futures: profit-take exit price: $1,422; stop-loss: $1,712; initial target price for the DGLD ETN: $33.30; stop-loss for the DGLD ETN: $19.88
- Silver futures: profit-take exit price: $16.11; stop-loss: none (if gold moved to $1,712 we would view silver positions as no longer valid); initial target price for the DSLV ETN: $20.68; stop-loss for the DSLV ETN: none (if gold moved to $1,712 we would view silver positions as no longer valid)
- Mining stocks (price levels for the GDX ETF): profit-take exit price: $20.22; stop-loss: $33.11; initial target price for the DUST ETF: $11.29; stop-loss for the DUST ETF $3.48
In case one wants to bet on junior mining stocks' prices, here are the stop-loss details and target prices:
- GDXJ ETF: profit-take exit price: $28.32; stop-loss: $50.22
- JDST ETF: profit-take exit price: $20.97; stop-loss: $5.18
Long-term capital (core part of the portfolio; our opinion): No positions (in other words: cash)
Insurance capital (core part of the portfolio; our opinion): Full position
Whether you already subscribed or not, we encourage you to find out how to make the most of our alerts and read our replies to the most common alert-and-gold-trading-related-questions.
Please note that the in the trading section we describe the situation for the day that the alert is posted. In other words, it we are writing about a speculative position, it means that it is up-to-date on the day it was posted. We are also featuring the initial target prices, so that you can decide whether keeping a position on a given day is something that is in tune with your approach (some moves are too small for medium-term traders and some might appear too big for day-traders).
Plus, you might want to read why our stop-loss orders are usually relatively far from the current price.
Please note that a full position doesn't mean using all of the capital for a given trade. You will find details on our thoughts on gold portfolio structuring in the Key Insights section on our website.
As a reminder - "initial target price" means exactly that - an "initial" one, it's not a price level at which we suggest closing positions. If this becomes the case (like it did in the previous trade) we will refer to these levels as levels of exit orders (exactly as we've done previously). Stop-loss levels, however, are naturally not "initial", but something that, in our opinion, might be entered as an order.
Since it is impossible to synchronize target prices and stop-loss levels for all the ETFs and ETNs with the main markets that we provide these levels for (gold, silver and mining stocks - the GDX ETF), the stop-loss levels and target prices for other ETNs and ETF (among other: UGLD, DGLD, USLV, DSLV, NUGT, DUST, JNUG, JDST) are provided as supplementary, and not as "final". This means that if a stop-loss or a target level is reached for any of the "additional instruments" (DGLD for instance), but not for the "main instrument" (gold in this case), we will view positions in both gold and DGLD as still open and the stop-loss for DGLD would have to be moved lower. On the other hand, if gold moves to a stop-loss level but DGLD doesn't, then we will view both positions (in gold and DGLD) as closed. In other words, since it's not possible to be 100% certain that each related instrument moves to a given level when the underlying instrument does, we can't provide levels that would be binding. The levels that we do provide are our best estimate of the levels that will correspond to the levels in the underlying assets, but it will be the underlying assets that one will need to focus on regarding the signs pointing to closing a given position or keeping it open. We might adjust the levels in the "additional instruments" without adjusting the levels in the "main instruments", which will simply mean that we have improved our estimation of these levels, not that we changed our outlook on the markets. We are already working on a tool that would update these levels on a daily basis for the most popular ETFs, ETNs and individual mining stocks.
Our preferred ways to invest in and to trade gold along with the reasoning can be found in the how to buy gold section. Additionally, our preferred ETFs and ETNs can be found in our Gold & Silver ETF Ranking.
As a reminder, Gold & Silver Trading Alerts are posted before or on each trading day (we usually post them before the opening bell, but we don't promise doing that each day). If there's anything urgent, we will send you an additional small alert before posting the main one.
Thank you.
Sincerely,
Przemyslaw Radomski, CFA
Editor-in-chief, Gold & Silver Fund Manager

