

Briefly: in our opinion, full (300% of the regular position size) speculative short positions in mining stocks are justified from the risk/reward point of view at the moment of publishing this Alert.
Now, that’s what a major short-term reversal looks like!
If there was one sentence to summarize yesterday’s session, it would be the above. Not only did gold, silver, and mining stocks – all – reverse in a profound manner but also we saw multiple signs which further confirmed the critical nature of this price performance. Namely, the USD Index bounced off its 38.2% Fibonacci retracement once again, and gold stocks once again underperformed gold.
And speaking of underperformance, the most profound thing was that all the above happened despite a piece of news that could have (should have?) made gold rally. The ADP Nonfarm Employment Change was surprisingly negative (only 330K vs. 695K expected), which indicated that the upcoming (to be released tomorrow) Nonfarm Payrolls will also be negative. This makes investors think that the Fed might be more dovish, or be just as dovish, but for longer. In other words, it makes tapering less likely. Consequently, it was something bullish for gold and gold rallied, but only for a few hours. It then took less than an hour for the entire intraday rally to be erased.
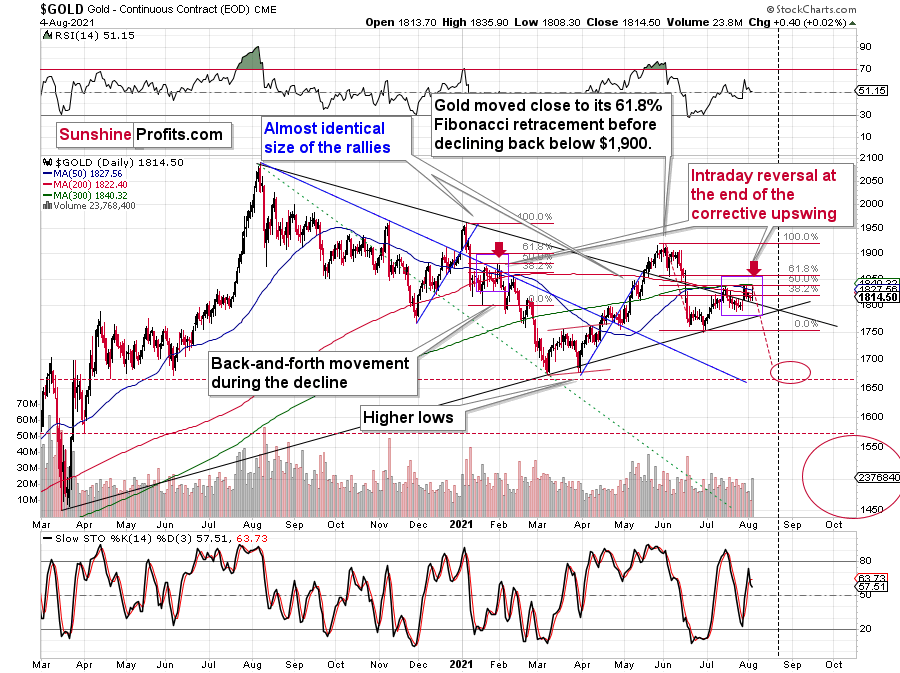
What seemed like a possible game-changer turned out to be a clear sell signal. The reversal was clear, and the accompanying volume was much higher than what we saw in the past few days. Consequently, it should be treated as an important move.
Why would that happen? You already know the answer. Because gold wants to move lower, not higher! More precisely, because gold is repeating its past performance, which implies that a bigger move lower, not higher is next. In yesterday’s analysis, I replied to a question about gold’s performance compared to what’s going on in the treasury yields and in the USD Index, and my explanation of gold’s relative performance (or lack of thereof) remains up-to-date. We can also see that gold managed to ignore a piece of news that was actually bullish.
Gold’s reversal despite positive news is very bearish on its own. The fact that it was accompanied by multiple bearish confirmations makes it even more bearish.
In yesterday’s analysis, I wrote the following about silver’s performance relative to gold:
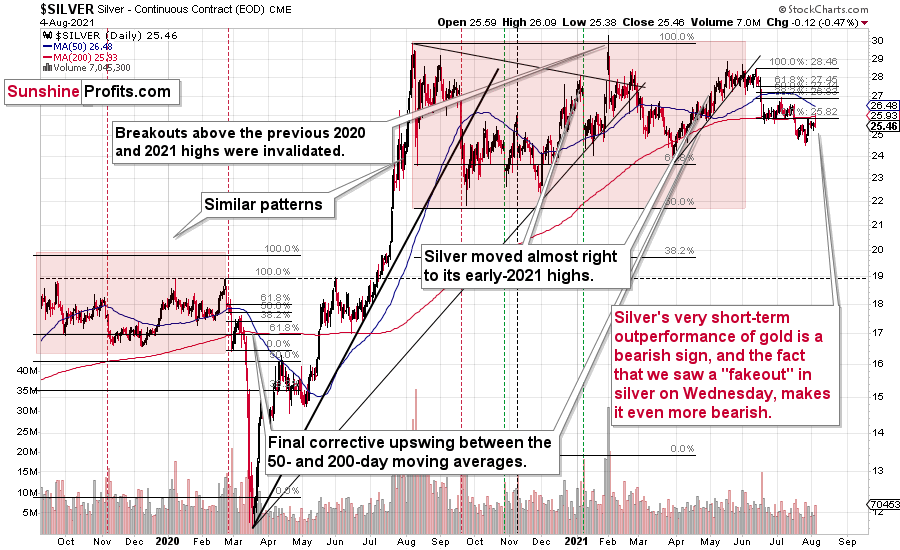
Silver moved higher as well, and while this move was relatively insignificant in nominal and percentage terms (+0.78%), it was much bigger than what we saw in gold (+0.22%); the difference is crystal-clear when we compare today’s pre-market moves to the most recent short-term highs in both precious metals.
Silver moved to its recent short-term high while gold is not even close to being halfway back up. This means that on a very short-term basis, silver is clearly outperforming gold.
This is also what tends to happen shortly before significant declines across the precious metals sector.
Now, the sizes of both moves were not that significant, so this performance could also be more or less random, and, if that was the case, the outperformance would be just accidental. Consequently, it’s not a game-changing signal in terms of its importance. It is something that’s on top of multiple other indications that we have, and the most important ones are not of a short-term nature at all. The long-term self-similarities in gold and the HUI Index (gold stocks) are the true key to understanding where the precious metals sector is likely to head next, and you already know about those, as I described them thoroughly on Monday.
The above is very much up-to-date. Not only did the early indications prove to be correct, but we actually saw a fresh sell signal in the form of silver’s “fakeout”.
The white metal appeared to be moving back above its June lows, but it was quickly hammered back down, and it ended the session a bit lower. Invalidations of breakouts are very bearish, and silver is known for breaking above certain resistance levels very briefly (without analogous action in gold and gold stocks) only to invalidate them shortly – and it usually happens right before significant moves to the downside.
The implications are clearly bearish, and, more importantly, it’s not the only confirmation that gold received.
The Gold Miners
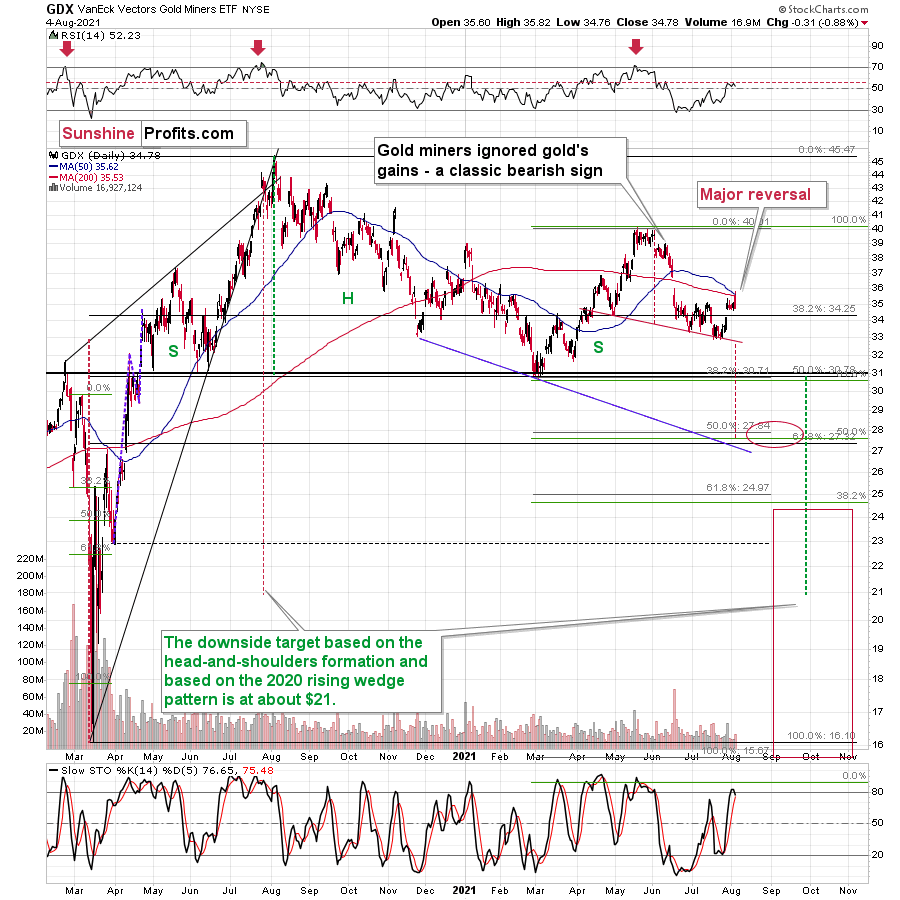
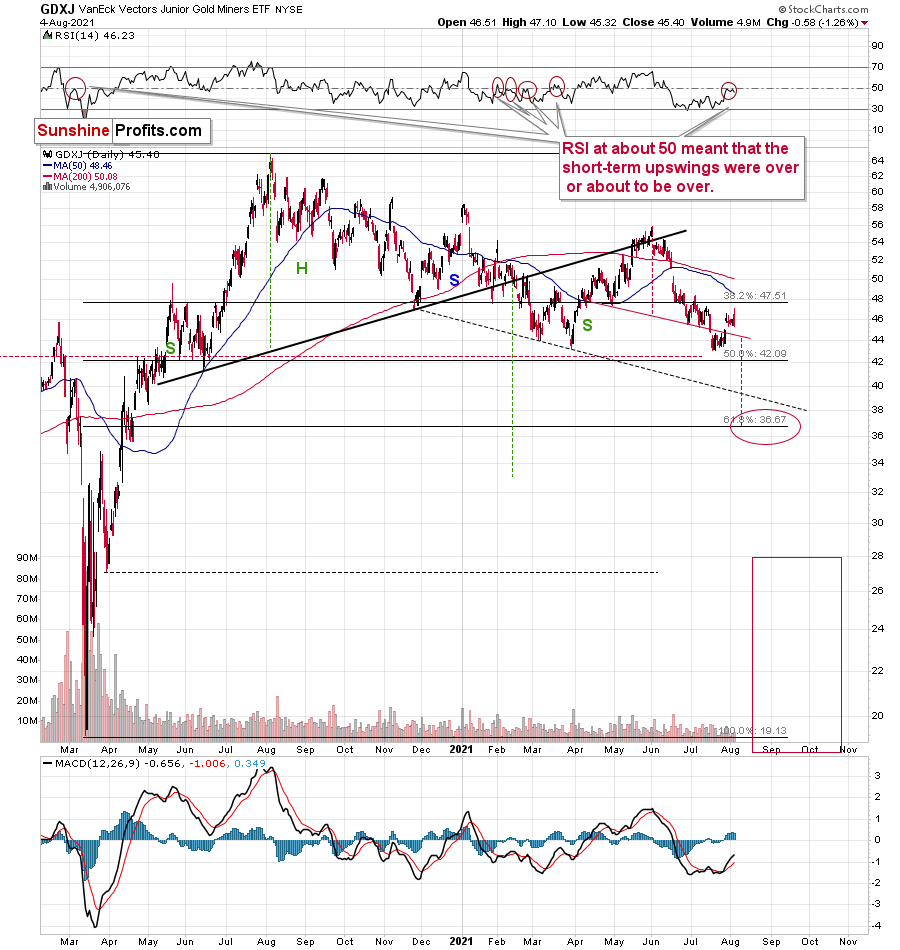
Despite the early move higher in the miners, their climb was invalidated. Both seniors (GDX) and juniors (GDXJ) ended yesterday’s session lower. This means that we saw sell signals from both ETFs based on their reversals, as well as one general sell signal based on the miners’ underperformance of gold (which ended yesterday’s session slightly higher).
Please note that both mining stock ETFs’ RSI indicators are at the levels that triggered short-term reversals in the past. In particular, please note that the RSI based on the GDXJ formed specific double tops before junior miners started their short-term declines (late February and March 2021). Based on yesterday’s reversal, we saw exactly the same thing once again. The implications are bearish.
And while the precious metals sector seems to have topped, the USD Index seems to have found its bottom at its 38.2% Fibonacci retracement.
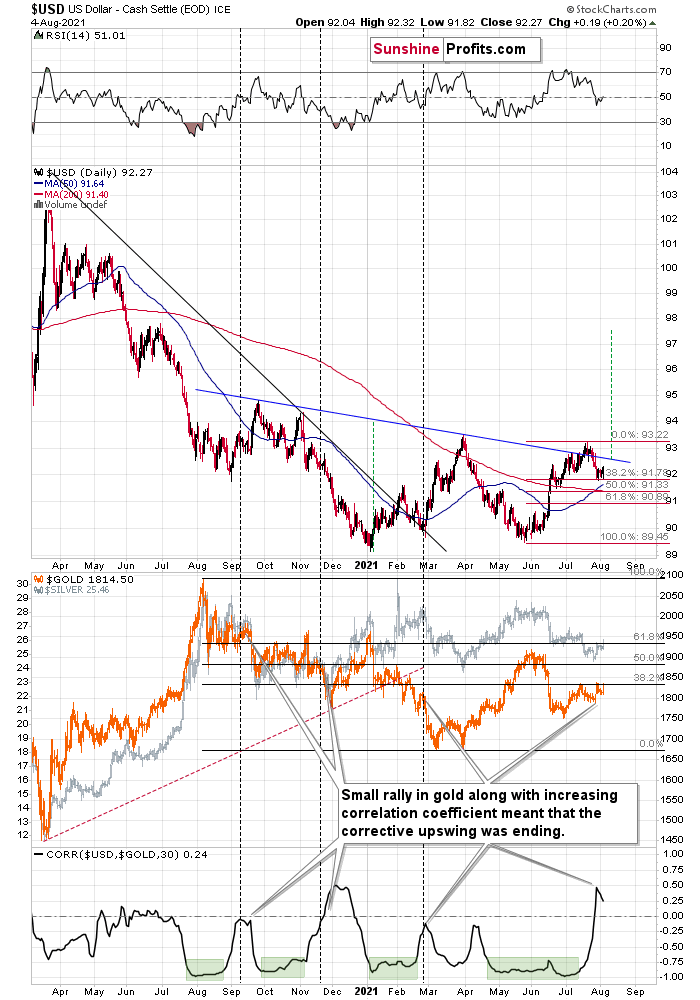
After another move lower on an intraday basis, the USDX ended the day slightly higher. It seems that the short-term bottom might already be in (I’m not ruling out a move to the 50% retracement though) and that the next attempt to break above the blue declining resistance line will be successful. That resistance line is particularly important, as it’s the neck level of the broad inverse head-and-shoulders pattern with the upside target close to 98. Naturally, such a move would be likely to have devastating consequences for the precious metals sector.
Having said that, let’s take a look at the markets from a more fundamental angle.
A Deer in the Headlights
With the U.S. 10-Year Treasury yield stuck in mud and inflation expectations forging ahead, the U.S. 10-Year real yield continues to make new lows. And while the development is extremely bullish for the PMs, the metals have largely followed the real yield lower (especially gold mining stocks). Moreover, with their trepidation a sign of extreme weakness, the drastic underperformance highlights the anxiety that dampens our medium-term outlook.
Please see below:
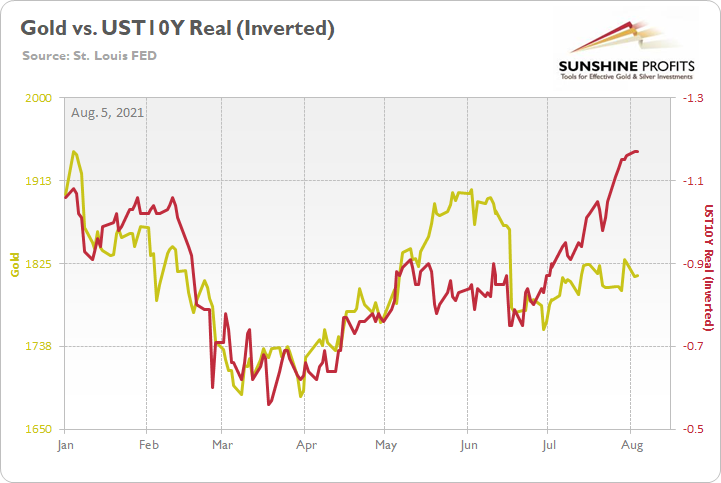
To explain, the gold line above tracks the London Bullion Market Association (LBMA) Gold Price, while the red line above tracks the inverted U.S. 10-Year real yield. For context, inverted means that the latter’s scale is flipped upside down and that a rising red line represents a falling U.S. 10-Year real yield, while a falling red line represents a rising U.S. 10-Year real yield. More importantly, though, if gold tracked the U.S. 10-Year real yield perfectly, the yellow metal would be trading at roughly $1,950. Thus, why is gold scared to make the logical leap higher?
To explain, I wrote on Jul. 30:
Knowing that one shouldn’t put all of his eggs in one basket, betting the farm on the U.S. 10-Year Treasury yield would be investing malpractice. That’s why self-similar patterns, ratios, technical indicators, the relative behavior of the gold miners, the USD Index and the FED’s taper timeline are all prudently considered when forming our investment thesis.
Regarding the former, I’ve highlighted in great detail how the 2008 and 2012-2013 analogues are mirroring today’s price action, how the HUI Index and the GDXJ ETF remain drastic underperformers, and how the yellow metal’s long-term MACD indicator still elicits a clear sell signal.
Regarding the latter, the PMs are spooked by several fundamental forces. For one, the U.S. 10-Year Treasury yield is trading at an all-time low relative to realized inflation and the Treasury benchmark still demonstrates its largest-ever divergence from the U.S. 10-Year breakeven inflation rate. In a nutshell: the bond market is signaling that inflation is “transitory,” economic growth is slowing and that the U.S. Federal Reserve (FED) will likely cut interest rates. However, it’s important to remember that two different paths can lead to the same destination.
To explain, I added on Jul. 30:
If inflation turns out to be a paper tiger, a profound decline in inflation expectations would have the same negative impact on the PMs as a sharp rise in the U.S. 10-Year Treasury yield.
Please see below:
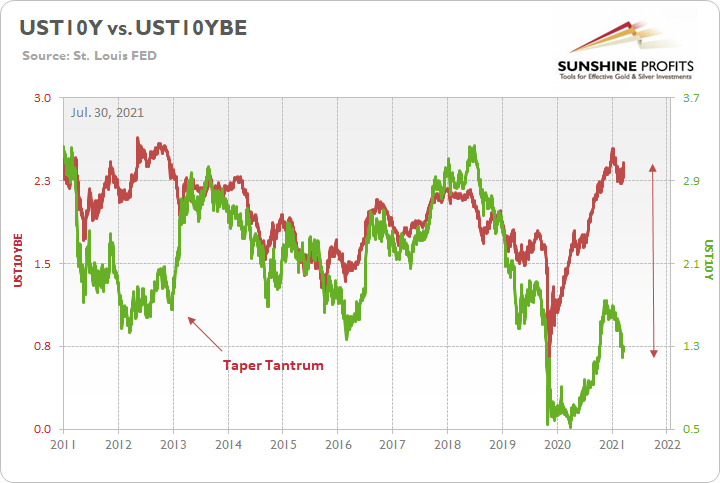
To explain, the green line above tracks the U.S. 10-Year Treasury yield, while the red line above tracks the U.S. 10-Year breakeven inflation rate. If you analyze the gap on the right side of the chart, it’s a decoupling of the ages. However, while the two lines are destined to reconnect at some point, if the red line falls off of a cliff, the impact on the PMs would likely mirror the 2013 taper tantrum. For context, gold fell by more than $500 in less than six months during the event.
And why should we expect a similar outcome? Well, with the PMs ignoring the all-time imbalance, it really doesn’t matter how the two lines reconnect. If the bond market proves prescient and inflation evaporates, the PMs will likely suffer as the red line falls precipitously and investors’ inflationary bets unwind. For context, we believe that inflation will be much stickier and that rising U.S. nominal yields are the most likely outcome. However, if the doomsday scenario unfolds, not only will the PMs suffer mightily (especially the gold miners), but a profound drawdown of U.S. equities will likely supercharge the selling pressure.
Let Me Go!
In the meantime, though, while the U.S. 10-Year real yield has been imploring the PMs to jump, the USD Index has been weighing them down.
Please see below:
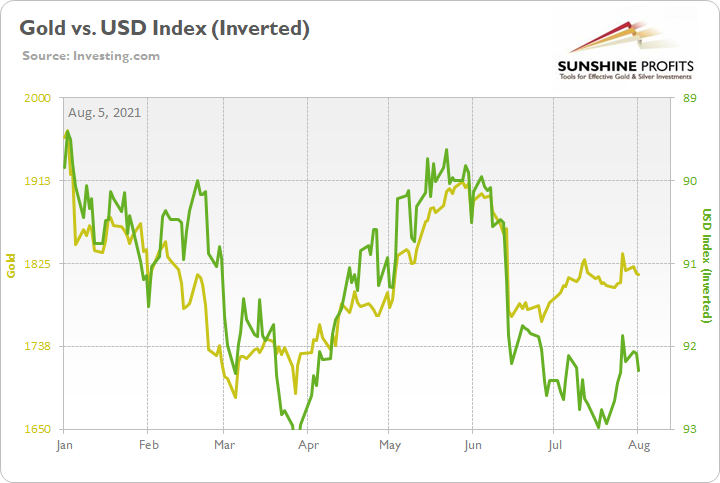
To explain, the gold line above tracks the gold futures price, while the green line above tracks the inverted (scale flipped upside down) USD Index. Contrasting the U.S. 10-Year real yield, the USD Index implies a gold futures price of roughly $1,710. As a result, the conflicting forces have the yellow metal in a state of paralysis, and that’s why it’s so important to analyze a myriad of fundamental factors.
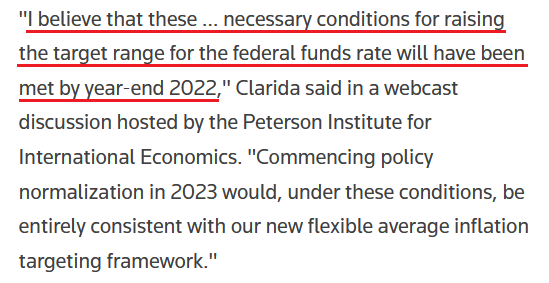
To that point, with the FED’s taper timeline also keeping the PMs in check, the hawks were out in full force on Aug. 4. Case in point: FED Vice Chairman Richard Clarida said that he could "certainly" see a taper announcement "later this year” and admitted that “the risks to my outlook for inflation are to the upside."
He added:
 Source: Reuters
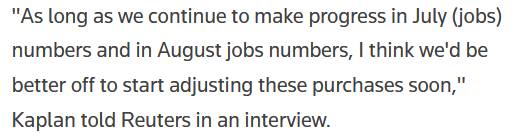
For context, investors originally expected liftoff in late 2024 and “year-end 2022” is quite a hawkish shift. What’s more, Dallas FED President Robert Kaplan said on Aug. 4 that “I question, today, the efficacy of these purchases" and that the FED should scale back its bond-buying program "soon."
Please see below:
 Source: Reuters
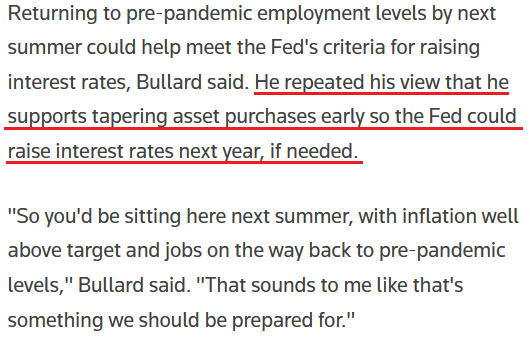
Making three of a kind, St. Louis FED President James Bullard also said on Aug. 4 that inflation could range between 2.5% and 3% in 2022 and that “[inflation] is going to come down, but not as fast as what many people have in mind."
Please see below:
 Source: Reuters
For context, the Centers for Disease Control’s (CDC) extension of the U.S. eviction moratorium will likely decrease some of the inflationary momentum. With the Shelter Consumer Price Index (CPI) accounting for more than 30% of the movement of the headline CPI, surging rents may not be fully reflected until later in the fall. However, similar to how enhanced unemployment benefits reduce the U.S. labor market’s short-term momentum, the policy is only delaying the inevitable.
The Main Catalyst
Expanding on the FED’s taper timeline, the central bank’s hawkish rhetoric has also kept a lid on gold prices. And while a weak U.S. nonfarm payrolls print could result in ‘PMs up, USD Index down,’ the metals are unlikely to gain any real traction unless the FED changes its tune.
Please see below:
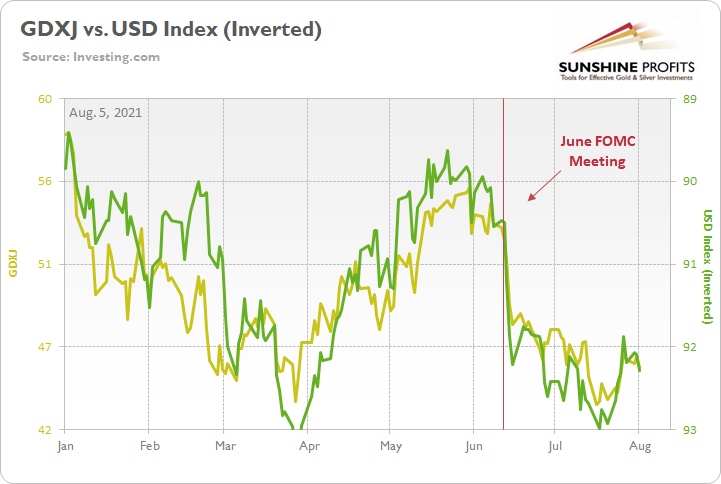
To explain, the gold line above tracks the GDXJ ETF (our short position), while the green line above tracks the inverted (again, scale flipped upside down) USD Index. If you analyze the relationship, the junior miners have been under immense pressure since the FED turned hawkish in mid-June, while the USD Index has regained its mojo. Thus, unless the FED delivers a complete 180, the trend is likely to continue.
Finally, while the FED’s taper timeline is the most important fundamental catalyst that’s impacting the financial markets, I warned previously that the central bank’s daily reverse repurchase agreements are analogous to a reduction in QE (though they don’t have the same psychological effect). And with the FED selling nearly $932 billion worth of reverse repos on Aug. 4, the liquidity drain continues to accelerate.
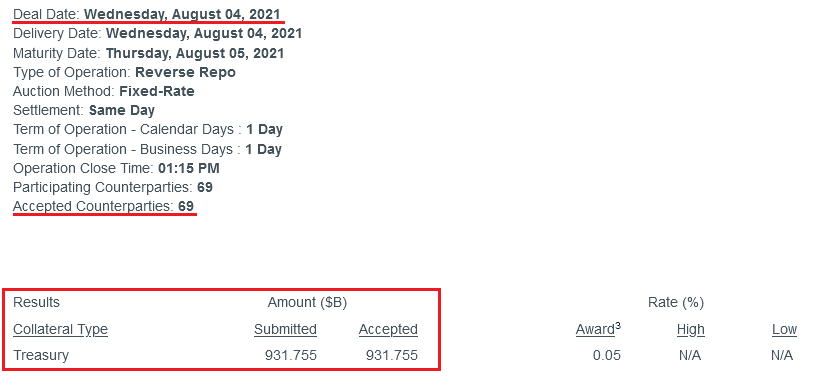 Source: New York FED
In conclusion, with the FED’s hawkish rhetoric rattling the financial markets, the PMs remain in no man’s land. And while plunging U.S. real yields are a source of optimism, the FED’s daily reverse repos (which more than offset the ~$120 billion per month of QE), its taper timeline and the resurgent USD Index far outweigh the bullish catalyst. To that point, while a weak U.S. nonfarm payrolls print may elicit a short-term bounce on Aug. 6, the optimism will likely fade once reality reemerges (like what happened in the days following FED Chairman Jerome Powell’s press conference on Jul. 28). The bottom line? While gold has held up quite well, the drastic underperformance of gold mining stocks still signals lower lows over the medium term.
Overview of the Upcoming Part of the Decline
- The biggest corrective upswing in gold might already be over, and it seems that we won’t have to wait long for the current small correction to end either.
- After miners slide in a meaningful and volatile way, but silver doesn’t (and it just declines moderately), I plan to switch from short positions in miners to short positions in silver. At this time, it’s too early to say at what price levels this would take place – perhaps with gold close to $1,600. I plan to exit those short positions when gold shows substantial strength relative to the USD Index, while the latter is still rallying. This might take place with gold close to $1,350 - $1,500 and the entire decline (from above $1,900 to about $1,475) would be likely to take place within 6-20 weeks, and I would expect silver to fall the hardest in the final part of the move. This moment (when gold performs very strongly against the rallying USD and miners are strong relative to gold – after gold has already declined substantially) is likely to be the best entry point for long-term investments, in my view. This might also happen with gold close to $1,475, but it’s too early to say with certainty at this time.
- As a confirmation for the above, I will use the (upcoming or perhaps we have already seen it?) top in the general stock market as the starting point for the three-month countdown. The reason is that after the 1929 top, gold miners declined for about three months after the general stock market started to slide. We also saw some confirmations of this theory based on the analogy to 2008. All in all, the precious metals sector would be likely to bottom about three months after the general stock market tops.
- The above is based on the information available today, and it might change in the following days/weeks.
Please note that the above timing details are relatively broad and “for general overview only” – so that you know more or less what I think and how volatile I think the moves are likely to be – on an approximate basis. These time targets are not binding or clear enough for me to think that they should be used for purchasing options, warrants or similar instruments.
Summary
To summarize, it seems that the bigger corrective upswing in gold might already be over and that we won’t have to wait for the current small correction to end, either. While the next few days may (!) bring temporarily higher prices, it’s unlikely that they will hold. In particular, just as mining stocks had local corrections that didn’t change the nature of the huge medium-term declines in 2008 and 2012-2013, it’s unlikely that the current local correction will change anything.
It seems that our profits on the short position in the junior mining stocks are going to grow substantially in the following weeks.
After the sell-off (that takes gold to about $1,350 - $1,500), I expect the precious metals to rally significantly. The final part of the decline might take as little as 1-5 weeks, so it's important to stay alert to any changes.
Most importantly, please stay healthy and safe. We made a lot of money last March and this March, and it seems that we’re about to make much more on the upcoming decline, but you have to be healthy to enjoy the results.
As always, we'll keep you - our subscribers - informed.
To summarize:
Trading capital (supplementary part of the portfolio; our opinion): Full speculative short positions (300% of the full position) in mining stocks are justified from the risk to reward point of view with the following binding exit profit-take price levels:
Mining stocks (price levels for the GDXJ ETF): binding profit-take exit price: $37.12; stop-loss: none (the volatility is too big to justify a stop-loss order in case of this particular trade)
Alternatively, if one seeks leverage, we’re providing the binding profit-take levels for the JDST (2x leveraged) and GDXD (3x leveraged – which is not suggested for most traders/investors due to the significant leverage). The binding profit-take level for the JDST: $15.96; stop-loss for the JDST: none (the volatility is too big to justify a SL order in case of this particular trade); binding profit-take level for the GDXD: $37.02; stop-loss for the GDXD: none (the volatility is too big to justify a SL order in case of this particular trade).
For-your-information targets (our opinion; we continue to think that mining stocks are the preferred way of taking advantage of the upcoming price move, but if for whatever reason one wants / has to use silver or gold for this trade, we are providing the details anyway.):
Silver futures upside profit-take exit price: unclear at this time - initially, it might be a good idea to exit, when gold moves to $1,683
Gold futures upside profit-take exit price: $1,683
HGD.TO – alternative (Canadian) inverse 2x leveraged gold stocks ETF – the upside profit-take exit price: $12.88
Long-term capital (core part of the portfolio; our opinion): No positions (in other words: cash
Insurance capital (core part of the portfolio; our opinion): Full position
Whether you already subscribed or not, we encourage you to find out how to make the most of our alerts and read our replies to the most common alert-and-gold-trading-related-questions.
Please note that we describe the situation for the day that the alert is posted in the trading section. In other words, if we are writing about a speculative position, it means that it is up-to-date on the day it was posted. We are also featuring the initial target prices to decide whether keeping a position on a given day is in tune with your approach (some moves are too small for medium-term traders, and some might appear too big for day-traders).
Additionally, you might want to read why our stop-loss orders are usually relatively far from the current price.
Please note that a full position doesn't mean using all of the capital for a given trade. You will find details on our thoughts on gold portfolio structuring in the Key Insights section on our website.
As a reminder - "initial target price" means exactly that - an "initial" one. It's not a price level at which we suggest closing positions. If this becomes the case (like it did in the previous trade), we will refer to these levels as levels of exit orders (exactly as we've done previously). Stop-loss levels, however, are naturally not "initial", but something that, in our opinion, might be entered as an order.
Since it is impossible to synchronize target prices and stop-loss levels for all the ETFs and ETNs with the main markets that we provide these levels for (gold, silver and mining stocks - the GDX ETF), the stop-loss levels and target prices for other ETNs and ETF (among other: UGL, GLL, AGQ, ZSL, NUGT, DUST, JNUG, JDST) are provided as supplementary, and not as "final". This means that if a stop-loss or a target level is reached for any of the "additional instruments" (GLL for instance), but not for the "main instrument" (gold in this case), we will view positions in both gold and GLL as still open and the stop-loss for GLL would have to be moved lower. On the other hand, if gold moves to a stop-loss level but GLL doesn't, then we will view both positions (in gold and GLL) as closed. In other words, since it's not possible to be 100% certain that each related instrument moves to a given level when the underlying instrument does, we can't provide levels that would be binding. The levels that we do provide are our best estimate of the levels that will correspond to the levels in the underlying assets, but it will be the underlying assets that one will need to focus on regarding the signs pointing to closing a given position or keeping it open. We might adjust the levels in the "additional instruments" without adjusting the levels in the "main instruments", which will simply mean that we have improved our estimation of these levels, not that we changed our outlook on the markets. We are already working on a tool that would update these levels daily for the most popular ETFs, ETNs and individual mining stocks.
Our preferred ways to invest in and to trade gold along with the reasoning can be found in the how to buy gold section. Furthermore, our preferred ETFs and ETNs can be found in our Gold & Silver ETF Ranking.
As a reminder, Gold & Silver Trading Alerts are posted before or on each trading day (we usually post them before the opening bell, but we don't promise doing that each day). If there's anything urgent, we will send you an additional small alert before posting the main one.
Thank you.
Przemyslaw Radomski, CFA
Founder, Editor-in-chief

