

Briefly: in our opinion, full (300% of the regular position size) speculative short positions in mining stocks are justified from the risk/reward point of view at the moment of publishing this Alert.
In my previous analyses, I wrote about the possibility of seeing another move higher in gold, and that it wouldn’t last long – if we saw it at all. I also wrote that mining stocks would likely disappoint, just as they did in 2012. And what happened yesterday was in tune with the above.
Namely, gold did move higher, but only on a very temporary basis.
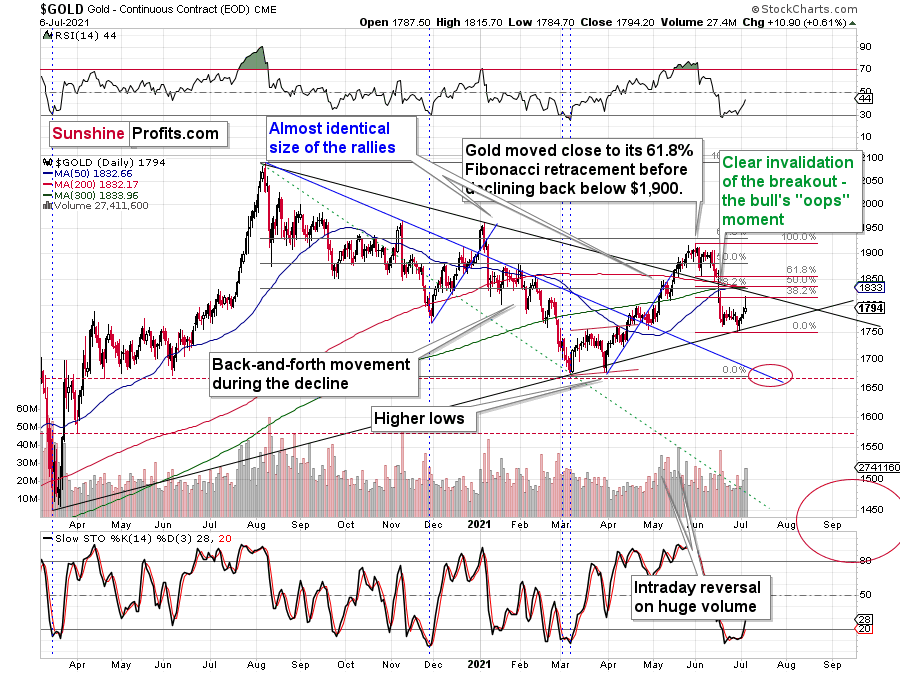
In fact, the rally ended even before the closing bell, as gold futures reversed their course and ended the session only $10.90 higher (after being even ~$20 higher intraday). This price action created a bearish reversal candlestick called the shooting star. Such candlesticks tend to be important if they form on relatively big volume. And indeed, yesterday’s volume was relatively big, which means that the implications are bearish.
Well, they were bearish even before yesterday’s session, but seeing confirmations adds credibility to the bearish narrative.
Another detail that serves as a bearish confirmation is the performance of the mining stocks.
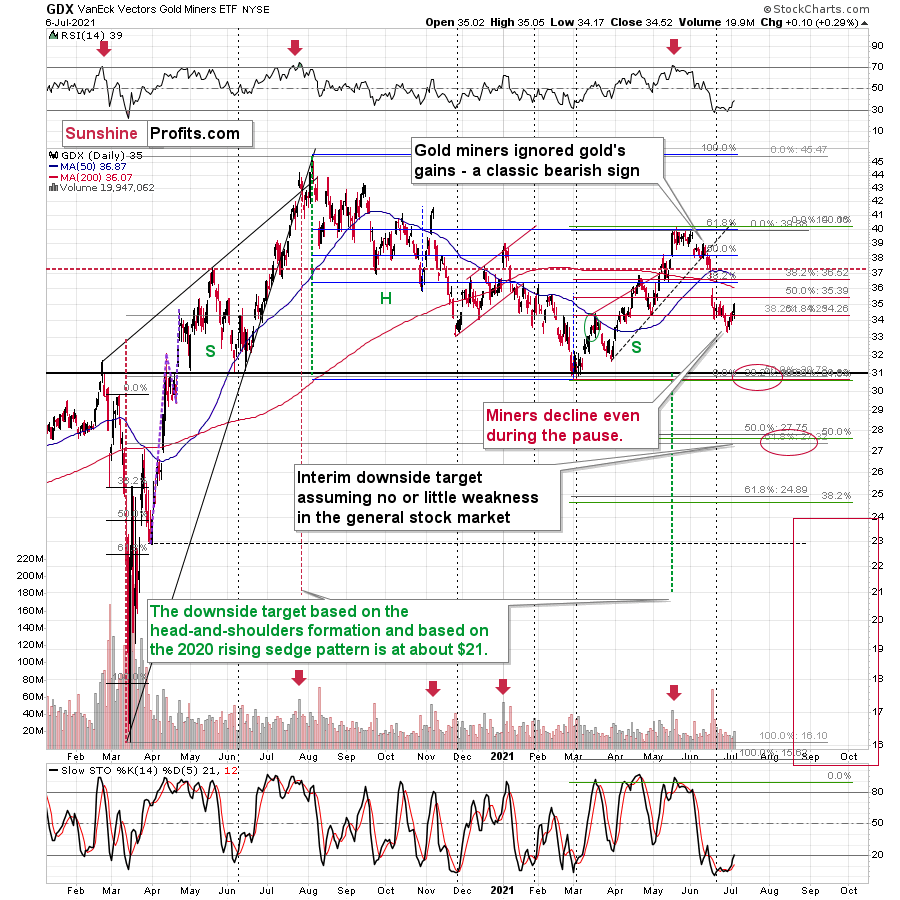
The senior gold stocks were barely up yesterday. Unlike gold, they didn’t move above their recent intraday highs (which is exactly what happened in 2012 at the end of the corrective upswing).
By the way, back then, gold corrected to its 61.8% Fibonacci retracement, and this time it moved slightly above the 38.2% retracement (intraday) before declining.
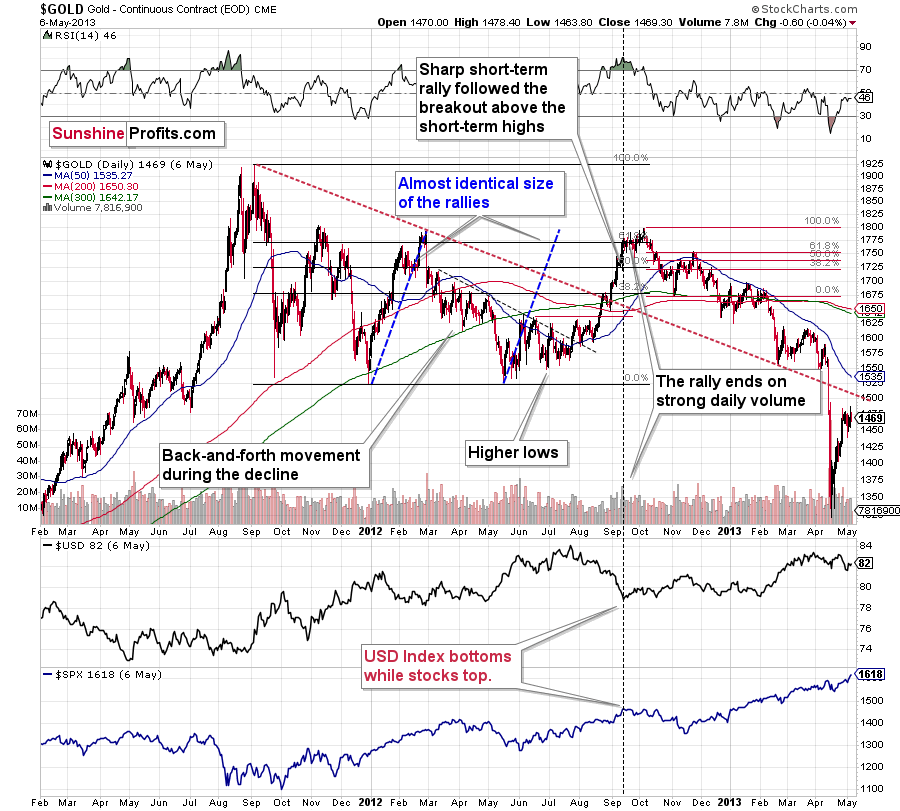
This time the market is weaker, but the similarity between both periods remains intact.
Getting back to the mining stocks, while senior miners moved slightly higher, junior miners declined. This is most clearly visible on the 4-hour chart.
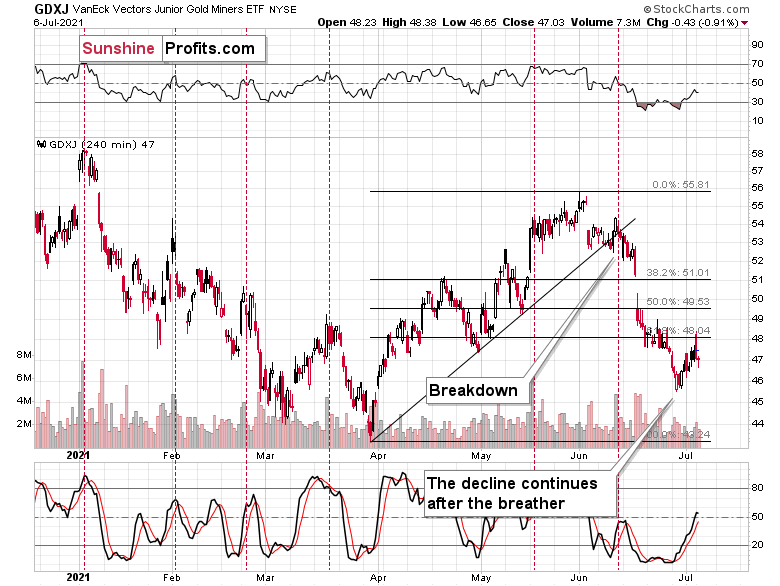
After an intraday attempt to rally back above its recent low, the GDXJ turned south once again and ended the session lower.
I’ve already written why the junior mining stocks’ bearish potential is bigger than the one of the senior miners, and yesterday’s session provides yet another confirmation.
Hence, the outlook remains bearish.
Silver and the USDX
Let’s keep in mind the sell signal from silver too. Quoting yesterday’s analysis:
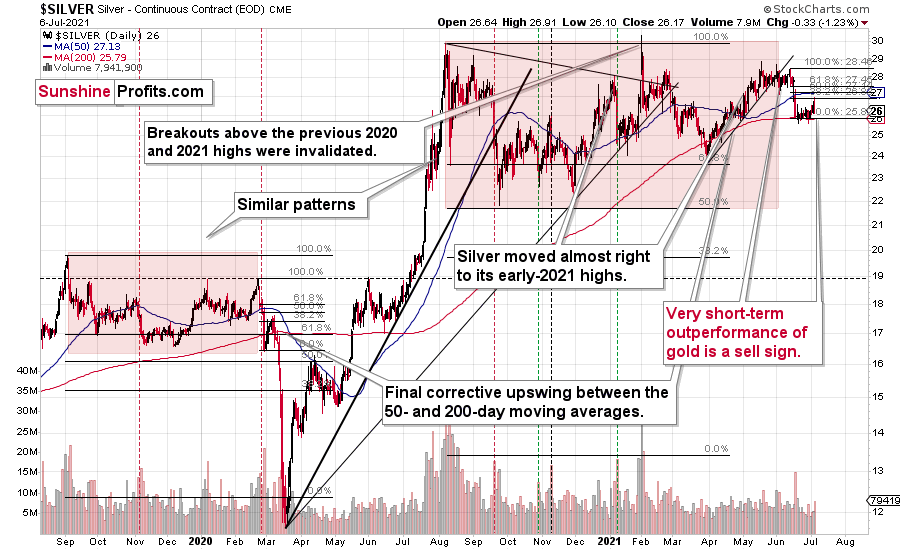
As further evidence, with silver outperforming gold, the behavior often serves as a prerequisite to significant tops. As a result, the white metal’s outward strength on Friday (silver rallied by $0.40 while gold gained only $6.50) has extremely bearish undertones and the 2012 analogue remains the most likely predictor of silver’s medium-term path.
Silver ended yesterday’s session lower but not before rallying. The above-mentioned sell signal remains intact.
The situation in the USD Index is quite specific as well.
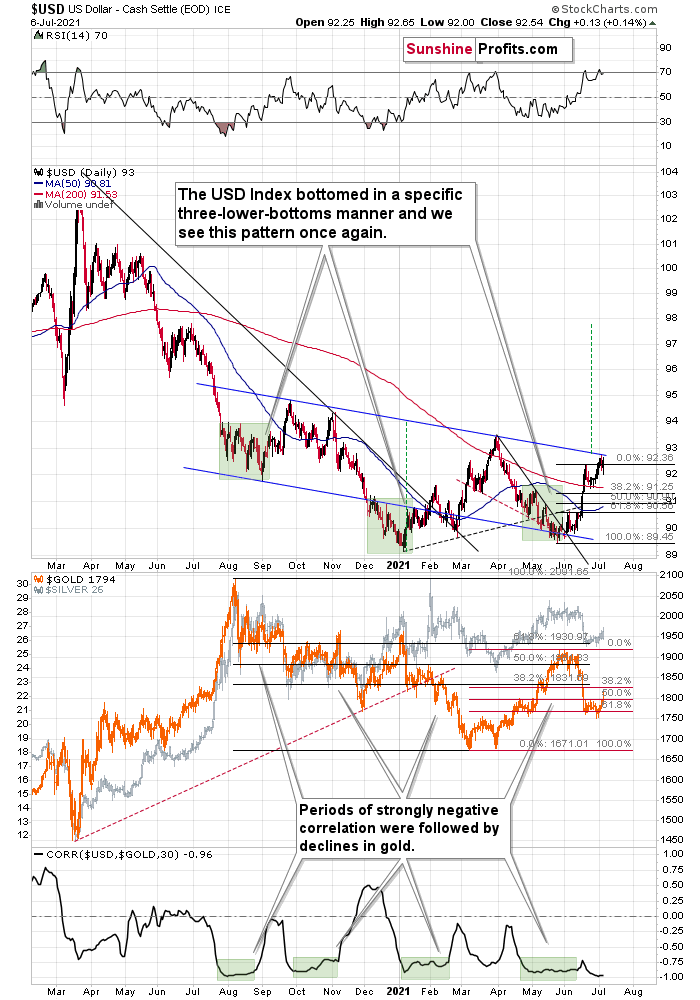
On one hand, we have a situation in which the USDX is just below the medium-term resistance line, so it suggests some difficulty in moving higher from here. On the other hand, we see that the USDX already corrected yesterday and rallied back up immediately. This could be a sign that it’s ready to break above the neck level of the pattern. This would be a major development as the target based on the head and shoulders pattern is equal to the size of the head (I marked it with green, dashed lines). The breakout here would, therefore, imply a move to about 98 –approximately the late June 2020 highs.
Naturally, the above would be very bearish for gold and the rest of the precious metals sector.
It seems quite likely that the USD Index will break higher, if not soon, then shortly. And when that happens, gold will likely slide to its previous 2021 lows. That’s when we might see a short-term rebound before a huge price plunge to $1,500 or lower.
Having said that, let’s take a look at the market from the fundamental angle.
What Could Go Wrong?
With U.S. equity markets suffering a slight bout of volatility on Jul. 6, the narrative quickly shifted from ‘economic boom’ to ‘peak everything.’ However, while the U.S. economy remains on the up and up, the general stock market is nowhere near its fundamental value. Case in point: as investors throw caution to the wind and assume that traditional valuation metrics no longer matter, the euphoria has gone where no man has gone before.
Please see below:
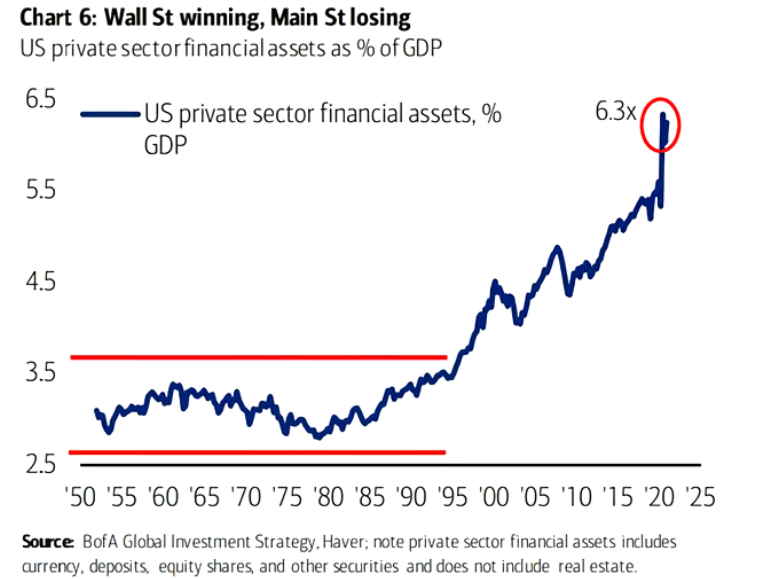
To explain, the blue line above tracks U.S. private sector financial assets as a percentage of the U.S. GDP. If you analyze the right side of the chart, you can see that never before has U.S. corporate and household wealth been more dependent on the performance of the financial markets.
To that point, while the dot-com bubble set the standard for exuberance, Big Tech’s concentration is even greater now than it was then.
Please see below:
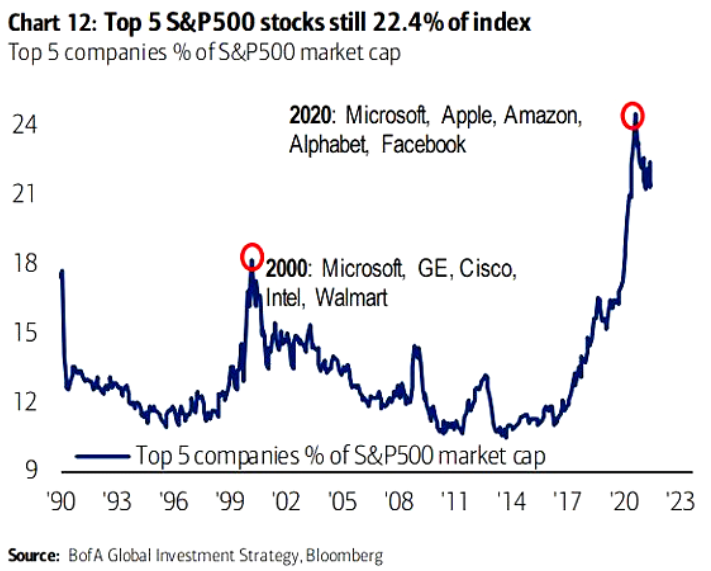
To explain, the five largest companies in the S&P 500 accounted for roughly 18% of the index’s market cap at the height of the dot-com bubble. Interestingly, while the figure has declined from its 2020 peak, Microsoft, Apple, Amazon, Alphabet, and Facebook still account for 22.4% of the S&P 500’s market cap. Thus, with rationality nearly extinct, retail investors are increasingly willing to pay any price on any day of the week.
To that point, with retail’s fervor becoming bolder by the day, the amount of new money flowing into the general stock market makes the dot-com bubble look like child’s play.
Please see below:
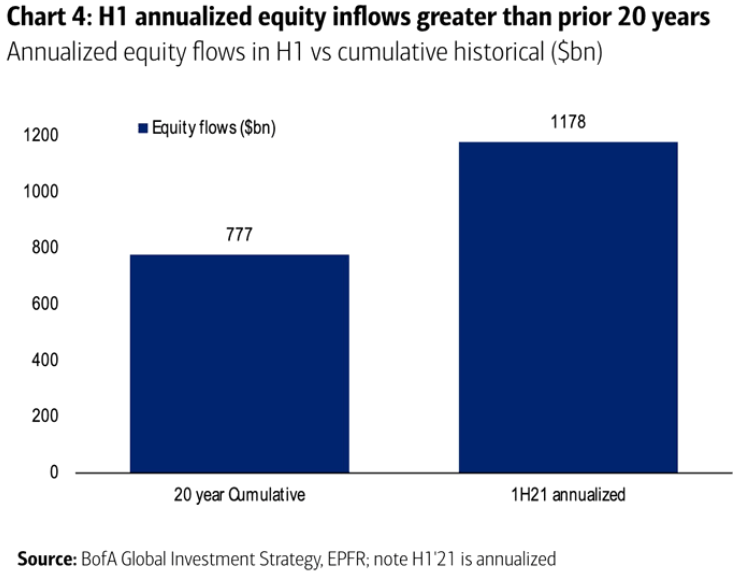
To explain, if you compare the two blue bars above, you can see that annualized equity inflows during the first half of 2021 were actually greater than the prior 20 years combined. However, if the ‘buy everything’ trade comes undone, it could be a long way down before U.S. equities find fundamental support.
As further evidence, TD Ameritrade revealed on Jul. 6 that its Investor Movement Index (IMX) rose by 9% month-over-month (MoM) and hit its “Highest Point on Record in June.” For context, “The IMX is TD Ameritrade’s proprietary, behavior-based index, aggregating Main Street investor positions and activity to measure what investors were actually doing and how they were positioned in the markets.”
Please see below:
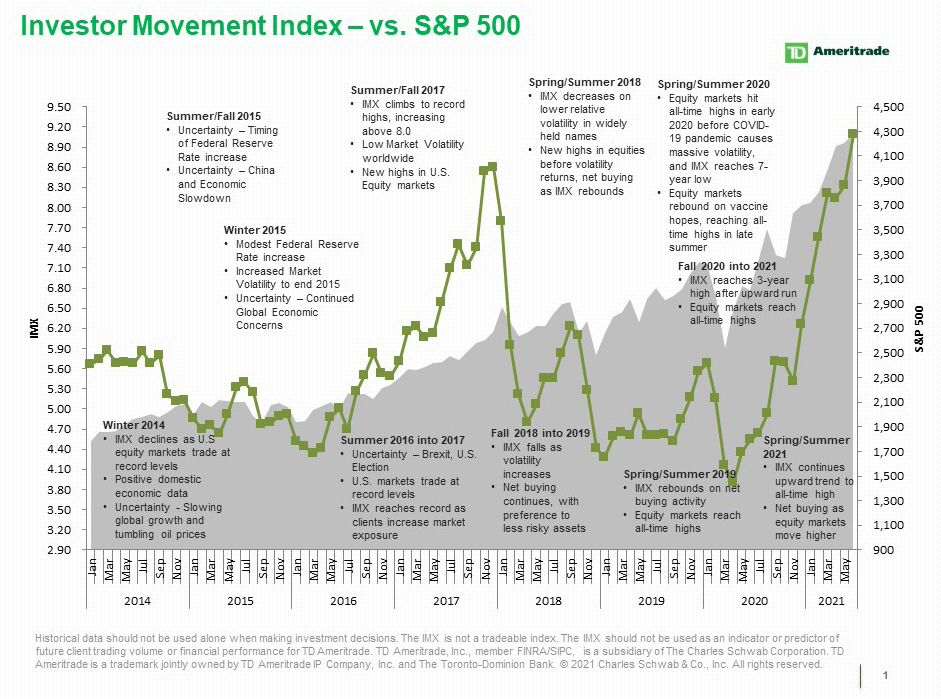 To explain, the green line above tracks TD Ameritrade’s IMX, while the shaded gray area above tracks the S&P 500. If you analyze the relationship, you can see that excessively high readings in the IMX often coincide with peaks in the S&P 500. Moreover, if you focus your attention on the right side of the chart, you can see that both variables are at unprecedented heights.
Market Exaltation Spreads Further
If that wasn’t enough, the U.S. stock market’s performance relative to U.S. Treasures has also reached euphoric levels. For example, the U.S. equity-bond ratio is more than two standard deviations above its 30+ year average, and investors have pushed the imbalance well beyond the dot-com bubble peak.
Please see below:
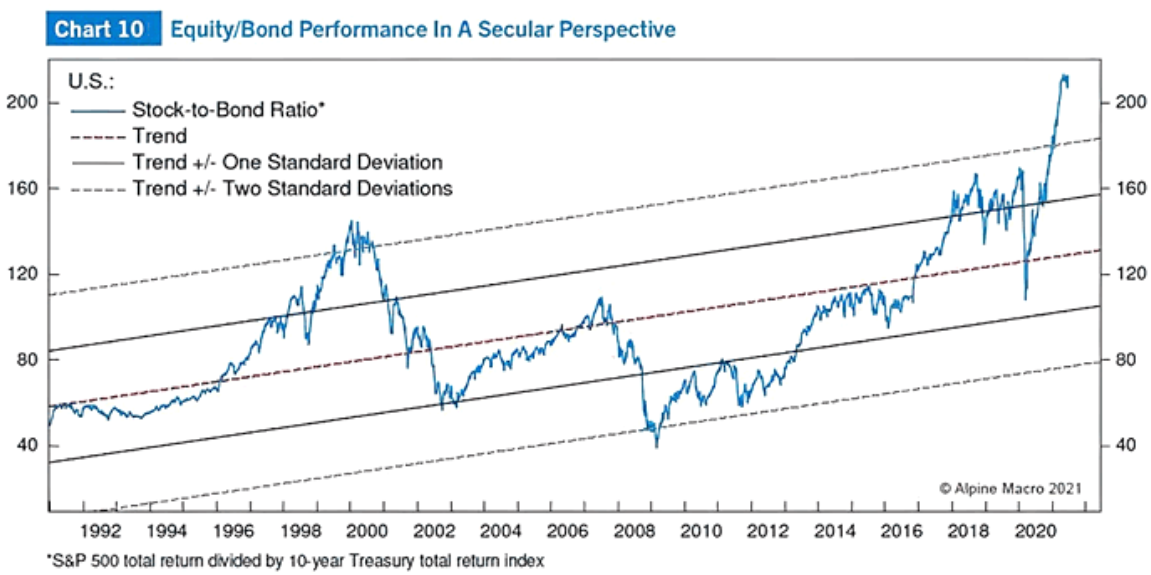
To explain, the blue line above tracks the total return of the S&P 500 divided by the total return of the U.S. 10-Year Treasury yield index. For context, the purple line in the middle tracks the historical trend, while the two lines above and below depict one and two standard deviations above and below the historical trend. If you analyze the left side of the chart, you can see how the dot-com bubble unfolded. More importantly, though, if you turn to the right side of the chart, you can see that the current reading completely dwarfs the one from 2000. As a result, investors are skating on a knife’s edge.
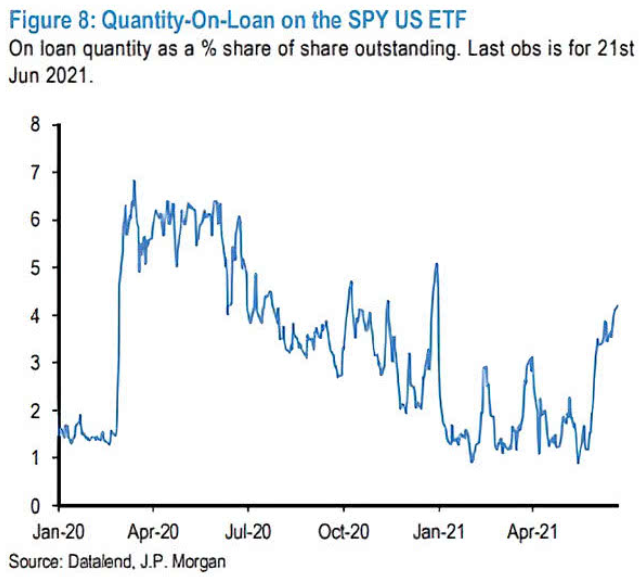
Conversely, while retail investors buy stocks hand over fist, institutional investors have been increasing their S&P 500 short interest. If you analyze the right side of the chart below, you can see that bets against the SPDR S&P 500 ETF Trust (SPY) have risen sharply in recent weeks, and the uptick highlights the divergent sentiment between professional and retail investors.
However, while the S&P 500 is unlikely to go down without a fight, a material correction could propel the USD Index back to the Promised Land. Case in point: while the ‘death of the dollar’ narrative had garnered significant support from speculators, sentiment has shifted and the bears are starting to see things from our point of view.
Please see below:
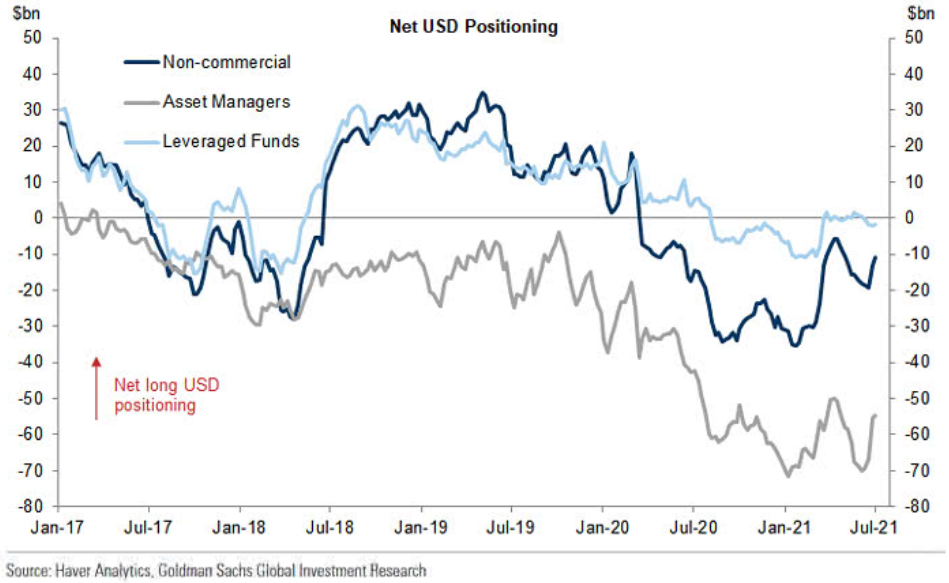
To explain, the dark blue, gray and light blue lines above represent net-long positions of non-commercial (speculative) futures traders, asset managers, and leveraged funds. When the lines are falling, it means that the trio has reduced its net-long positions and is expecting a weaker U.S. dollar. Conversely, when the lines are rising, it means that the trio has increased its net-long positions and is expecting a stronger U.S. dollar. And if you analyze the right side of the chart, you can see that all three are bracing for upward USD momentum (though leveraged funds’ movement has been minimal).
The Eurozone Remains Dim
Furthermore, while I’ve been warning that the EUR/USD remains materially overvalued, the prophecies of an economic Renaissance in the Eurozone are also starting to falter.
To explain, I wrote on Jun. 9:
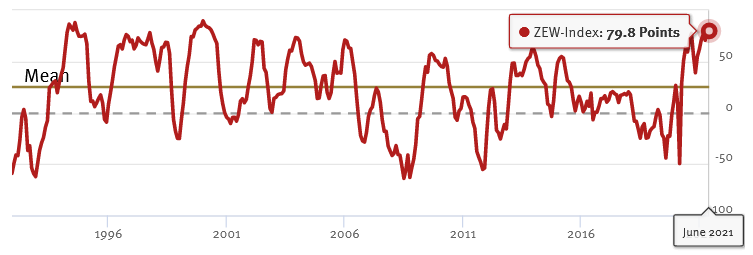
Because the EUR/USD accounts for nearly 58% of the movement of the USD Index, the currency pair is of critical importance. And while investors continue to buy hope and sell reality, rather than rising to 86.0 (the consensus estimate), the German ZEW Economic Sentiment Index (released on Jun. 8) fell from 84.4 in May to 79.8 in June. For context, Germany is Europe’s largest economy.
Please see below:
 Source: ZEW
To explain, the red line above tracks the German ZEW Economic Sentiment Index. If you analyze the behavior, you can see that 79.8 is still well above its historical average. More importantly, tough, notice how abnormally high readings are often followed by swift reversions? And with the prior high (84.4) only superseded by 2000, there is an awful lot of optimism already priced into the EUR/USD.
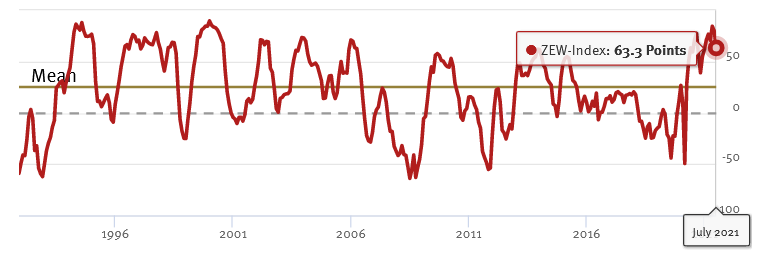
To that point, if we fast forward to Jul. 6, the German ZEW Economic Sentiment Index sunk to 63.3. And following right along, the EUR/USD ended the Jul. 6 session at its lowest level since Mar. 24.
Please see below:
 Source: ZEW
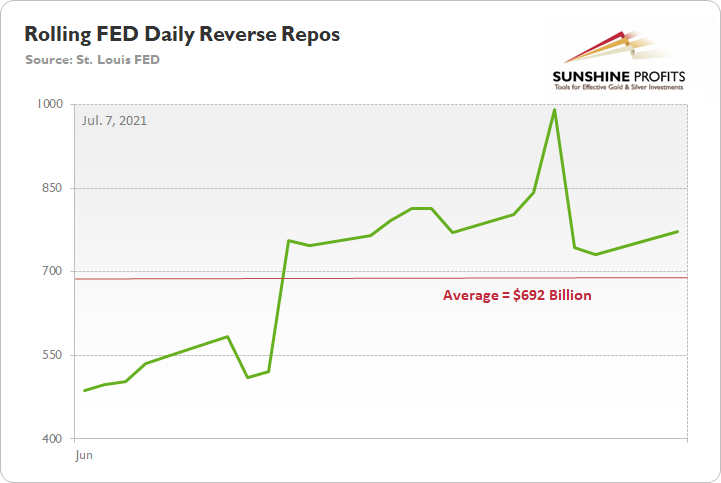
Finally, while I’ve been warning for some time that the U.S. Federal Reserve’s (FED) reverse repurchase agreements are the fundamental equivalent of a taper announcement (even though it doesn’t have the same psychological effect), the gambit still lives on. For example, on Jul. 6, the FED drained nearly $773 billion out of the U.S. financial system. Additionally, with daily reverse repos averaging $692 billion over the last 21 trading days (the average equivalent of a calendar month), the FED negated 5.77 months’ worth of QE in the last month alone.
In conclusion, the PMs remain in harm’s way, as the economic reality is now catching up with overzealous investors. With the S&P 500 materially overvalued and a potential correction likely to weigh on the PMs, the USD Index could spoil everyone’s party over the medium term. Moreover, with speculative U.S. dollar positioning still near its historic lows, a short covering rally hasn’t even begun. However, with the sentiment liable to turn on a dime, an upward re-rating of the greenback could send the PMs running in the opposite direction.
Overview of the Upcoming Part of the Decline
- The barely visible corrective upswing in gold might already be over, and another huge decline is likely just around the corner.
- After miners slide in a meaningful and volatile way, but silver doesn’t (and it just declines moderately), I plan to switch from short positions in miners to short positions in silver. At this time, it’s too early to say at what price levels this would take place – perhaps with gold close to $1,600. I plan to exit those short positions when gold shows substantial strength relative to the USD Index, while the latter is still rallying. This might take place with gold close to $1,350 - $1,500 and the entire decline (from above $1,900 to about $1,475) would be likely to take place within 6-20 weeks, and I would expect silver to fall the hardest in the final part of the move. This moment (when gold performs very strongly against the rallying USD and miners are strong relative to gold – after gold has already declined substantially) is likely to be the best entry point for long-term investments, in my view. This might also happen with gold close to $1,475, but it’s too early to say with certainty at this time.
- As a confirmation for the above, I will use the (upcoming or perhaps we have already seen it?) top in the general stock market as the starting point for the three-month countdown. The reason is that after the 1929 top, gold miners declined for about three months after the general stock market started to slide. We also saw some confirmations of this theory based on the analogy to 2008. All in all, the precious metals sector would be likely to bottom about three months after the general stock market tops.
- The above is based on the information available today, and it might change in the following days/weeks.
Please note that the above timing details are relatively broad and “for general overview only” – so that you know more or less what I think and how volatile I think the moves are likely to be – on an approximate basis. These time targets are not binding or clear enough for me to think that they should be used for purchasing options, warrants or similar instruments.
Summary
To summarize, even though gold could still move somewhat higher in the near term, it seems that having a short position in the junior mining stocks is much more justified from the risk-to-reward point of view than having a long one in any part of the precious metals market. Gold miners’ underperformance along with a self-similar pattern in the USD Index (pointing to the breather being over) and the length of the “bottoming” process in gold that no longer resembles a bottom (but rather a pause within a slide) all make the bearish outlook justified from the risk-to-reward point of view.
After the sell-off (that takes gold to about $1,350 - $1,500), I expect the precious metals to rally significantly. The final part of the decline might take as little as 1-5 weeks, so it's important to stay alert to any changes.
Most importantly, please stay healthy and safe. We made a lot of money last March and this March, and it seems that we’re about to make much more on the upcoming decline, but you have to be healthy to enjoy the results.
As always, we'll keep you - our subscribers - informed.
By the way, we’re currently providing you with a possibility to extend your subscription by a year, two years or even three years with a special 20% discount. This discount can be applied right away, without the need to wait for your next renewal – if you choose to secure your premium access and complete the payment upfront. The boring time in the PMs is definitely over and the time to pay close attention to the market is here. Naturally, it’s your capital, and the choice is up to you, but it seems that it might be a good idea to secure more premium access now, while saving 20% at the same time. Our support team will be happy to assist you in the above-described upgrade at preferential terms – if you’d like to proceed, please contact us.
To summarize:
Trading capital (supplementary part of the portfolio; our opinion): Full speculative short positions (300% of the full position) in mining stocks are justified from the risk to reward point of view with the following binding exit profit-take price levels:
Mining stocks (price levels for the GDXJ ETF): binding profit-take exit price: $24.12; stop-loss: none (the volatility is too big to justify a stop-loss order in case of this particular trade)
Alternatively, if one seeks leverage, we’re providing the binding profit-take levels for the JDST (2x leveraged) and GDXD (3x leveraged – which is not suggested for most traders/investors due to the significant leverage). The binding profit-take level for the JDST: $39.87; stop-loss for the JDST: none (the volatility is too big to justify a SL order in case of this particular trade); binding profit-take level for the GDXD: $94.87; stop-loss for the GDXD: none (the volatility is too big to justify a SL order in case of this particular trade).
For-your-information targets (our opinion; we continue to think that mining stocks are the preferred way of taking advantage of the upcoming price move, but if for whatever reason one wants / has to use silver or gold for this trade, we are providing the details anyway.):
Silver futures upside profit-take exit price: unclear at this time - initially, it might be a good idea to exit, when gold moves to $1,512.
Gold futures upside profit-take exit price: $1,512.
Long-term capital (core part of the portfolio; our opinion): No positions (in other words: cash
Insurance capital (core part of the portfolio; our opinion): Full position
Whether you already subscribed or not, we encourage you to find out how to make the most of our alerts and read our replies to the most common alert-and-gold-trading-related-questions.
Please note that we describe the situation for the day that the alert is posted in the trading section. In other words, if we are writing about a speculative position, it means that it is up-to-date on the day it was posted. We are also featuring the initial target prices to decide whether keeping a position on a given day is in tune with your approach (some moves are too small for medium-term traders, and some might appear too big for day-traders).
Additionally, you might want to read why our stop-loss orders are usually relatively far from the current price.
Please note that a full position doesn't mean using all of the capital for a given trade. You will find details on our thoughts on gold portfolio structuring in the Key Insights section on our website.
As a reminder - "initial target price" means exactly that - an "initial" one. It's not a price level at which we suggest closing positions. If this becomes the case (like it did in the previous trade), we will refer to these levels as levels of exit orders (exactly as we've done previously). Stop-loss levels, however, are naturally not "initial", but something that, in our opinion, might be entered as an order.
Since it is impossible to synchronize target prices and stop-loss levels for all the ETFs and ETNs with the main markets that we provide these levels for (gold, silver and mining stocks - the GDX ETF), the stop-loss levels and target prices for other ETNs and ETF (among other: UGL, GLL, AGQ, ZSL, NUGT, DUST, JNUG, JDST) are provided as supplementary, and not as "final". This means that if a stop-loss or a target level is reached for any of the "additional instruments" (GLL for instance), but not for the "main instrument" (gold in this case), we will view positions in both gold and GLL as still open and the stop-loss for GLL would have to be moved lower. On the other hand, if gold moves to a stop-loss level but GLL doesn't, then we will view both positions (in gold and GLL) as closed. In other words, since it's not possible to be 100% certain that each related instrument moves to a given level when the underlying instrument does, we can't provide levels that would be binding. The levels that we do provide are our best estimate of the levels that will correspond to the levels in the underlying assets, but it will be the underlying assets that one will need to focus on regarding the signs pointing to closing a given position or keeping it open. We might adjust the levels in the "additional instruments" without adjusting the levels in the "main instruments", which will simply mean that we have improved our estimation of these levels, not that we changed our outlook on the markets. We are already working on a tool that would update these levels daily for the most popular ETFs, ETNs and individual mining stocks.
Our preferred ways to invest in and to trade gold along with the reasoning can be found in the how to buy gold section. Furthermore, our preferred ETFs and ETNs can be found in our Gold & Silver ETF Ranking.
As a reminder, Gold & Silver Trading Alerts are posted before or on each trading day (we usually post them before the opening bell, but we don't promise doing that each day). If there's anything urgent, we will send you an additional small alert before posting the main one.
Thank you.
Przemyslaw Radomski, CFA
Founder, Editor-in-chief

