

Briefly: in our opinion, full (200% of the regular position size) speculative long positions in junior mining stocks are justified from the risk/reward point of view at the moment of publishing this Alert.
NOTE TO READERS:
Dear Subscribers,
Due to PR’s travel schedule this week, today’s technical part is brief, and there will be no technical parts in the Gold & Silver Trading Alerts that are posted on Thursday and Friday this week. The fundamental parts will be posted normally.
However, if anything major happens in the markets and it changes the outlook in the market or makes us think that a change in the trading/investment positions is justified from the risk/reward point of view, we’ll send you a quick intraday Alert.
Most likely, though, the GDXJ will simply move higher this week and, at least initially, next week, correcting the recent powerful decline. Let’s keep in mind that the Fed’s interest rate decision is next week, and that’s when (approximately) PMs and miners could top.
There might be some intraday volatility on Thursday as that’s when we get the initial jobless claims in the U.S. and there’s also the interest rate decision (and press conference) from the ECB. However, I don’t think that it will change the short-term trend, even if the intraday back-and-forth movement is rather large.
Stay tuned!Gold is doing pretty much nothing these days, but junior miners tell us what gold’s going to do next. It’s most likely to rally in the short term.
Why? Because the mining stocks tend to lead gold higher and lower, and looking at the relative performance of both parts of the precious metals sector, we see that this time, miners are already moving higher, while gold is getting ready to follow in miners’ footsteps. Let’s take a closer look at what junior miners (the GDXJ) did recently.
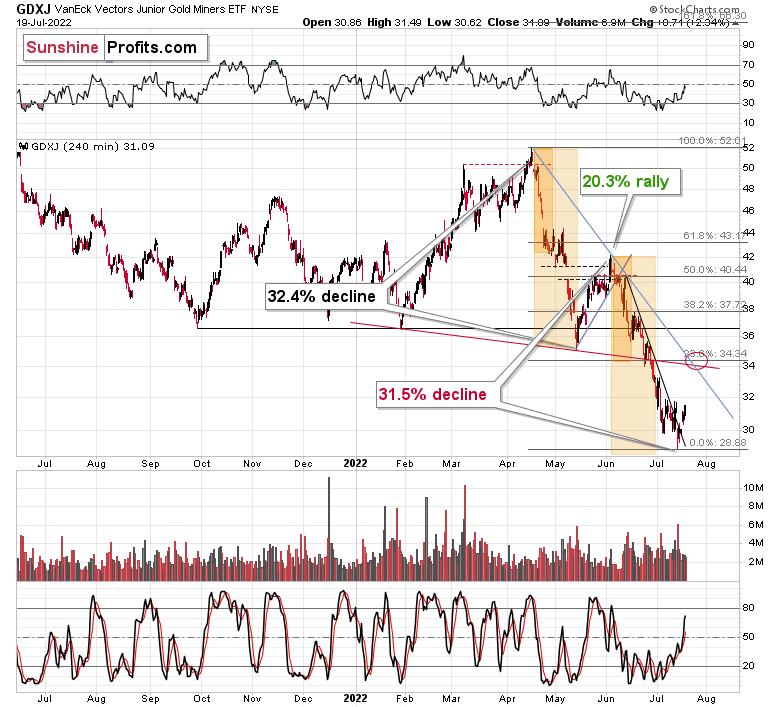
In short, junior miners managed to break above their declining short-term resistance line, and they closed above it for the second consecutive day. If they stay above it today (which is highly likely), the breakout will be confirmed. This is a very bullish indication for the short run.
This is especially the case since it happened shortly after the GDXJ refused to break below the $30 level – rallying back above it after a daily close slightly below it. The invalidation of the tiny breakdown itself was a bullish sign, not to mention that the very bottom – the daily reversal – materialized in huge volume.
The above chart is bullish for the short run, and please note that junior miners are now well above their early-July bottom.
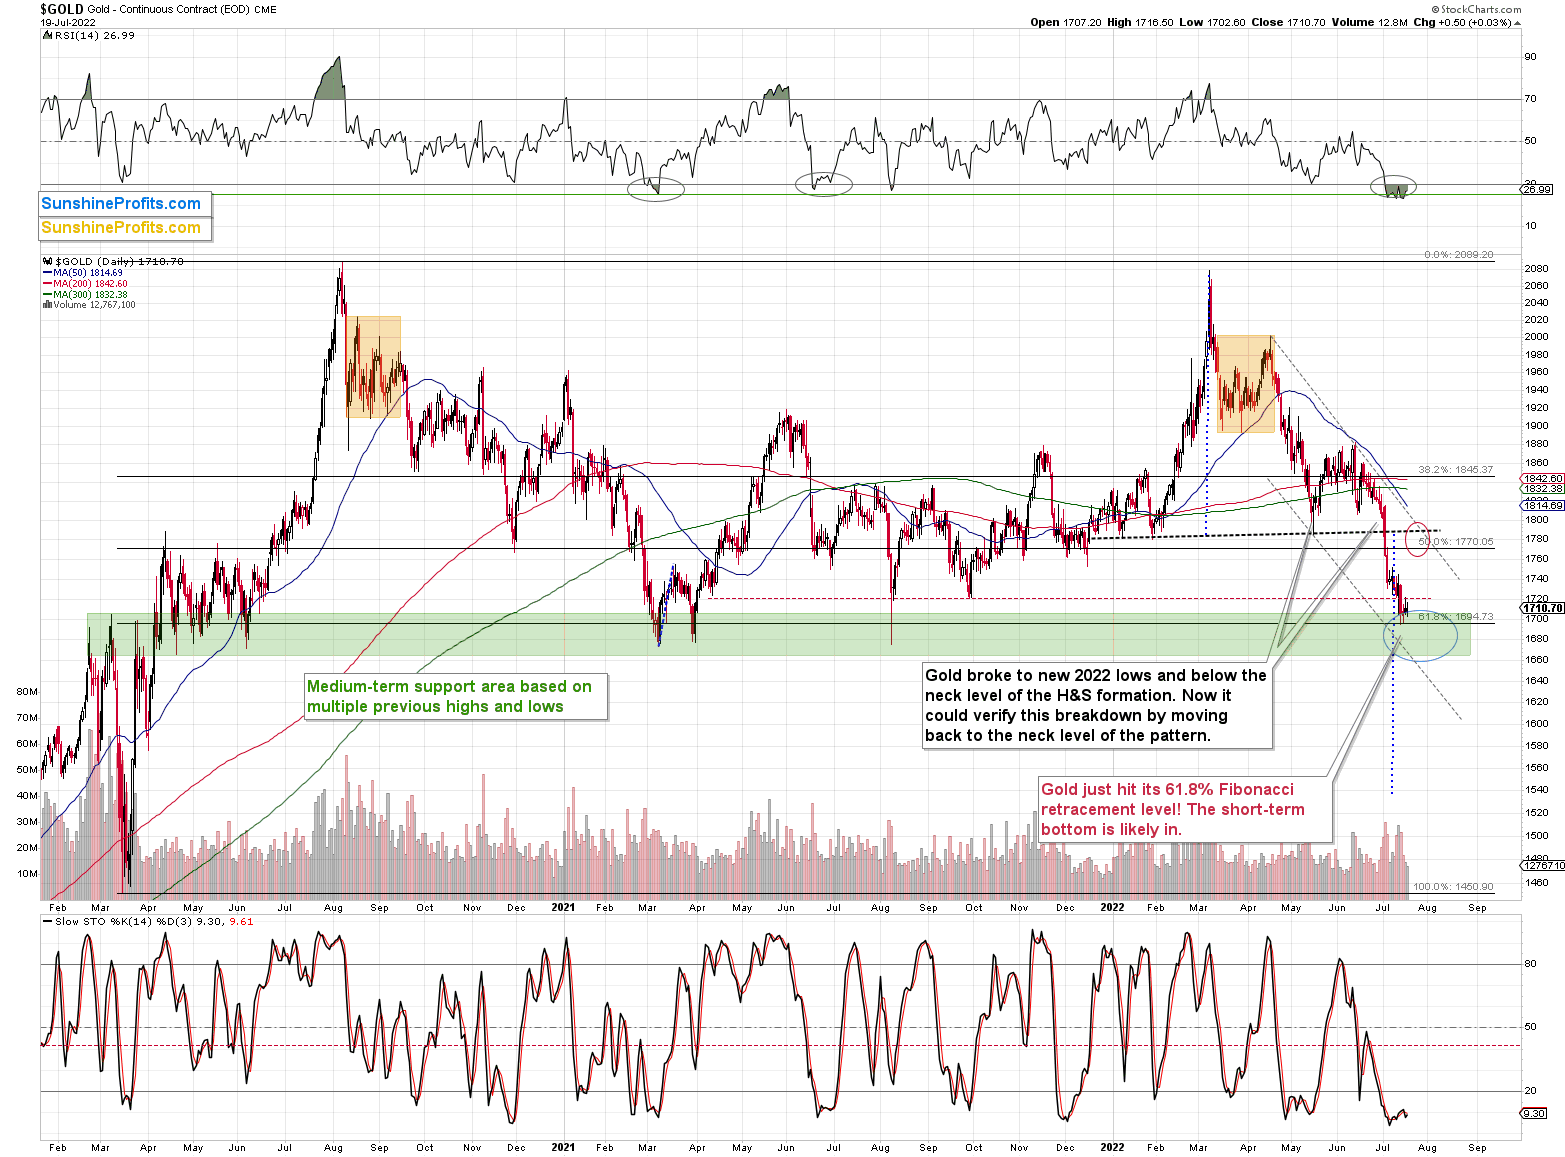
Gold, on the other hand, is not above its early-July low. It’s barely up from its July 14 bottom.
The RSI remains very oversold, suggesting that gold hasn’t started its rally just yet, but that it remains poised to soar. After all, in RSI terms, gold is now more oversold than it was at its 2020 bottom.
Speaking of 2020, gold recently bottomed practically right at its early-2020 high. To be clear, it was one of the levels that created strong support close to the $1,700 level. Either way, this means that gold is likely to rally any day now.
So, what is gold waiting for? Why isn’t it rallying, especially given that the USD Index is declining and the EUR/USD currency pair is rallying?
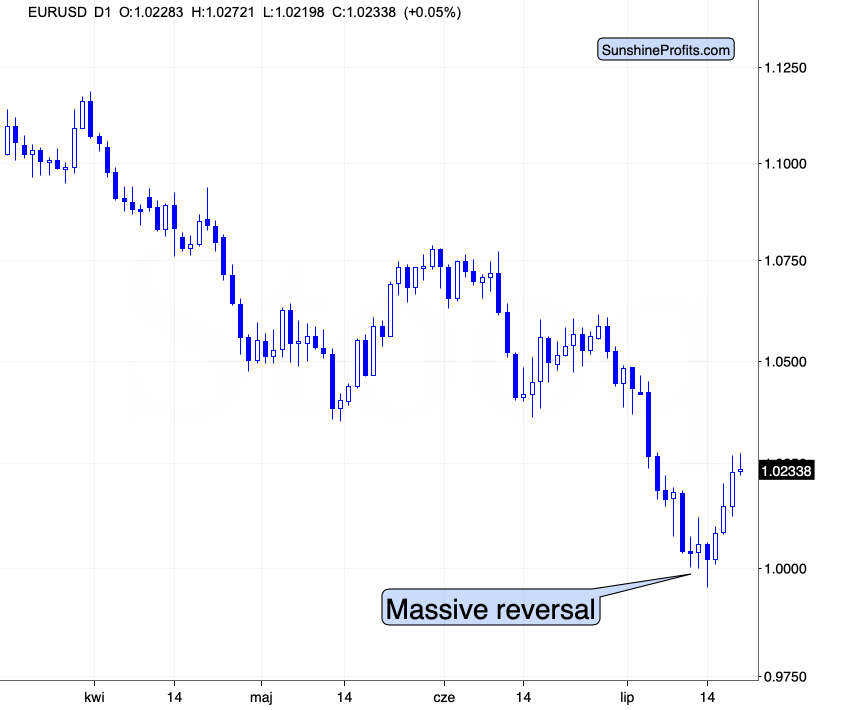
As a reminder, the EUR/USD pair reversed in a profound way after trying to break below the all-important 1 level. For a brief moment, the U.S. dollar was more expensive than the euro, and it triggered a reversal, just as I had indicated.
The answer to the why-not question could lie in Europe. More precisely, in the Eurozone and this week’s interest rate decision, which is due tomorrow (Thursday, July 21). It’s not a matter of what will or will not be said and done. It’s a matter of the uncertainty that will be present until it’s known what the status is (for now). Based on that, we could see some chaotic price movement on an intraday basis. However, once a decision is made and the markets know what’s going on, the traders might finally want to enter the trades that they are now allowing themselves to enter right now, adopting the wait-and-see approach.
Please note that the above is just one of the possible triggers for gold price moves, and it could actually be something else that directly triggers the move. What it will be is of relatively small importance. What is much more important is the pressure that has built up for gold to rally. The USDX decreased, and junior miners are already moving higher. The RSI below 30 is like a coiled spring, just waiting to expand rapidly. Given the ECB’s looming decision, it seems that we won’t have to wait long for gold to finally move and correct some of its recent declines.
All in all, it looks like the precious metals sector is going to rally and probably top close to the end of this month as the USD Index pulls back after a sizable rally.
Having said that, let’s take a look at the markets from a more fundamental angle.
Hunting Season
With the NASDAQ 100 and the S&P 500 closing above their 50-day moving averages on Jul. 19 for only the second time during a bear market rally in 2022, it’s hunting season for the pessimists. Moreover, with the GDXJ ETF also participating in the bullish festivities, I warned before the open that higher prices were the path of least resistance. I wrote:
While the GDXJ ETF outperformed the NASDAQ 100 and the S&P 500 on Jul. 18, equity optimism would likely propel the junior miners even higher. As such, a close above the NASDAQ 100’s 50-day MA should help uplift the PMs in the coming days.
Furthermore, with too many bears on one side of the boat, over-positioning should allow risk assets like the GDXJ ETF to rise in the days ahead. For example, Bank of America released its Global Fund Manager Survey (FMS) on Jul. 19. Moreover, after finding a "dire level of investor pessimism," Bank of America's Chief Investment Strategist Michael Hartnett sees signs of "full capitulation."
Please see below:
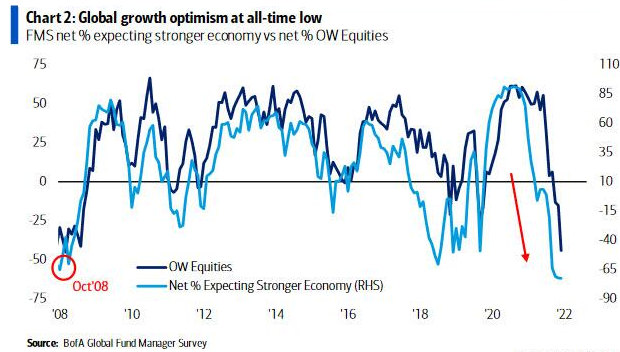
To explain, the light blue line above tracks the net percentage of respondents that expect a stronger U.S. economy, while the dark blue line above tracks the net percentage of respondents that are overweight stocks. If you analyze the right side of the chart, you can see that the dark blue line has caught up with the light blue line.
Therefore, fund managers have already cut their equity exposure, which could put a floor on potential selling pressure. Similarly, if the dark blue line reverses upward as FOMO sets in, a realization is bullish for the GDXJ ETF.
Likewise, the 2022 rout in financial assets has spooked global fund managers, and their fear of deploying capital is highly elevated.
Please see below:
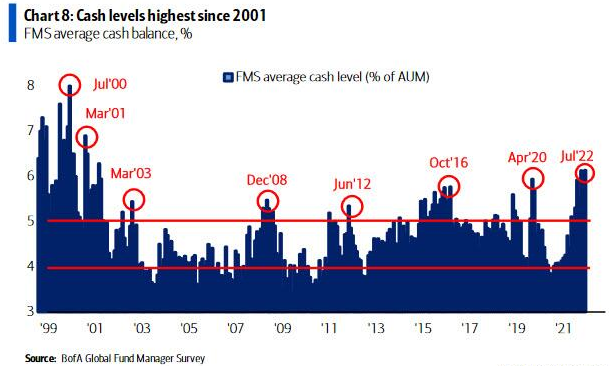
To explain, the blue bars above track global fund managers' average cash balances as a percentage of their assets under management (AUM). If you analyze the right side of the chart, you can see that their average cash hoard is the highest since 2001. As a result, light positioning and abnormally high levels of cash create the perfect cocktail for a short-term bounce.
Furthermore, the most crowded trade on Wall Street should help uplift the PMs in the coming days/weeks. To explain, I wrote on Apr. 19:
While fund managers believe that a material tightening of financial conditions will commence, the ‘buy the dip’ mentality is hard to break. However, with reality likely to force institutional investors to recalibrate their positions, the prospective negativity should have a profound impact on the PMs.
To that point, long oil/commodities are still the most crowded trades on Wall Street. Moreover, the idea that higher interest rates won’t impact commodity demand lacks credibility. In fact, slowing the U.S. economy should hurt commodities more than most sectors. As such, when the over-optimism reverses, the PMs should suffer substantial declines.
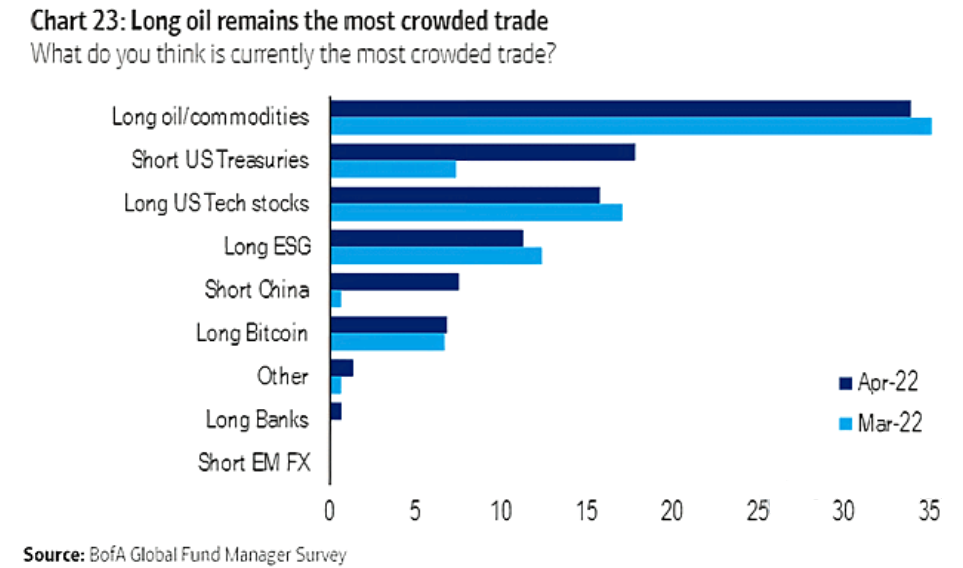
Thus, while commodities excitement reversed and the PMs suffered mightily amid the positioning shift (especially silver and mining stocks), the current setup has the opposite implications.
Please see below:
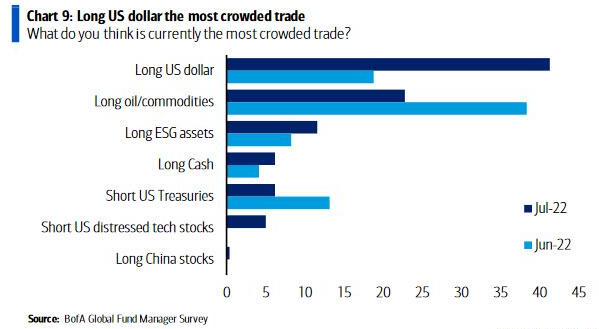
To explain, long U.S. dollar is now the most crowded trade on Wall Street. Thus, while the USD Index has declined recently as risk-on sentiment spread, it could incur more downside since too many investors piled in during the late innings of the rally. As a result, the data is contrarian bearish for the U.S. dollar and, therefore, bullish for the GDXJ ETF.
Also noteworthy, global fund managers are short the materials sector, and a recalibration toward neutral could enhance the GDXJ ETF's upward momentum.
Please see below:
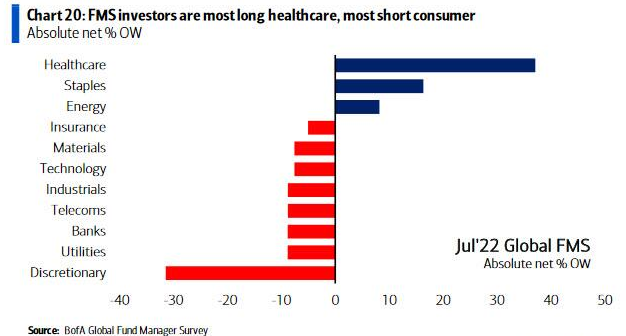
All in all, the FMS data paints a contrarian portrait that supports higher prices for the PMs in the short term. Moreover, Hartnett summed up his findings by telling clients that "H2’22 fundamentals poor, but sentiment says stocks/credit rally in coming weeks." In addition, the "contrarian Q3 trade is risk-on if no Lehman, CPI down, Fed pause by Xmas (…). [which means] short cash-long stocks, short US$-long Eurozone, short defensives-long stocks banks & consumer."
In a nutshell: Hartnett urged clients to rotate out of risk-off assets (like cash and the U.S. dollar) and into risk assets (like stocks, banks, and the Eurozone). As such, the PMs’ relief rallies should have more room to run.
Turn on the Machines
With systematic (quant) funds reducing their risk exposure throughout much of 2022, a positioning shift could also have drastic implications for the S&P 500 and the GDXJ ETF.
Please see below:
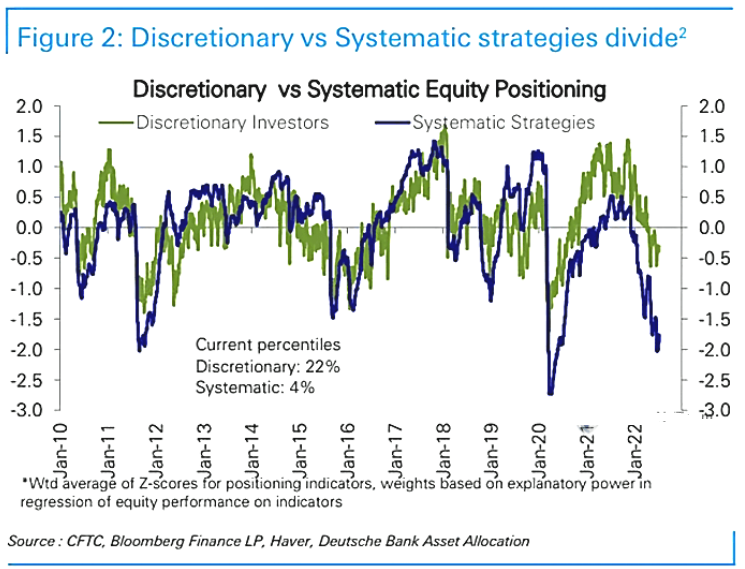
To explain, the green and blue lines above track the z-score of discretionary and systematic investors' equity positioning. If you analyze the right side of the chart, you can see that the former is in the 22nd percentile, while the latter is in the 4th percentile. As a result, systematic funds had no appetite for equities before the Jul. 19 rally.
However, with systematic funds (trend followers, CTAs, volatility control funds) "absolutely lifting global equities futures in size," Nomura's head of Cross-Asset Macro Strategy, Charlie McElligott, told clients that CTAs have bought $33+ billion in futures over the last week, and projected volatility "buy" triggers could result in more purchases. He wrote:
“If we were to then theoretically project that magnitude of daily change out for the next 1m, we would expect nearly +$21B of U.S. equities buying from Vol Control over that 1m window (jumps to +$25.5B for 0.5% daily chg out over 1m, or drops down to +$14.3B on daily 1.5% chg).”
Please see below:
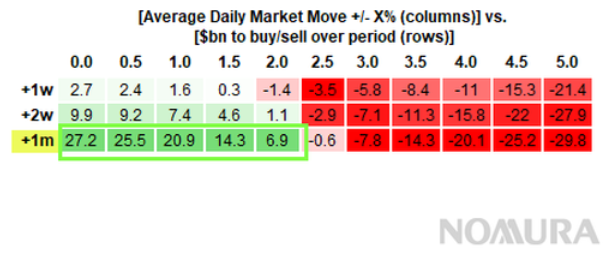
To explain, systematic funds apply strict volatility controls to prevent major drawdowns. Therefore, if calm prevails in the financial markets, systematic funds could enhance the upward momentum by increasing their risk exposure. For example, the green rows on the left highlight how average daily market moves of 0% to 2% should result in net purchases by systematic funds over the next month.
Moreover, average moves of 1% or less (most common) mean less volatility and often culminate in the largest inflows. In contrast, the red rows on the right show how large average daily swings of 2.5% or more often push systematic funds to the sidelines. As a result, “a ‘Summer doldrums’ environment” where a lot of the bad news is already priced in could provide the perfect backdrop for the GDXJ ETF to move higher.
Leveraged Bets
Finally, while pessimism has percolated throughout the financial markets due to unanchored inflation and a hawkish Fed, investors' leveraged bets on a crash are likely too consensus to materialize in the short term.
Please see below:
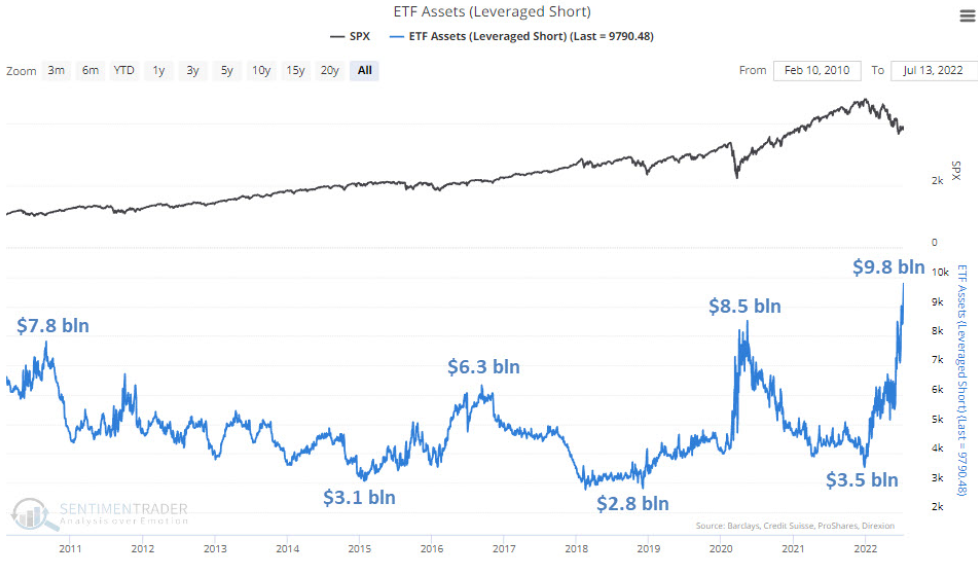
To explain, the black line above tracks the S&P 500, while the blue line above tracks the AUM of leveraged short (inverse) ETFs. If you analyze the right side of the chart, you can see that the cumulative AUM of $9.8 billion is the highest in ~12 years. Moreover, the most recent tally was nearly double from where we were in May. Thus, the crash crew may have already pushed their chips into the middle, and when sellers exhaust themselves, sharp moves in the opposite direction often occur.
The Bottom Line
With the bulls regaining their swagger on Jul. 19, the technical, sentiment, and positioning backdrop are profoundly bullish for the PMs. Moreover, while the fundamental outlook is much less optimistic, the former is a better predictor of the short-term price action. Thus, the GDXJ ETF should enjoy more short-term upside before the bearish fundamental realities become fashionable in the months ahead.
In conclusion, the PMs were mixed on Jul. 19, as silver ended the day in the red. However, the GDXJ ETF materially outperformed, and more of the same should materialize in the days ahead. As a result, we believe the long side currently offers the best risk-reward proposition.
Overview of the Upcoming Part of the Decline
- It seems to me that we’re going to see a corrective upswing here (probably ending in the final week of July) that will then be followed by a very big decline in the precious metals sector.
- If we see a situation where miners slide in a meaningful and volatile way while silver doesn’t (it just declines moderately), I plan to – once again – switch from short positions in miners to short positions in silver. At this time, it’s too early to say at what price levels this could take place and if we get this kind of opportunity at all – perhaps with gold prices close to $1,600.
- If we see a situation where miners slide in a meaningful and volatile way while silver doesn’t (it just declines moderately), I plan to – once again – switch from short positions in miners to short positions in silver. At this time, it’s too early to say at what price levels this could take place and if we get this kind of opportunity at all – perhaps with gold prices close to $1,600.
- I plan to exit all remaining short positions once gold shows substantial strength relative to the USD Index while the latter is still rallying. This may be the case with gold close to $1,400. I expect silver to fall the hardest in the final part of the move. This moment (when gold performs very strongly against the rallying USD and miners are strong relative to gold after its substantial decline) is likely to be the best entry point for long-term investments, in my view. This can also happen with gold close to $1,400, but at the moment it’s too early to say with certainty.
- The above is based on the information available today, and it might change in the following days/weeks.
You will find my general overview of the outlook for gold on the chart below:
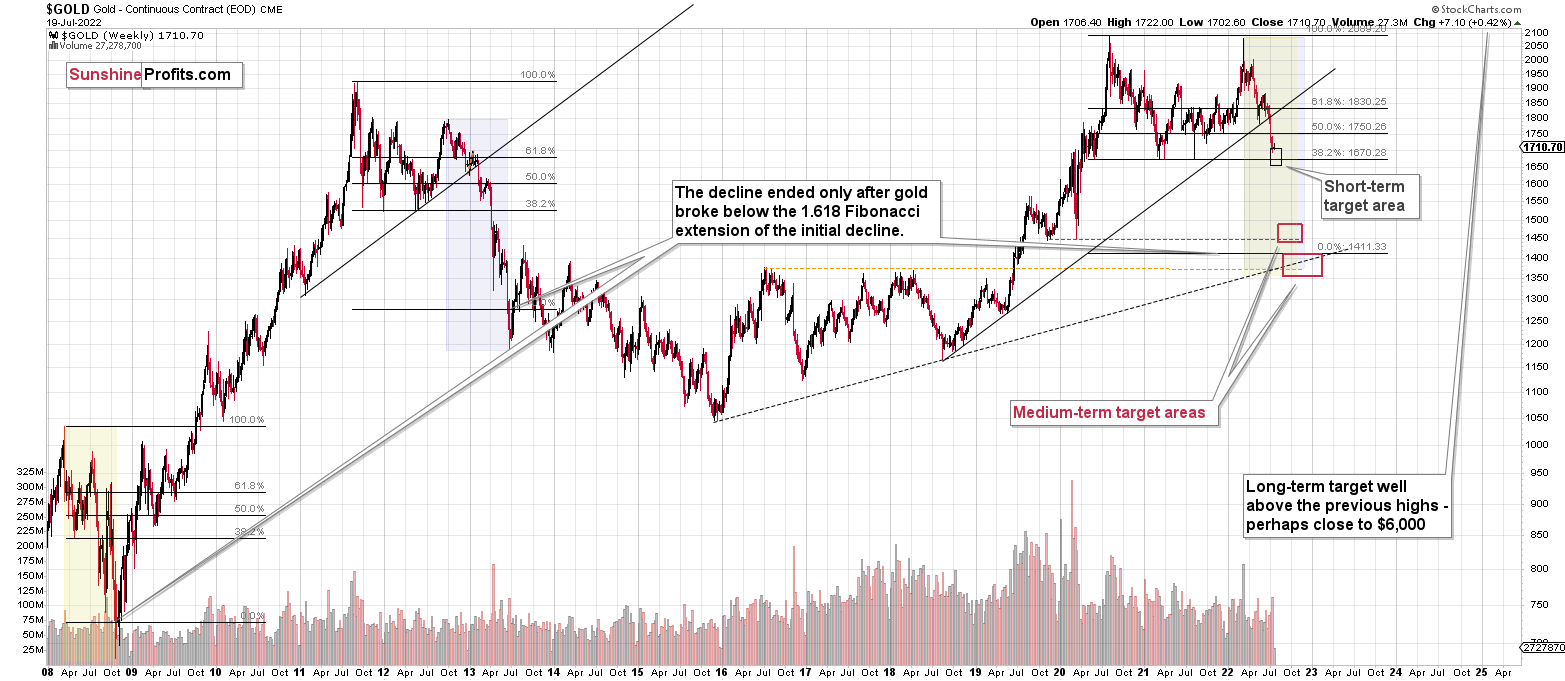
Please note that the above timing details are relatively broad and “for general overview only” – so that you know more or less what I think and how volatile I think the moves are likely to be – on an approximate basis. These time targets are not binding nor clear enough for me to think that they should be used for purchasing options, warrants, or similar instruments.
Letters to the Editor
Q: Hi PR,
I hope you are doing great, and thanks for your great newsletters; they are handy during these exciting times. I know you touched on some of this during your recent newsletters, but I wanted to see if you could share your thoughts. If gold prices do not increase until the FOMC meeting and, like you mentioned, the Fed stays somewhat dovish with a 75 basis point increase, what would gold’s reaction be? And would you plan to stay in the long position past the FOMC meeting? Thanks for taking the time to reply.
A: I am indeed doing great, thank you! One of the reasons that I’m doing great is that I’ve been receiving many kind words about my work in recent days, weeks, and months, and I appreciate all of them greatly – thank you.
I don’t want to go into speculation of how gold could react to any possible move and comment from the Fed, because it’s:
- Tricky and difficult to predict what the Fed will say.
- The buy-the-rumor-sell-the-fact type of reaction could reverse what one would think makes sense based on what is said and done.
I will base my decisions on whether or not to exit the long position on what we see in price and volume in various parts of the precious metals sector and on what happens in the USD Index and in the general stock market. The relative performance of gold-USD (will gold stop reacting to USD’s declines?), miners-gold (will miners stop reacting to gold’s daily rallies?), and gold-silver (will silver outperform gold on a very short-term basis, perhaps temporarily breakout above some resistance?) pairs will be critical, too.
I would prefer to take profits from the long positions and re-enter short ones before the FOMC, as the following declines could be volatile. However, if we don’t see a rally beforehand, then we might see it based on whatever FOMC results in. In my opinion, the former is much more likely than the latter.
Of course, I will keep you – my subscribers – informed via my Gold & Silver Trading Alerts.
Administrative Announcement
Due to PR’s travel schedule this week, today’s technical part is brief, and there will be no technical parts in the Gold & Silver Trading Alerts that are posted on Thursday and Friday this week. The fundamental parts will be posted normally.
However, if anything major happens in the markets and it changes the outlook in the market or makes us think that a change in the trading/investment positions is justified from the risk/reward point of view, we’ll send you a quick intraday Alert.
Most likely, though, the GDXJ will simply move higher this week and, at least initially, next week, correcting the recent powerful decline. Let’s keep in mind that the Fed’s interest rate decision is next week, and that’s when (approximately) PMs and miners could top.
There might be some intraday volatility on Thursday as that’s when we get the initial jobless claims in the U.S. and there’s also the interest rate decision (and press conference) from the ECB. However, I don’t think that it will change the short-term trend, even if the intraday back-and-forth movement is rather large.
Summary
Summing up, it seems that while the medium-term trend in the precious metals sector remains down, we are likely to see a corrective upswing soon. Based on the confirmations that we have seen recently, the short-term outlook is bullish.
In my opinion, the GDXJ will most likely move higher this week and at least initially next week, correcting the recent powerful decline. Let’s keep in mind that the Fed’s interest rate decision is next week, and that’s when (approximately) PMs and miners could top.
There might be some intraday volatility on Thursday as that’s when we get the initial jobless claims in the U.S. and there’s also the interest rate decision (and press conference) from the ECB. However, I don’t think that it will change the short-term trend, even if the intraday back-and-forth movement is rather large.
It seems likely that the profits that we earned from the last couple of trades will increase even further in the near future.
After the final sell-off (that takes gold to about $1,350-$1,500), I expect the precious metals to rally significantly. The final part of the decline might take as little as 1-5 weeks, so it's important to stay alert to any changes.
As always, we'll keep you – our subscribers – informed.
To summarize:
Trading capital (supplementary part of the portfolio; our opinion): Full speculative long positions (200% of the full position) in junior mining stocks are justified from the risk to reward point of view with the following binding exit profit-take price levels:
Mining stocks (price levels for the GDXJ ETF): binding profit-take exit price: $33.87; stop-loss: none (the volatility is too big to justify a stop-loss order in case of this particular trade)
Alternatively, if one seeks leverage, we’re providing the binding profit-take levels for the JNUG (2x leveraged). The binding profit-take level for the JNUG: $36.78; stop-loss for the JNUG: none (the volatility is too big to justify a SL order in case of this particular trade).
For-your-information targets (our opinion; we continue to think that mining stocks are the preferred way of taking advantage of the upcoming price move, but if for whatever reason one wants / has to use silver or gold for this trade, we are providing the details anyway.):
Silver futures upside profit-take exit price: $20.28
SLV profit-take exit price: $18.78
AGQ profit-take exit price: $24.57
Gold futures upside profit-take exit price: $1,776
HGU.TO – alternative (Canadian) 2x leveraged gold stocks ETF – the upside profit-take exit price: $13.46
HZU.TO – alternative (Canadian) 2x leveraged silver ETF – the upside profit-take exit price: $9.18
Long-term capital (core part of the portfolio; our opinion): No positions (in other words: cash)
Insurance capital (core part of the portfolio; our opinion): Full position
Whether you’ve already subscribed or not, we encourage you to find out how to make the most of our alerts and read our replies to the most common alert-and-gold-trading-related-questions.
Please note that we describe the situation for the day that the alert is posted in the trading section. In other words, if we are writing about a speculative position, it means that it is up-to-date on the day it was posted. We are also featuring the initial target prices to decide whether keeping a position on a given day is in tune with your approach (some moves are too small for medium-term traders, and some might appear too big for day-traders).
Additionally, you might want to read why our stop-loss orders are usually relatively far from the current price.
Please note that a full position doesn't mean using all of the capital for a given trade. You will find details on our thoughts on gold portfolio structuring in the Key Insights section on our website.
As a reminder - "initial target price" means exactly that - an "initial" one. It's not a price level at which we suggest closing positions. If this becomes the case (as it did in the previous trade), we will refer to these levels as levels of exit orders (exactly as we've done previously). Stop-loss levels, however, are naturally not "initial", but something that, in our opinion, might be entered as an order.
Since it is impossible to synchronize target prices and stop-loss levels for all the ETFs and ETNs with the main markets that we provide these levels for (gold, silver and mining stocks - the GDX ETF), the stop-loss levels and target prices for other ETNs and ETF (among other: UGL, GLL, AGQ, ZSL, NUGT, DUST, JNUG, JDST) are provided as supplementary, and not as "final". This means that if a stop-loss or a target level is reached for any of the "additional instruments" (GLL for instance), but not for the "main instrument" (gold in this case), we will view positions in both gold and GLL as still open and the stop-loss for GLL would have to be moved lower. On the other hand, if gold moves to a stop-loss level but GLL doesn't, then we will view both positions (in gold and GLL) as closed. In other words, since it's not possible to be 100% certain that each related instrument moves to a given level when the underlying instrument does, we can't provide levels that would be binding. The levels that we do provide are our best estimate of the levels that will correspond to the levels in the underlying assets, but it will be the underlying assets that one will need to focus on regarding the signs pointing to closing a given position or keeping it open. We might adjust the levels in the "additional instruments" without adjusting the levels in the "main instruments", which will simply mean that we have improved our estimation of these levels, not that we changed our outlook on the markets. We are already working on a tool that would update these levels daily for the most popular ETFs, ETNs and individual mining stocks.
Our preferred ways to invest in and to trade gold along with the reasoning can be found in the how to buy gold section. Furthermore, our preferred ETFs and ETNs can be found in our Gold & Silver ETF Ranking.
As a reminder, Gold & Silver Trading Alerts are posted before or on each trading day (we usually post them before the opening bell, but we don't promise doing that each day). If there's anything urgent, we will send you an additional small alert before posting the main one.
Thank you.
Przemyslaw Radomski, CFA
Founder, Editor-in-chief

