

Briefly: in our opinion, full (250% of the regular size of the position) speculative short position in gold, silver, and mining stocks is justified from the risk/reward perspective at the moment of publishing this Alert.
Gold clearly invalidated its breakout and silver broke to new 2019 lows. And it all happened in perfect tune with the previous patterns and our explanations. It took gold 3 days to form a top, just like it was the case with previous major tops. The geopolitical-news driven rally was short-lived. The breakouts it caused were invalidated. Even though it was rather fake, the recent upswing was not meaningless from the technical point of view. The price level that gold reached provides us with yet another confirmation of its precise downside target that is likely to be reached shortly - most likely this month.
Let's take a closer look at the markets, starting with gold.
Gold's Breakout Invalidation Refines Its Next Price Target
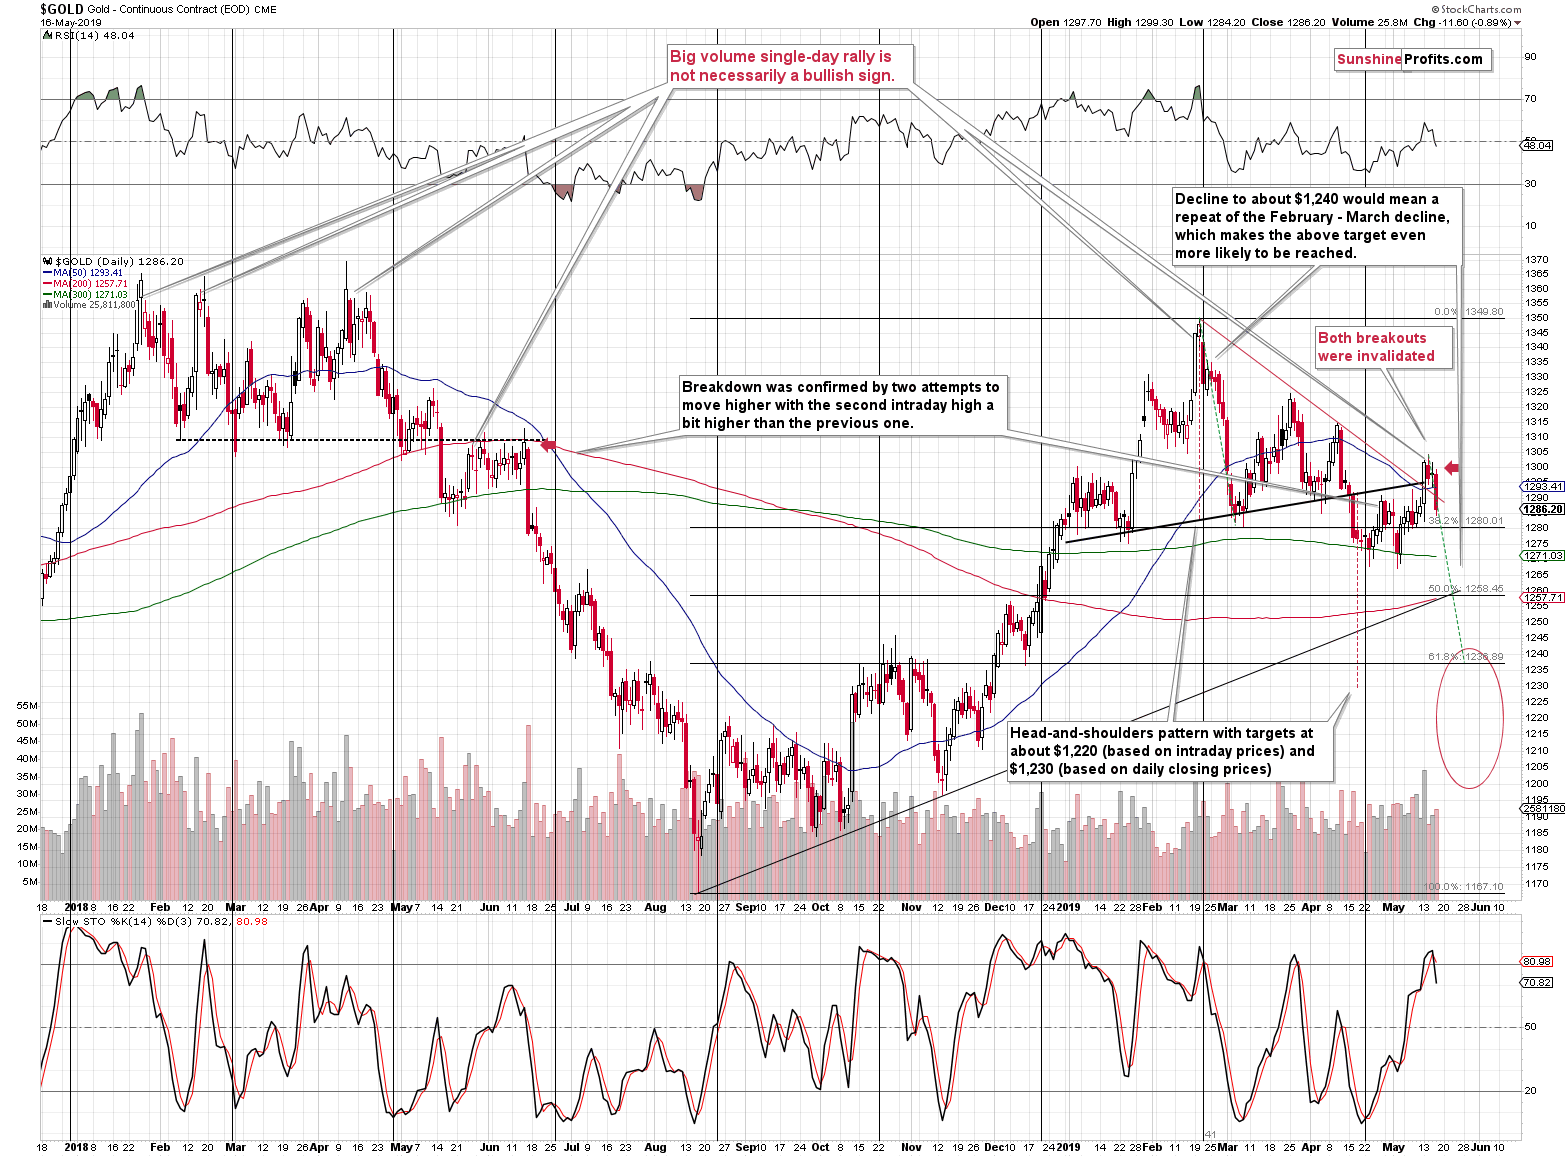
As said, we have just seen gold invalidate the small breakout above both the rising and declining support/resistance lines. The red declining resistance line based on the previous tops and the neck level of the head-and-shoulders pattern were both broken to the downside and the short-term outlook deteriorated.
On Monday, when gold soared based on news regarding US-China trade war, we immediately sent you an intraday Alert. Quoting from it:
What does it all mean? It means another day or a few days of delay of the massive decline. It doesn't change its extent or severity - it simply means a little more patience is necessary.
Let's keep in mind that geopolitical events rarely have lasting impact on the market - https://www.sunshineprofits.com/gold-silver/dictionary/gold-geopolitical-risk/ - and this time is not likely to be different.
On the following day, we added:
How bullish has the situation really become for the short run?
Barely. Yes, it might seem weird that such a combination of factors didn't change much, but this is really the case. First of all, the only changes were of short-term nature. All the long- and medium-term factors continue to favor lower PMs prices in the following months. For instance, the gold to silver ratio rallied above 88 yesterday.
Second, the technical changes are not as simple as stated above and we'll get into the details in just a minute.
Third, it was a geopolitical event that triggered the moves and the effects of these moves tend to be temporary. It was not a purely technical move that would show market participants' true attitude. Investors got scared and fled to the traditional hedge - gold. Gold was practically forced to rally regardless of what it's about to do anyway. This means that yesterday's rally should be viewed with skepticism. The no-news-based breakdown in the mining stocks that we saw on Friday was many times more important as it showed where the market really wants to go.
Think about it this way - you hear jet engines and you look into the sky to check in which direction they are flying. If it's very cloudy on that day and they are above the clouds, then you won't be able to clearly determine it. You might hear something, but you won't be sure, especially that the sound is delayed and there would be many airplanes in the air at the same time.
Gold was forced to rally yesterday, so its true intentions were obscured. We had some insights from the pre-market silver slide, but that's it. Based on what we saw in the precious metals sector in the preceding days (based on what was on the horizon line before it got cloudy), we know that the overall outlook should be bearish.
Gold just erased Monday's gains. The previously obscured view is now clear. Did the US-China trade conflict end or at least get better? Not really. What was necessary to trigger the decline? Nothing. The situation is still relatively bad and yet, gold declined nonetheless. Why? Because that's what it really wanted to do - that's the true trend that is currently in play. Instead of panicking when the markets are surprised, it proved once again to be much better to rely on long- and medium-term indications. The immediate term may be determined by the news to a varying extent, but the strength of reaction and its shelf life is a different matter entirely.
Technically, we can detect the above with the price-volume link, with the relative strength and - sometimes - with indicators and other trading techniques. In this case, we saw invalidation of a breakout and a sell signal from the Stochastic indicator. With regard to the price-volume link, we had already discussed it previously. When gold moved on Monday on huge volume, instead of chasing the market, we wrote that it's actually the way in which many other market tops formed.
Now, the new indication from the above chart is the duplication of the February - March decline. Markets quite often tend to repeat their previous moves and gold is no exception. While this - by itself - is not an indication that's strong enough to justify placing a target somewhere, it's still a great tool for confirming targets that were based on other techniques.
If we copy the February - March decline to the current situation (assuming that this week's top is the start of the next short-term wave down), then we get $1,240 as the price target. This is yet another confirmation that this level is going to trigger the next meaningful rebound. The other reasons are: similarity to the 2018 decline and its target, the similarity to the December 2012 decline, and the 61.8% Fibonacci retracement level based on the most recent medium-term rally.
Also, we adjusted the price target based on the head-and-shoulders pattern. The formation didn't change, but we added the emphasis on the target that is based on the closing prices, instead of the one based on the intraday moves. The latter is $1,220, while the former is $1,230. That's much closer to the target that we have based on other techniques.
All in all, the $1,240 target became even more likely than it was before.
What About Silver and Mining Stocks' Targets?
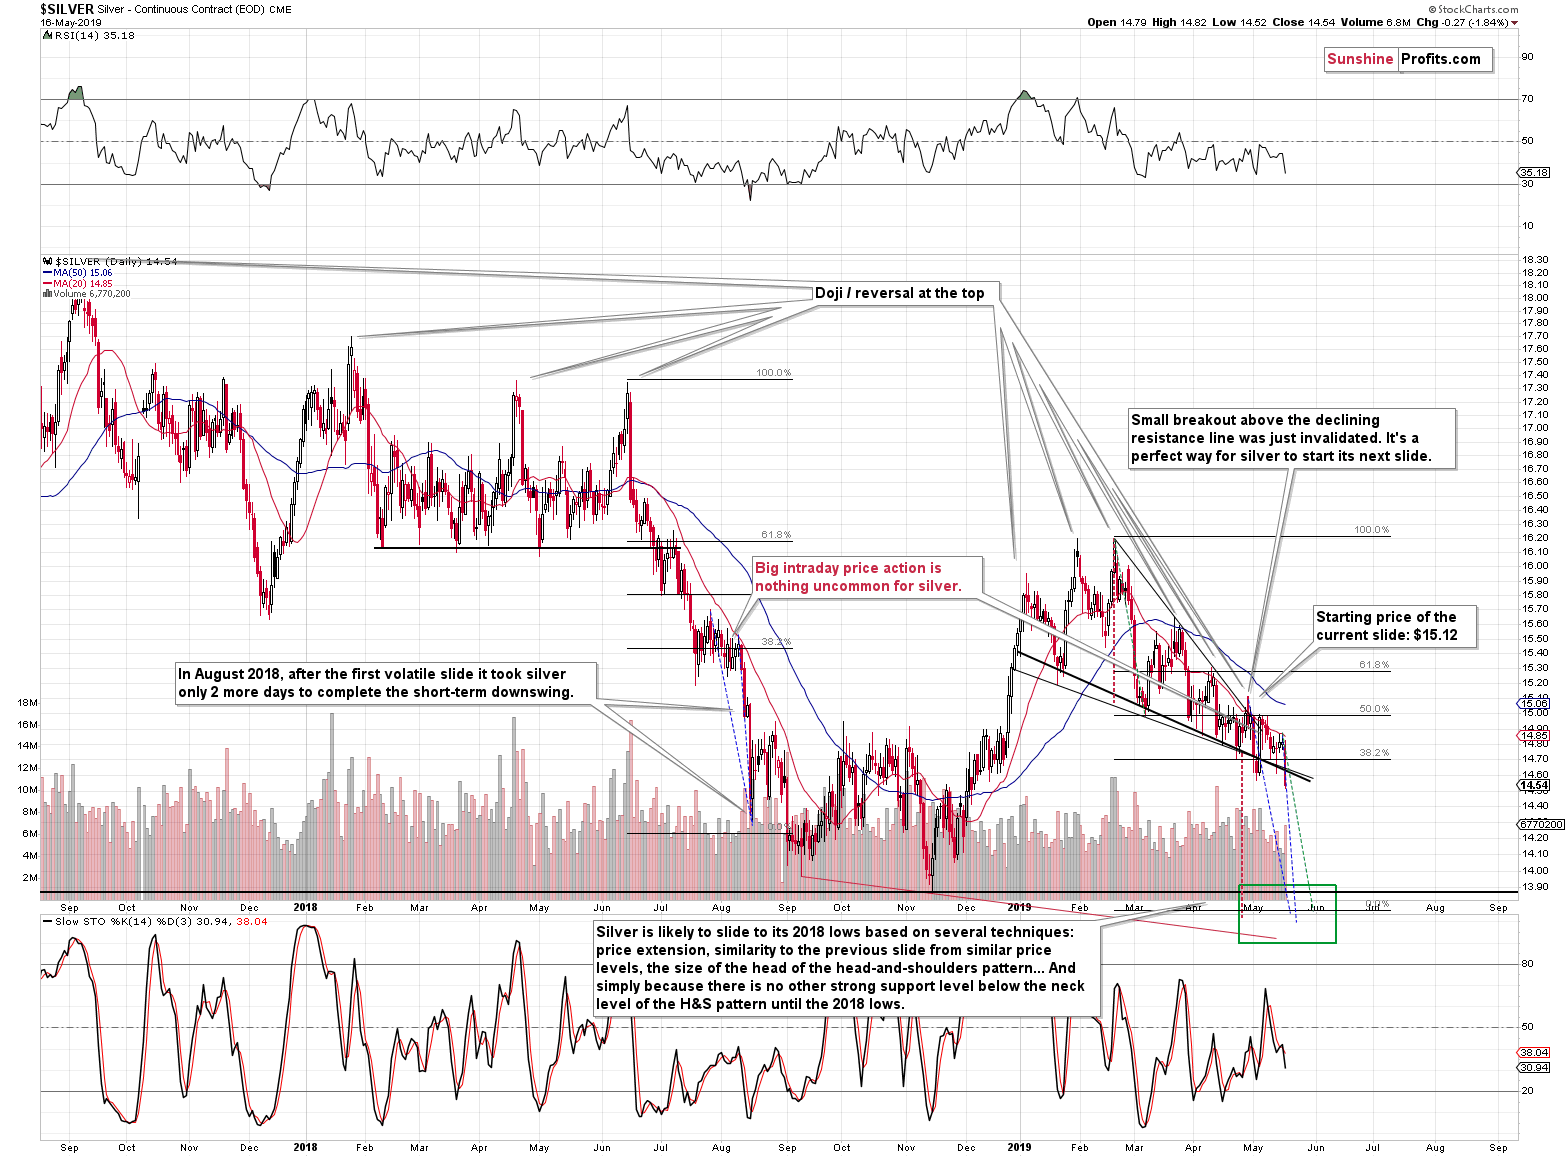
Silver moved to new 2019 low, broke below the declining support lines and appears to be on its way to the 2015 bottom. Will silver definitely continue the slide immediately? That seems likely, but it might also choose to move temporarily one once again, just like it did in early part of the month. Gold's invalidation, however, suggests that silver will really slide this time.
If we apply the same technique to silver that we applied to gold i.e. copy the February - March decline and apply it to the current situation, we will get one more confirmation of our downside target for the white metal. It does indeed appear likely to be heading to its 2015 bottom. The green dashed lines show that yet another technique confirms the move below $13.90.
The outlook is clearly bearish.
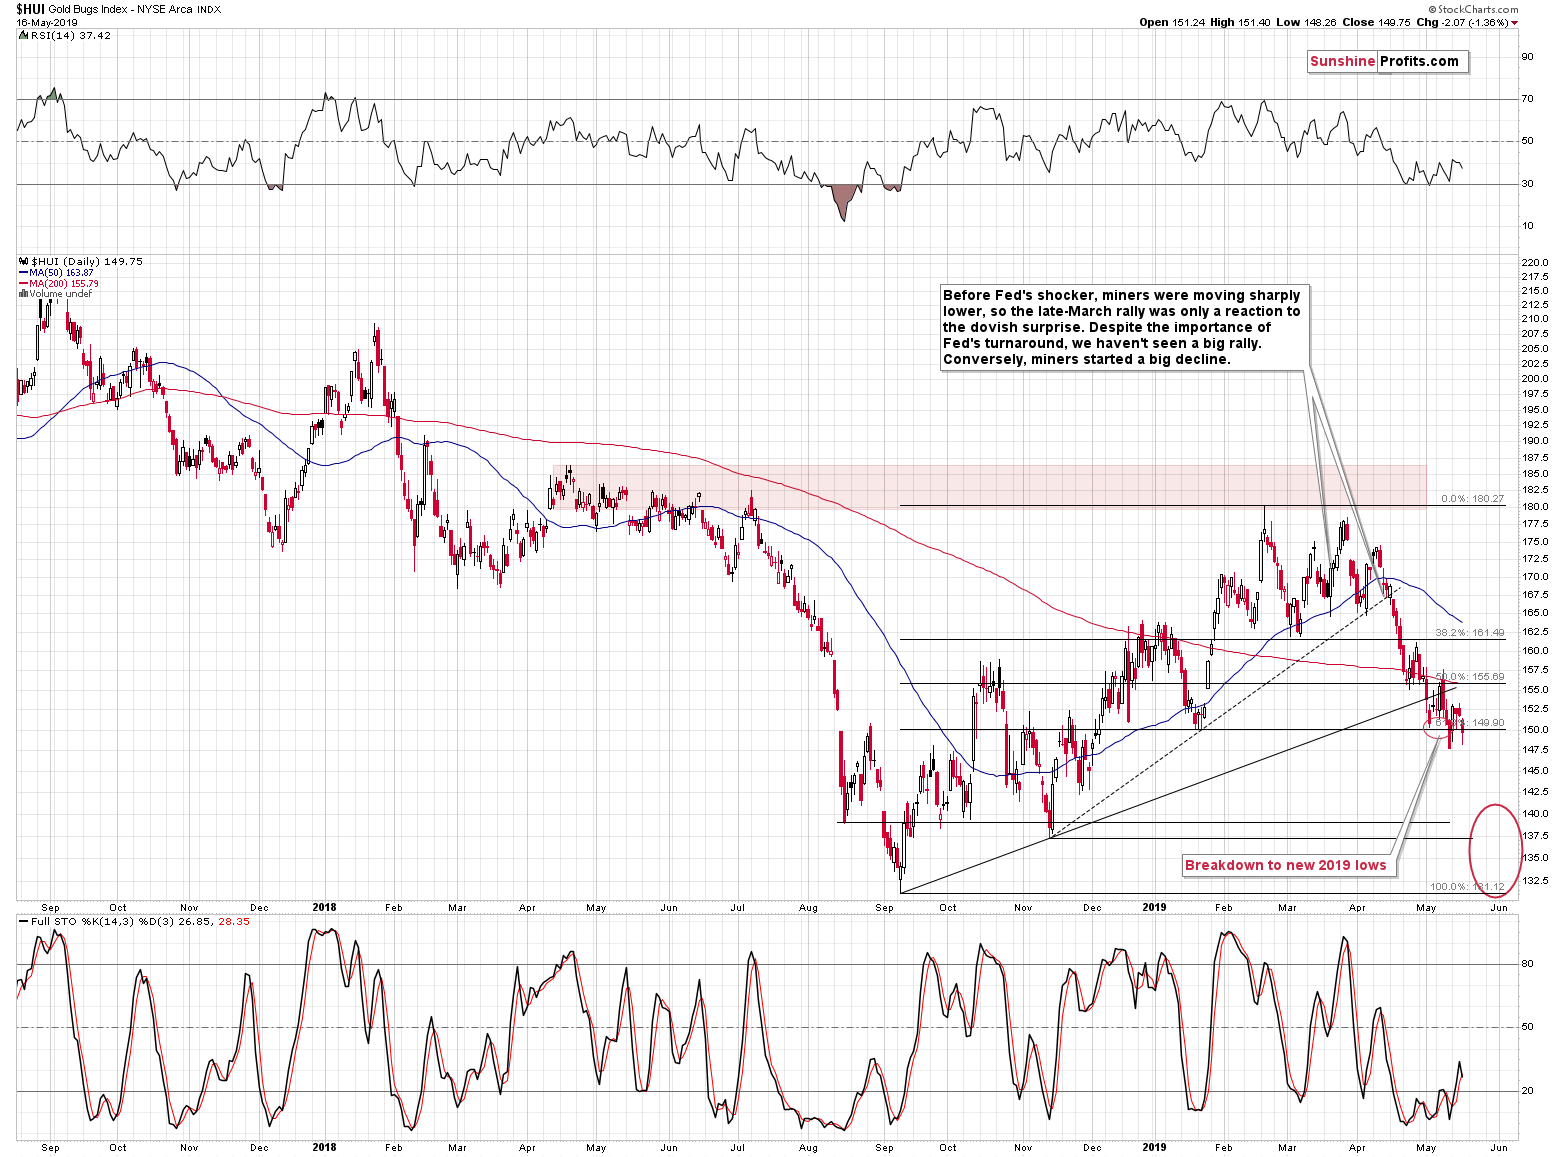
In case of gold stocks, copying the February - March decline to the current situation would provide us with the target of about 138. However, let's keep in mind that gold miners are now underperforming gold much more than they had been earlier this year. Consequently, such a target might be too high. The move to the 2018 lows seems much more likely.
The breakdown below the rising support line is more than confirmed, and the previous invalidation of the breakdown below the January low failed to trigger a substantial rally. Given gold's invalidation it seems that the current breakdown (HUI is once again below the January lows) will succeed and we'll see much lower mining stock values shortly.
Summary
Summing up, yesterday's decline made it crystal clear what the precious metals market really wants to do next. Silver declined to new 2019 lows while gold invalidated the previous small breakouts. But, does it mean that gold absolutely has to slide today? No. The initial slides were quite often followed by a daily pause (or a decline of smaller magnitude) that was then followed by the real move lower. This means that not much might happen today, and it would not invalidate anything that we wrote - it would be quite natural. In this case, we would expect to see the full-blown slide next week. Let's keep in mind that options expire today, which is a reason to expect market to hold its breath today and leave the big moves for the next week. The potential profits on this decline are enormous, and a daily pause wouldn't change it at all.
To summarize:
Trading capital (supplementary part of the portfolio; our opinion): Full short position (250% of the full position) in gold, silver, and mining stocks is justified from the risk/reward perspective with the following stop-loss orders and exit profit-take price levels:
- Gold: profit-take exit price: $1,241; stop-loss: $1,357; initial target price for the DGLD ETN: $51.87; stop-loss for the DGLD ETN $39.87
- Silver: profit-take exit price: $13.81; stop-loss: $15.72; initial target price for the DSLV ETN: $39.38; stop-loss for the DSLV ETN $26.97
- Mining stocks (price levels for the GDX ETF): profit-take exit price: $17.61; stop-loss: $24.17; initial target price for the DUST ETF: $34.28; stop-loss for the DUST ETF $15.47
In case one wants to bet on junior mining stocks' prices (we do not suggest doing so - we think senior mining stocks are more predictable in the case of short-term trades - if one wants to do it anyway, we provide the details), here are the stop-loss details and target prices:
- GDXJ ETF: profit-take exit price: $24.71; stop-loss: $35.67
- JDST ETF: profit-take exit price: $78.21 stop-loss: $30.97
Long-term capital (core part of the portfolio; our opinion): No positions (in other words: cash)
Insurance capital (core part of the portfolio; our opinion): Full position
Whether you already subscribed or not, we encourage you to find out how to make the most of our alerts and read our replies to the most common alert-and-gold-trading-related-questions.
Please note that the in the trading section we describe the situation for the day that the alert is posted. In other words, it we are writing about a speculative position, it means that it is up-to-date on the day it was posted. We are also featuring the initial target prices, so that you can decide whether keeping a position on a given day is something that is in tune with your approach (some moves are too small for medium-term traders and some might appear too big for day-traders).
Plus, you might want to read why our stop-loss orders are usually relatively far from the current price.
Please note that a full position doesn't mean using all of the capital for a given trade. You will find details on our thoughts on gold portfolio structuring in the Key Insights section on our website.
As a reminder - "initial target price" means exactly that - an "initial" one, it's not a price level at which we suggest closing positions. If this becomes the case (like it did in the previous trade) we will refer to these levels as levels of exit orders (exactly as we've done previously). Stop-loss levels, however, are naturally not "initial", but something that, in our opinion, might be entered as an order.
Since it is impossible to synchronize target prices and stop-loss levels for all the ETFs and ETNs with the main markets that we provide these levels for (gold, silver and mining stocks - the GDX ETF), the stop-loss levels and target prices for other ETNs and ETF (among other: UGLD, DGLD, USLV, DSLV, NUGT, DUST, JNUG, JDST) are provided as supplementary, and not as "final". This means that if a stop-loss or a target level is reached for any of the "additional instruments" (DGLD for instance), but not for the "main instrument" (gold in this case), we will view positions in both gold and DGLD as still open and the stop-loss for DGLD would have to be moved lower. On the other hand, if gold moves to a stop-loss level but DGLD doesn't, then we will view both positions (in gold and DGLD) as closed. In other words, since it's not possible to be 100% certain that each related instrument moves to a given level when the underlying instrument does, we can't provide levels that would be binding. The levels that we do provide are our best estimate of the levels that will correspond to the levels in the underlying assets, but it will be the underlying assets that one will need to focus on regarding the signs pointing to closing a given position or keeping it open. We might adjust the levels in the "additional instruments" without adjusting the levels in the "main instruments", which will simply mean that we have improved our estimation of these levels, not that we changed our outlook on the markets. We are already working on a tool that would update these levels on a daily basis for the most popular ETFs, ETNs and individual mining stocks.
Our preferred ways to invest in and to trade gold along with the reasoning can be found in the how to buy gold section. Additionally, our preferred ETFs and ETNs can be found in our Gold & Silver ETF Ranking.
As a reminder, Gold & Silver Trading Alerts are posted before or on each trading day (we usually post them before the opening bell, but we don't promise doing that each day). If there's anything urgent, we will send you an additional small alert before posting the main one.
=====
Latest Free Trading Alerts:
The Fed promised that the quantitative easing would be only temporary and that it would reduce its ballooned balance sheet to the pre-crisis level. Now, as the Fed adopted an interest targeting with ample-reserves, we know that this is not going to happen. We invite you to read our today's article about the new Fed's regime and find out how it works and what it implies for the US monetary policy and the precious metals.
What Does the New Fed's Regime Imply for Gold?
=====
Thank you.
Sincerely,
Przemyslaw Radomski, CFA
Editor-in-chief, Gold & Silver Fund Manager

