

Briefly: in our opinion, full (300% of the regular position size) speculative short positions in mining stocks are justified from the risk/reward point of view at the moment of publishing this Alert.
Gold didn’t do much yesterday, but there was more than one thing that happening that served as an additional bearish confirmation. The most important sign came from silver’s short-term outperformance.
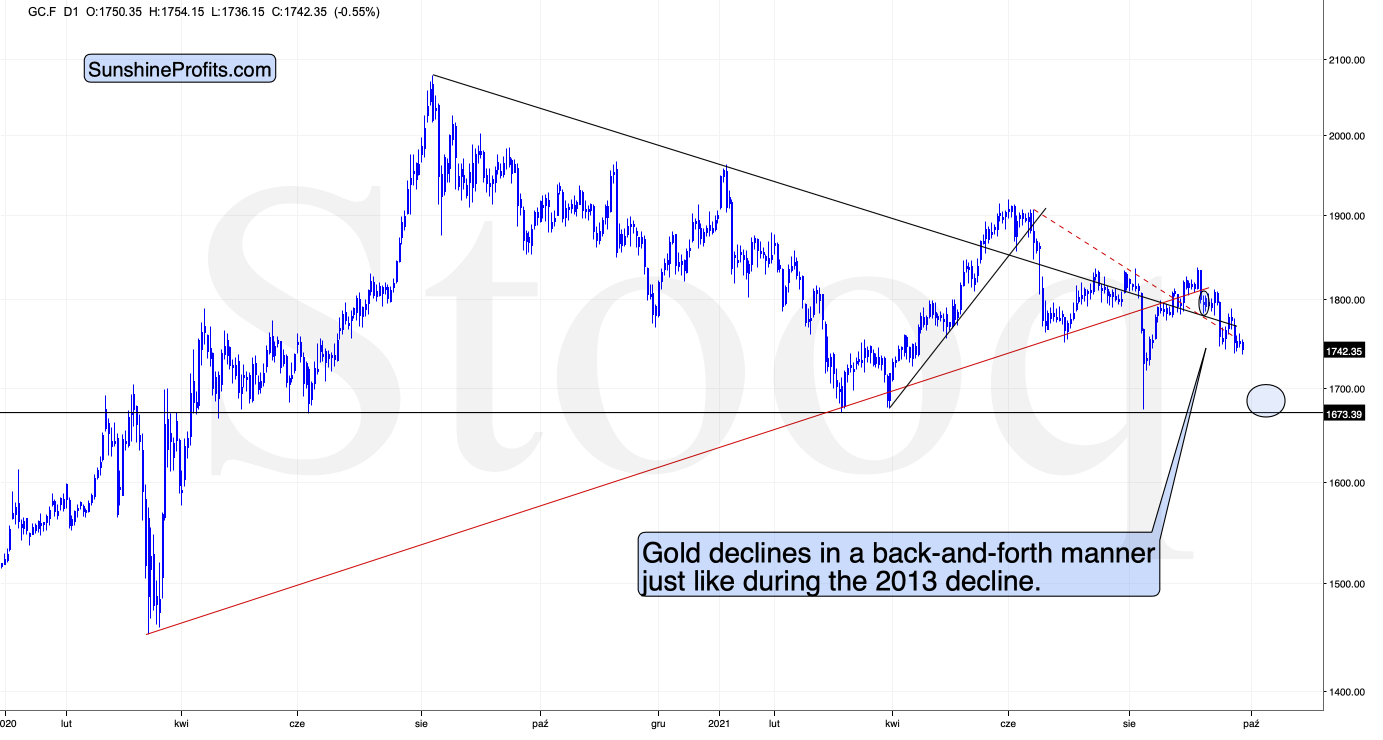
As you can see on the above chart, gold formed a bearish reversal candlestick yesterday, and it moved lower in today’s pre-market trading. Since it has just moved to a new monthly low, it could be the case that yet another small corrective upswing is already over.
“Yet another,” as gold has been declining in a back-and-forth manner for a few weeks now. As I explained yesterday and in the previous weeks, this makes the current situation similar to what we saw previously – in 2013.
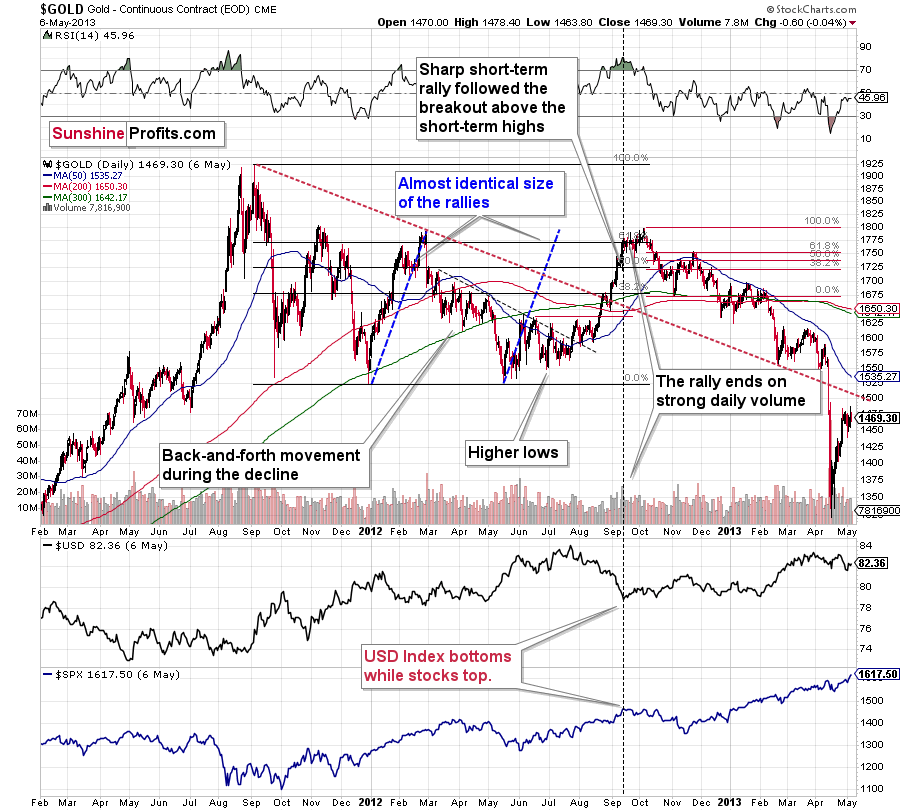
Between September 2012 and February 2013, gold declined in a back-and-forth manner as well, and the current situation seems to be analogous to what we saw in February 2013. At the time, the final short-term upswing took gold to its 50-day moving average (marked with blue), and we saw something very similar recently. The recent high ($1788.40) was very close to gold’s 50-day moving average too – less than $10 from it.
Silver in the Spotlight
However, as I wrote at the beginning of today’s analysis, the key bearish sign of yesterday’s session came from silver.
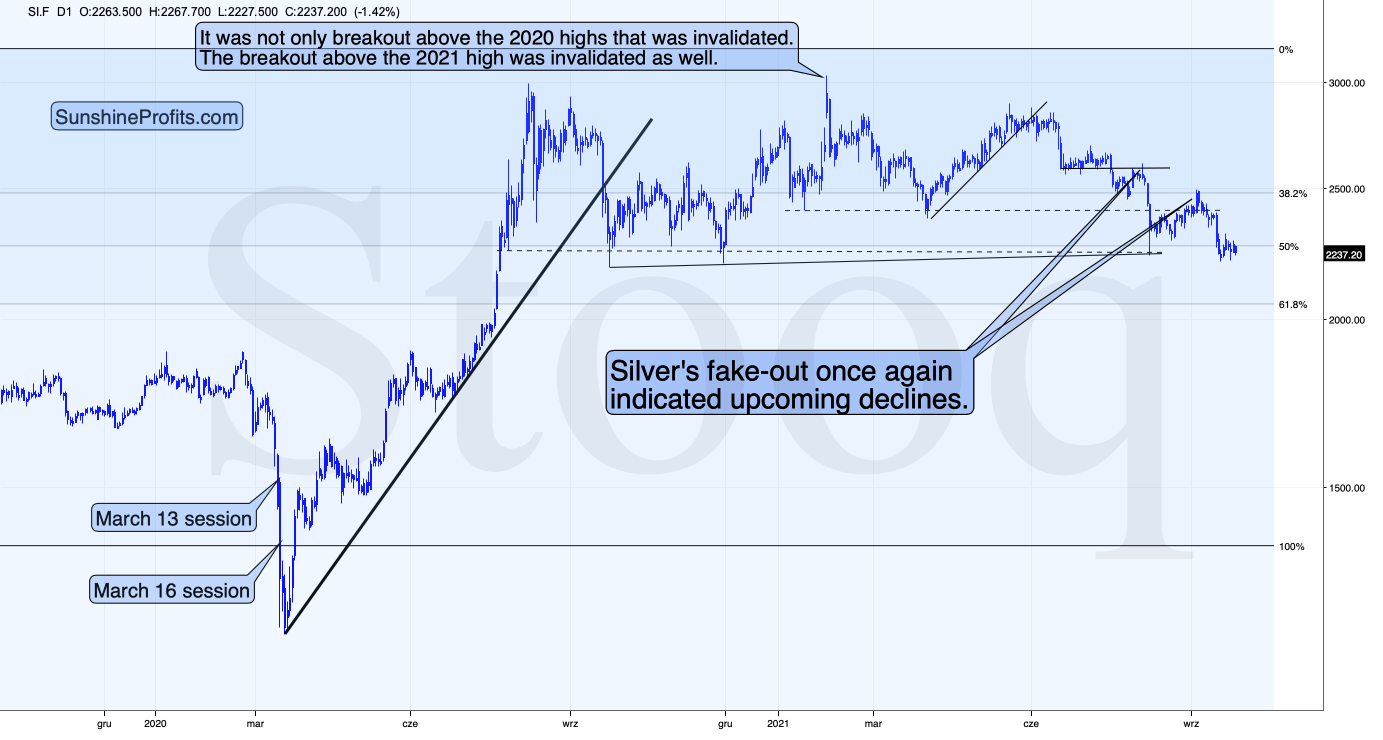
While gold ended yesterday’s session only 0.02% higher, silver ended it 1.20% higher. This means that silver outperformed gold yesterday. Silver’s short-term outperformance of gold is bearish, especially when it’s accompanied by mining stocks’ weakness relative to gold.
While miners didn’t underperform gold yesterday, they did so on Friday. Thus, it’s fair to say that we saw a mix of those two important signs, and they together paint a bearish picture for the short run.
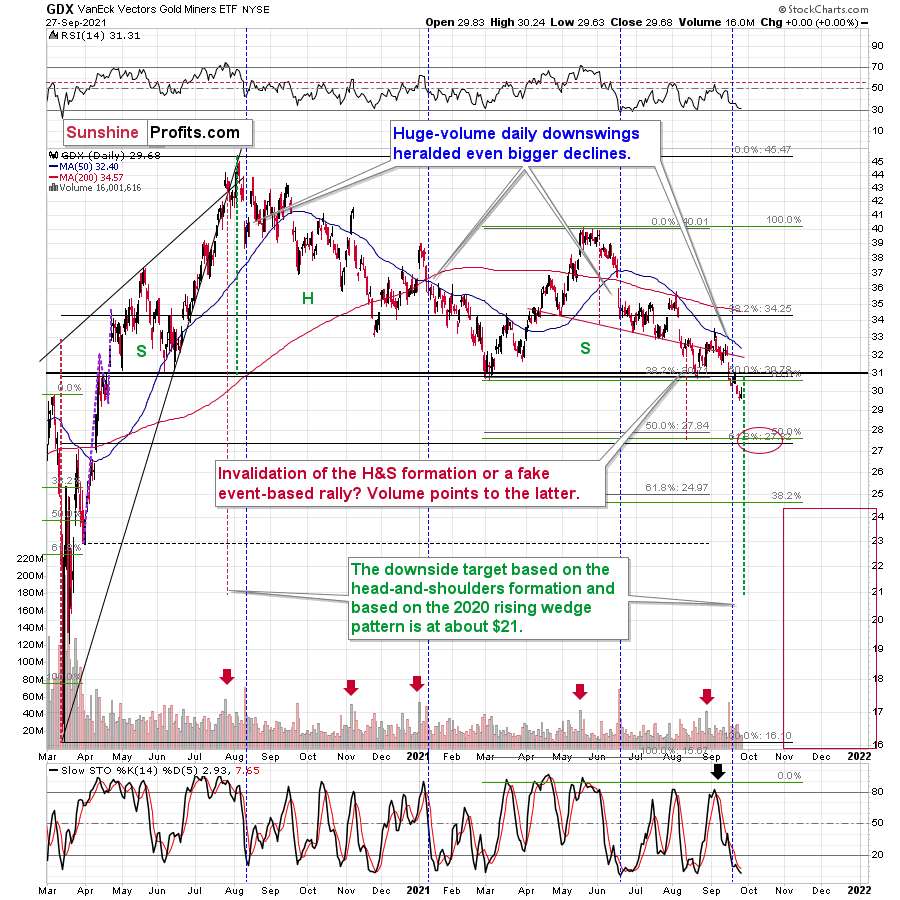
Despite the intraday rally, the GDX ETF ended yesterday’s session completely unchanged.
And while gold and silver moved slightly higher, GDX did nothing, and the GDXJ ETF underperformed, just as it was likely to.
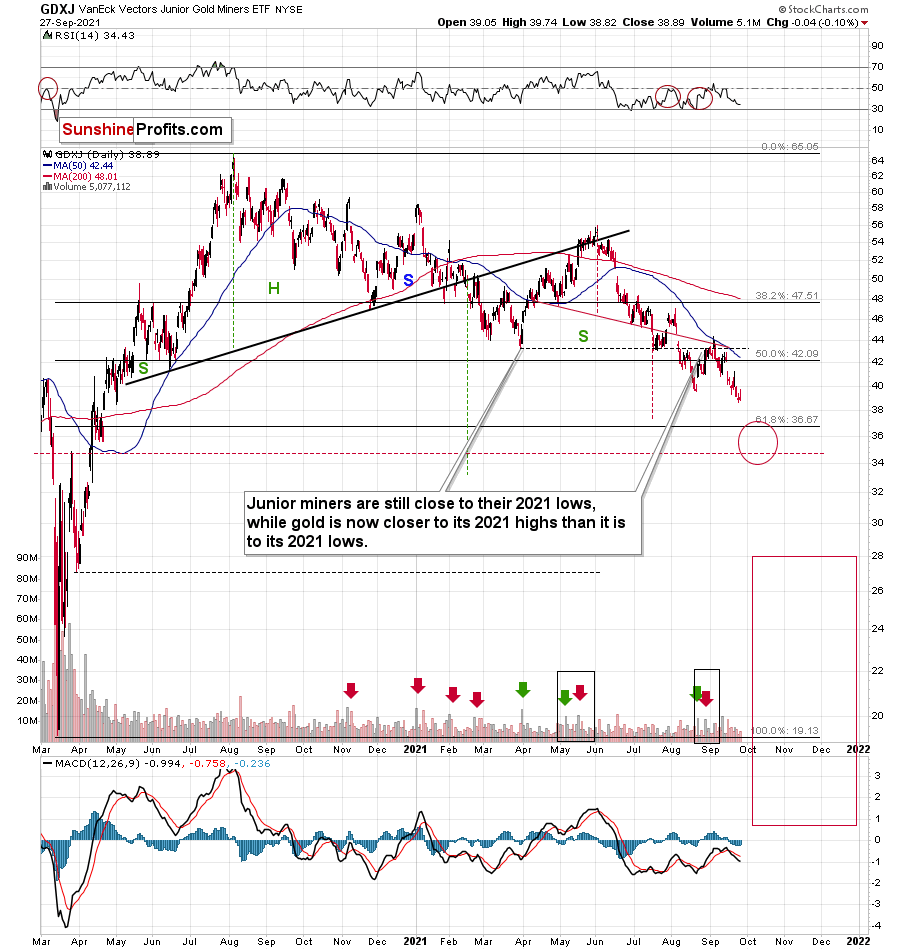
The GDXJ declined by 0.1%. This may not be a lot, but the GDXJ was once again one of the weakest parts of the precious metals sector, which bodes well for our profitable short positions in the junior miners. The fact that this was the lowest close that we saw so far (!) this year adds to the bearish implications.
The USD Index
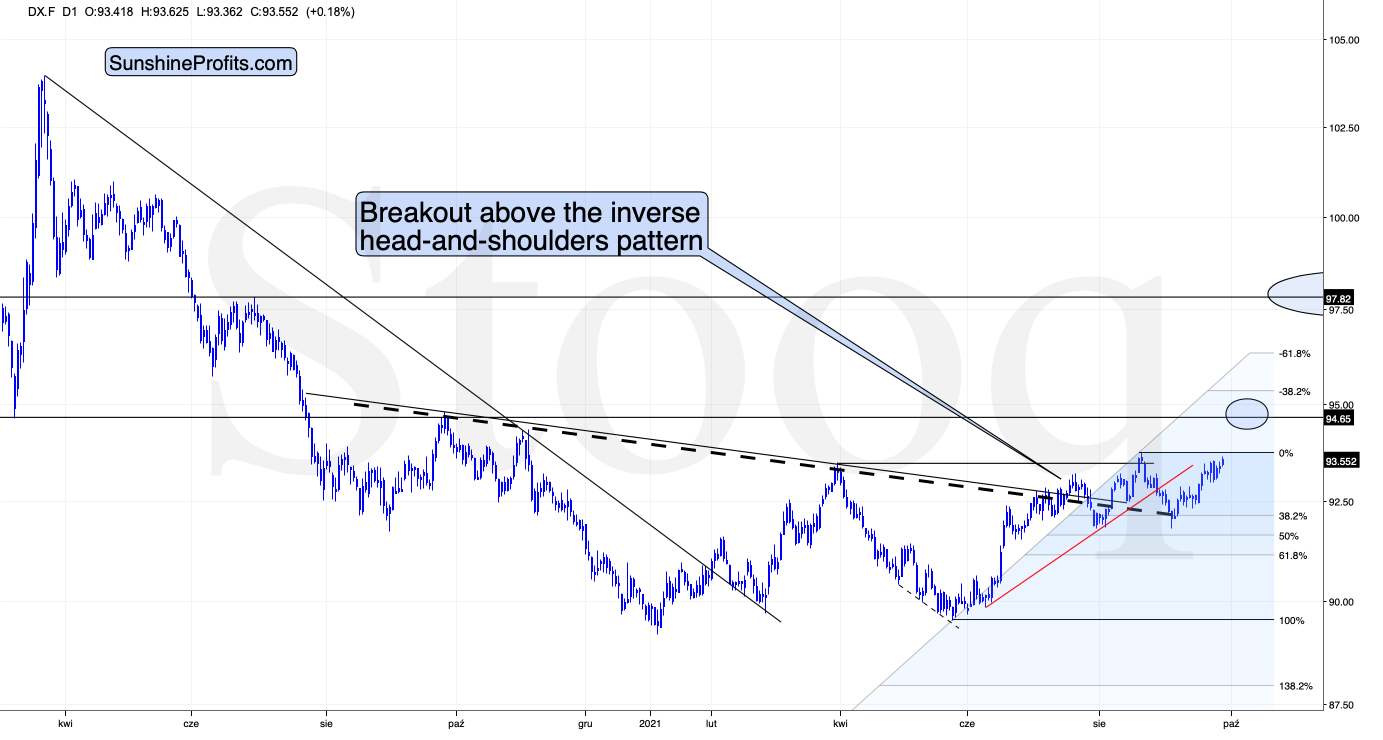
So far, the USD Index is just a bit higher in today’s pre-market trading, but it seems that the next big run-up is at hand.
Why? Because the USDX has been consolidating above the inverse head and shoulders pattern breakout for a long time, and it’s relatively uncommon for the consolidations to take this long — let alone even longer.
And as the USD Index rallies, gold, silver, and mining stocks are likely to decline. Since they are weak even without USD’s help, the upcoming decline in the PMs and miners is likely to be profound.
Having said that, let’s move to the fundamental part of today’s analysis.
Falling With the Temperature
While the S&P 500 has rallied back from the Evergrande panic, it’s important to remember that the U.S. equity benchmark hasn’t made a new high. And while the PMs’ downtrend is independent of the performance of the general stock market, a profound decline of the latter could severely impact the former.
Case in point: with growth stocks vastly outperforming value stocks since the global financial crisis (GFC), today’s valuations rival the dot-com bubble. And with Big Tech (which accounts for nearly 28% of the movement of the S&P 500) confronting a material re-rating, a sharp decline could sink the S&P 500.
Please see below:
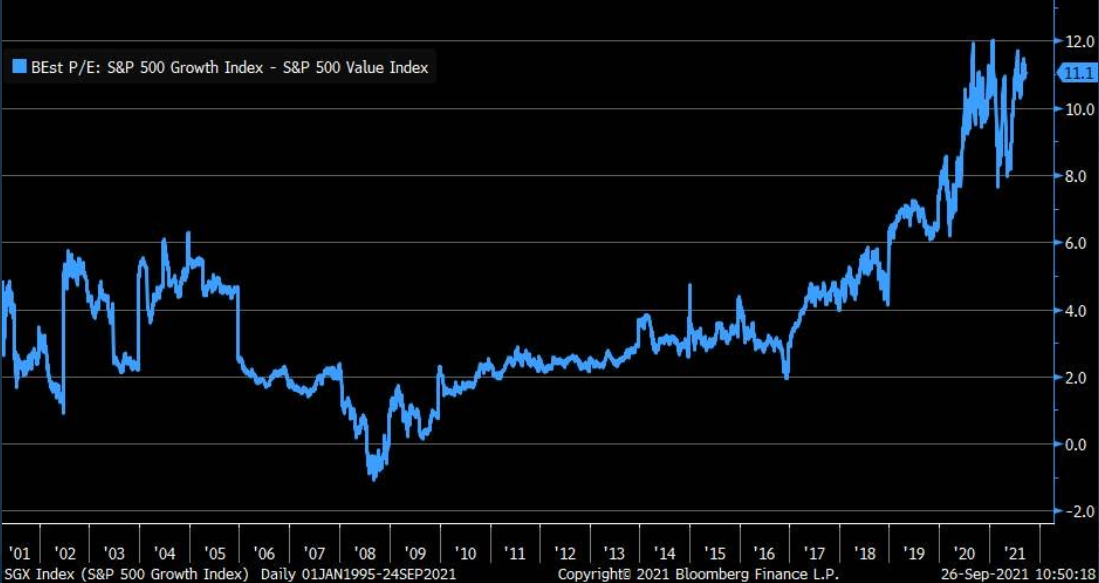 Source: Bloomberg/Liz Ann Sonders
To explain, the blue line above tracks the spread between the consolidated forward price-to-earnings (P/E) ratio of growth stocks relative to value stocks. For context, when the blue line is rising, it means that growth stocks’ valuations are increasing at a faster pace (or declining at a slower pace) than value stocks, and when the blue line is falling, it means that value stocks’ valuations are increasing at a faster pace (or declining at a slower pace) than growth stocks. If you analyze the right side of the chart, you can see that investors’ willingness to pay up for growth stocks has reached epic heights. However, with historically low long-term interest rates underwriting the ~13 years of excess, a reversion to the mean could have profound consequences.
For example, Savita Subramanian, head of U.S. equity and quantitative strategy at Bank of America, likened the S&P 500 to a 36-year zero-coupon bond. For context, the longer a bond’s time to maturity (duration), the more interest rate risk an investor confronts. And with the S&P 500’s current composition (leveraged to growth stocks) mirroring the longest of long-term bonds, a material rise in interest rates could have a devastating impact on the overall index.
“The S&P 500 has essentially turned into a 36-year, zero-coupon bond,” said Subramanian. “If you look at the duration of the market today, it’s basically longer duration than it’s ever been. The threat is that any move higher in the cost of capital via interest rates, credit spreads, equity risk premia, that’s basically going to be a huge knock on the market relative to the sensitivity we’ve seen in the past.”
On top of that, analysts’ forward earnings per share (EPS) estimates for the S&P 500 have essentially flat-lined and a major driver of the stock market’s recent ascent may have already reached its precipice. For example, Nike, FedEx and American Airlines have already issued revenue and/or profit warnings for the autumn quarter. And if the ominous warnings continue, fresh EPS downgrades could weigh heavily on the S&P 500.
Please see below:
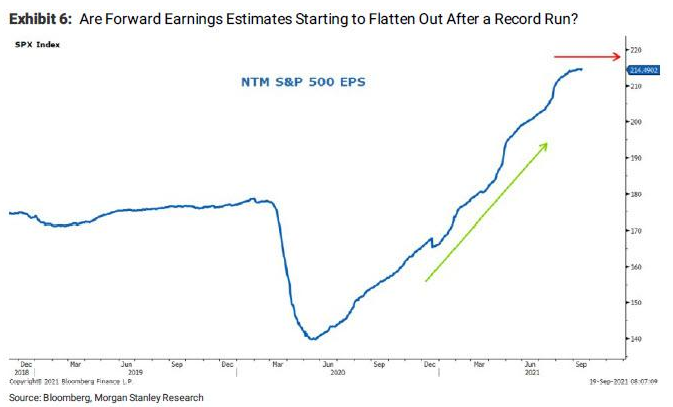
To explain, the blue line above tracks analysts’ consolidated S&P 500 forward EPS estimates. If you analyze the ascent on the right side of the chart, you can see that earnings optimism helped fuel the S&P 500’s sharp rally off the bottom. However, with the Delta variant clouding the near-term outlook and earnings momentum sputtering, the S&P 500 could come under pressure if more downgrades materialize.
To that point, Mike Wilson, Chief U.S. Equity Strategist at Morgan Stanley, wrote that “even if the economy rebounds in 4Q from the slowdown this summer, it likely won't translate into higher earnings estimates as incremental margins rollover due to higher costs and taxes. This is the [opposite] of the past year when costs were being eliminated as revenues benefitted greatly from the fiscal stimulus.”
A Sharp Turn
What’s more, with the S&P 500’s earnings revision breadth (ERB) – which compares the number of earnings upgrades to the number of earnings downgrades – already two standard deviations above its historical average, a reversion to the mean implies a sharp correction of the S&P 500.
Please see below:
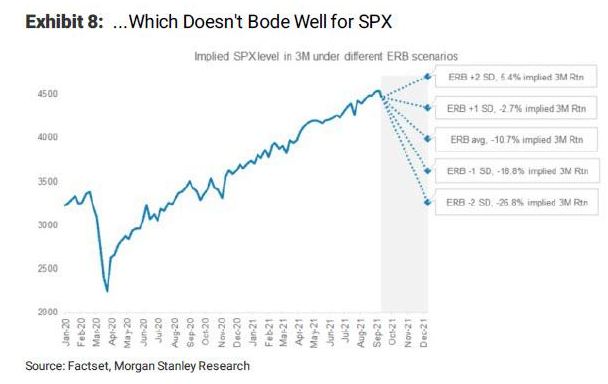
To explain, the solid blue line above tracks the trajectory of the S&P 500’s ERB. If you analyze the dotted blue lines on the right side of the chart, you can see that a return to the historical average ERB implies a 10.7% drawdown of the S&P 500. Likewise, a decline in the ERB to one standard deviation below its historical average implies an 18.8% drawdown of the S&P 500. As a result, unless a slew of earnings upgrades commence, the S&P 500’s risk-reward is severely tilted to the downside.
Continuing the theme, macroeconomic headwinds are also rearing their ugly heads. For example, with U.S. PMIs falling from their stimulus-induced spikes, supply chain woes and the nagging Delta variant are weighing on business sentiment. And with Wilson forecasting a sharp decline in the Institute for Supply Management’s (ISM) manufacturing PMI over the next few months, the S&P 500 may follow in the former’s footsteps.
Please see below:
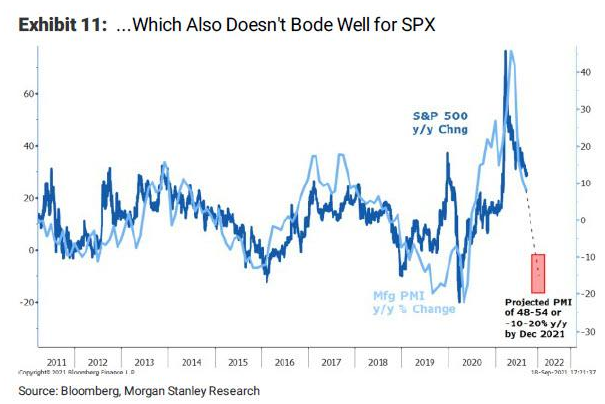
To explain, the dark blue line above tracks the year-over-year (YoY) percentage change in the S&P 500, while the light blue line above tracks the YoY percentage change in the ISM’s manufacturing PMI. If you analyze the red box on the right side of the chart, a PMI in the 48-54 range implies a 10% to 20% drawdown of the S&P 500 (by Dec. 2021). Moreover, if the PMI weakness also coincides with/follows the Fed’s official taper announcement, heightened volatility could confront the S&P 500.
As a result, Wilson concludes:
“With our year-end target 10% below current levels, our view is clear: the mid-cycle transition will end with the rolling correction finally hitting the S&P 500.” And while the “fire” scenario implies a modest 10% correction, the “‘ice’ scenario [a ~20%+ decline] is starting to look more likely, in our opinion, and could result in a more destructive and unexpected outcome.”
Could Blackout Periods Turn Off the Glow?
Finally, while the cooler weather should cool investors’ optimism over the next few months, a short-term problem has also entered the equation.
Please see below:
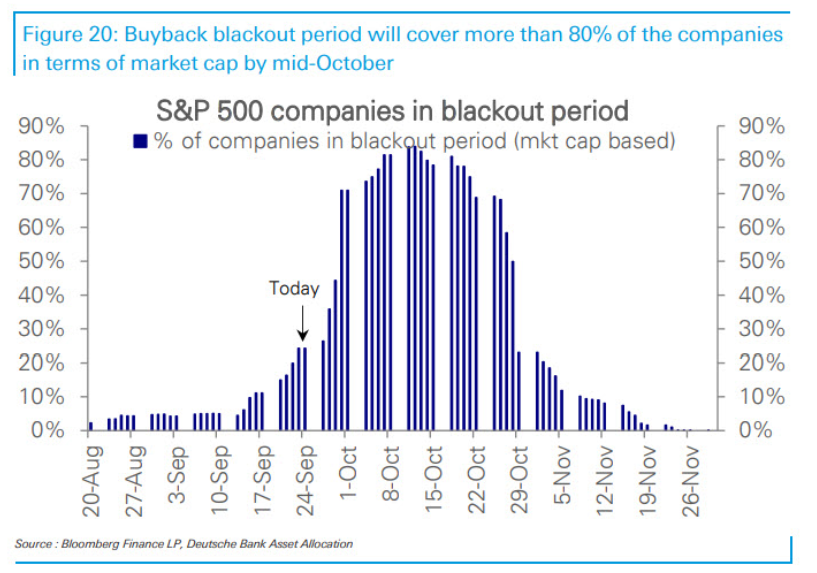
To explain, the purple bars above track the percentage of S&P 500 companies confronted with a buyback blackout period. For context, share buybacks are a profound driver of the stock market’s performance and corporate executives use the gambit to increase their company’s EPS (by reducing the number of shares outstanding). Moreover, a blackout period (usually during earnings season) means that corporate executives can’t buy back their company’s stock, and currently 25% of S&P 500 companies (market-cap weighted) are already in a blackout period. However, by mid-October, more than 80% of S&P 500 companies (market-cap weighted) will be in a blackout period. As a result, one of the stock market’s largest buyers will be missing in action over the next ~30 days.
The bottom line? While the S&P 500 remains sanguine for now, a profound drawdown could severely impact the PMs. And while they can still decline without the S&P 500’s help (as we’ve witnessed in 2021), Wilson’s “ice” scenario is the most bearish fundamental outcome confronting the PMs. Thus, downside risks for many assets remain materially elevated.
In conclusion, the PMs were largely flat on Sep. 27, though the gold miners still underperformed gold. Moreover, with the U.S. 10-Year Treasury yield (briefly) rising above 1.50% for the first time since late June, and the EUR/USD falling below 1.1700 once again, Treasury yields’ uprising and USD Index strength haven’t let up. As a result, the PMs’ slide likely has more room to run.
Overview of the Upcoming Part of the Decline
- It seems to me that the corrective upswing in gold is over, and the big decline seems to be already underway.
- It seems that the first stop for gold will be close to its previous 2021 lows, slightly below $1,700. Then it will likely correct a bit, but it’s unclear if I want to exit or reverse the current short position based on that – it depends on the number and the nature of the bullish indications that we get at that time.
- After the above-mentioned correction, we’re likely to see a powerful slide, perhaps close to the 2020 low ($1,450 - $1,500).
- If we see a situation where miners slide in a meaningful and volatile way while silver doesn’t (it just declines moderately), I plan to switch from short positions in miners to short positions in silver. At this time, it’s too early to say at what price levels this could take place, and if we get this kind of opportunity at all – perhaps with gold close to $1,600.
- I plan to exit all remaining short positions when gold shows substantial strength relative to the USD Index while the latter is still rallying. This might take place with gold close to $1,350 - $1,400. I expect silver to fall the hardest in the final part of the move. This moment (when gold performs very strongly against the rallying USD and miners are strong relative to gold after its substantial decline) is likely to be the best entry point for long-term investments, in my view. This might also happen with gold close to $1,375, but it’s too early to say with certainty at this time. I expect the final bottom to take place near the end of the year, perhaps in mid-December.
- As a confirmation for the above, I will use the (upcoming or perhaps we have already seen it?) top in the general stock market as the starting point for the three-month countdown. The reason is that after the 1929 top, gold miners declined for about three months after the general stock market started to slide. We also saw some confirmations of this theory based on the analogy to 2008. All in all, the precious metals sector is likely to bottom about three months after the general stock market tops.
- The above is based on the information available today, and it might change in the following days/weeks.
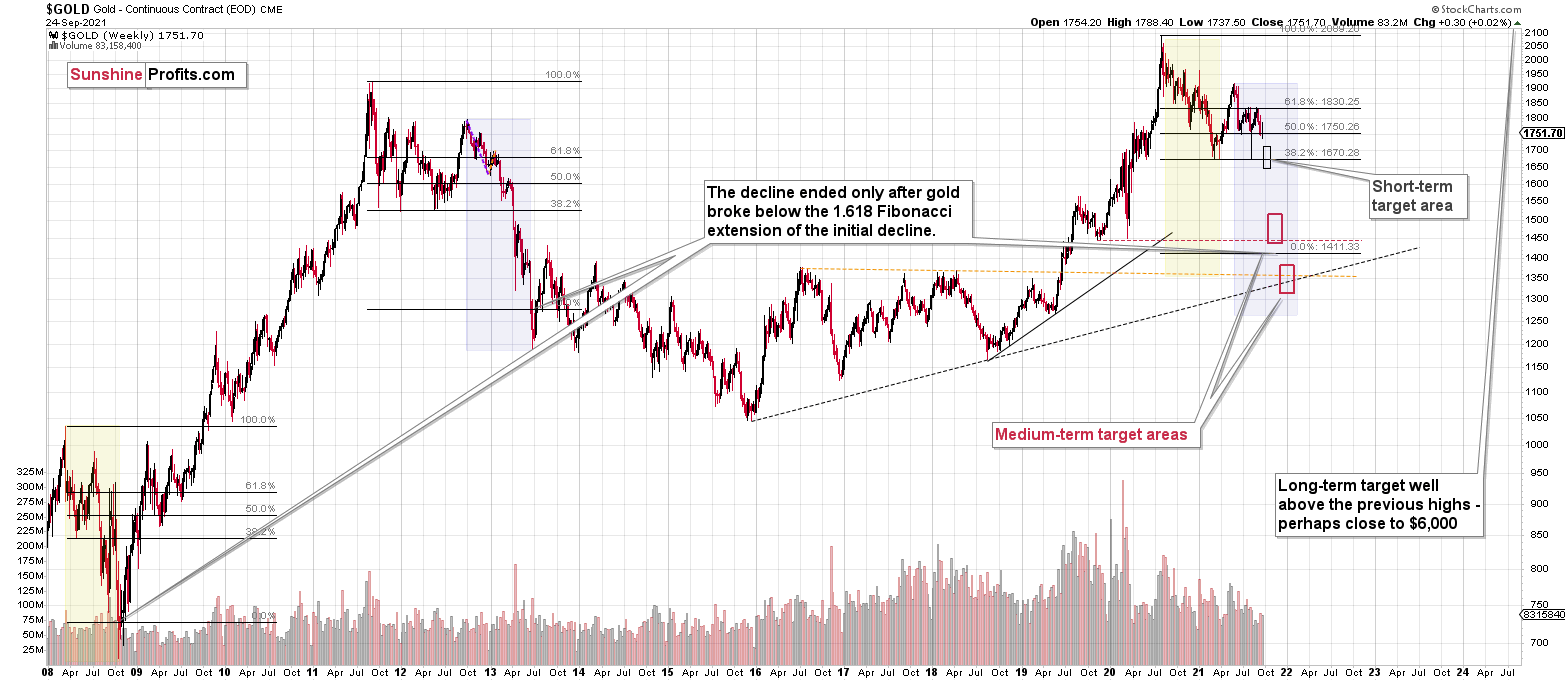
You will find my general overview of the outlook for gold on the chart below:
Please note that the above timing details are relatively broad and “for general overview only” – so that you know more or less what I think and how volatile I think the moves are likely to be – on an approximate basis. These time targets are not binding or clear enough for me to think that they should be used for purchasing options, warrants or similar instruments.
Summary
To summarize, the outlook for the precious metals sector remains extremely bearish for the next few months.
The decline to new lows in practically all important proxies for mining stocks despite a lack thereof in gold serves as an important short-term confirmation for the bearish case. However, the key two long-term factors remain the analogy to 2013 in gold and the broad head and shoulders pattern in the HUI Index. They both suggest much lower prices ahead.
It seems that our profits from the short positions are going to become truly epic in the following weeks.
After the sell-off (that takes gold to about $1,350 - $1,500), I expect the precious metals to rally significantly. The final part of the decline might take as little as 1-5 weeks, so it's important to stay alert to any changes.
Most importantly, please stay healthy and safe. We made a lot of money last March and this March, and it seems that we’re about to make much more on the upcoming decline, but you have to be healthy to enjoy the results.
As always, we'll keep you - our subscribers - informed.
By the way, we’re currently providing you with the possibility to extend your subscription by a year, two years or even three years with a special 20% discount. This discount can be applied right away, without the need to wait for your next renewal – if you choose to secure your premium access and complete the payment upfront. The boring time in the PMs is definitely over, and the time to pay close attention to the market is here. Naturally, it’s your capital, and the choice is up to you, but it seems that it might be a good idea to secure more premium access now while saving 20% at the same time. Our support team will be happy to assist you in the above-described upgrade at preferential terms – if you’d like to proceed, please contact us.
To summarize:
Trading capital (supplementary part of the portfolio; our opinion): Full speculative short positions (300% of the full position) in mining stocks are justified from the risk to reward point of view with the following binding exit profit-take price levels:
Mining stocks (price levels for the GDXJ ETF): binding profit-take exit price: $35.73; stop-loss: none (the volatility is too big to justify a stop-loss order in case of this particular trade)
Alternatively, if one seeks leverage, we’re providing the binding profit-take levels for the JDST (2x leveraged) and GDXD (3x leveraged – which is not suggested for most traders/investors due to the significant leverage). The binding profit-take level for the JDST: $16.96; stop-loss for the JDST: none (the volatility is too big to justify a SL order in case of this particular trade); binding profit-take level for the GDXD: $35.46; stop-loss for the GDXD: none (the volatility is too big to justify a SL order in case of this particular trade).
For-your-information targets (our opinion; we continue to think that mining stocks are the preferred way of taking advantage of the upcoming price move, but if for whatever reason one wants / has to use silver or gold for this trade, we are providing the details anyway.):
Silver futures upside profit-take exit price: unclear at this time - initially, it might be a good idea to exit, when gold moves to $1,683
Gold futures upside profit-take exit price: $1,683
HGD.TO – alternative (Canadian) inverse 2x leveraged gold stocks ETF – the upside profit-take exit price: $11.38
Long-term capital (core part of the portfolio; our opinion): No positions (in other words: cash
Insurance capital (core part of the portfolio; our opinion): Full position
Whether you already subscribed or not, we encourage you to find out how to make the most of our alerts and read our replies to the most common alert-and-gold-trading-related-questions.
Please note that we describe the situation for the day that the alert is posted in the trading section. In other words, if we are writing about a speculative position, it means that it is up-to-date on the day it was posted. We are also featuring the initial target prices to decide whether keeping a position on a given day is in tune with your approach (some moves are too small for medium-term traders, and some might appear too big for day-traders).
Additionally, you might want to read why our stop-loss orders are usually relatively far from the current price.
Please note that a full position doesn't mean using all of the capital for a given trade. You will find details on our thoughts on gold portfolio structuring in the Key Insights section on our website.
As a reminder - "initial target price" means exactly that - an "initial" one. It's not a price level at which we suggest closing positions. If this becomes the case (like it did in the previous trade), we will refer to these levels as levels of exit orders (exactly as we've done previously). Stop-loss levels, however, are naturally not "initial", but something that, in our opinion, might be entered as an order.
Since it is impossible to synchronize target prices and stop-loss levels for all the ETFs and ETNs with the main markets that we provide these levels for (gold, silver and mining stocks - the GDX ETF), the stop-loss levels and target prices for other ETNs and ETF (among other: UGL, GLL, AGQ, ZSL, NUGT, DUST, JNUG, JDST) are provided as supplementary, and not as "final". This means that if a stop-loss or a target level is reached for any of the "additional instruments" (GLL for instance), but not for the "main instrument" (gold in this case), we will view positions in both gold and GLL as still open and the stop-loss for GLL would have to be moved lower. On the other hand, if gold moves to a stop-loss level but GLL doesn't, then we will view both positions (in gold and GLL) as closed. In other words, since it's not possible to be 100% certain that each related instrument moves to a given level when the underlying instrument does, we can't provide levels that would be binding. The levels that we do provide are our best estimate of the levels that will correspond to the levels in the underlying assets, but it will be the underlying assets that one will need to focus on regarding the signs pointing to closing a given position or keeping it open. We might adjust the levels in the "additional instruments" without adjusting the levels in the "main instruments", which will simply mean that we have improved our estimation of these levels, not that we changed our outlook on the markets. We are already working on a tool that would update these levels daily for the most popular ETFs, ETNs and individual mining stocks.
Our preferred ways to invest in and to trade gold along with the reasoning can be found in the how to buy gold section. Furthermore, our preferred ETFs and ETNs can be found in our Gold & Silver ETF Ranking.
As a reminder, Gold & Silver Trading Alerts are posted before or on each trading day (we usually post them before the opening bell, but we don't promise doing that each day). If there's anything urgent, we will send you an additional small alert before posting the main one.
Thank you.
Przemyslaw Radomski, CFA
Founder, Editor-in-chief

