

Briefly: In our opinion, full (150% of the regular full position) speculative short positions in gold, silver and mining stocks are justified from the risk/reward perspective at the moment of publishing this alert.
It’s Monday once again and we once again have the weekly closing prices to comment on. Mining stocks moved a little higher, but gold and silver rallied more visibly on Friday. Gold closed above $1,300 and we saw a major breakout. What are its implications?
The above paragraph is a bit tricky – we didn’t just want to get your attention, we wanted to show you how difficult it sometimes is to see the difference between what things seem to be and what they really are (just like the breakout above $1,300 is perceived like a big deal, while it really isn’t one). By saying that gold closed above $1,300 and that we saw a major breakout we are stating the facts, but what may be surprising is that we are writing about two developments, not one.
Gold’s move above $1,300 is not that important and it is not the major breakout that we will describe in detail later on. The major breakout took place in Japanese stocks and the implications for the gold market are likely very important for the following weeks and months. Why? Let’s take a look at the chart (chart courtesy of http://stockcharts.com).
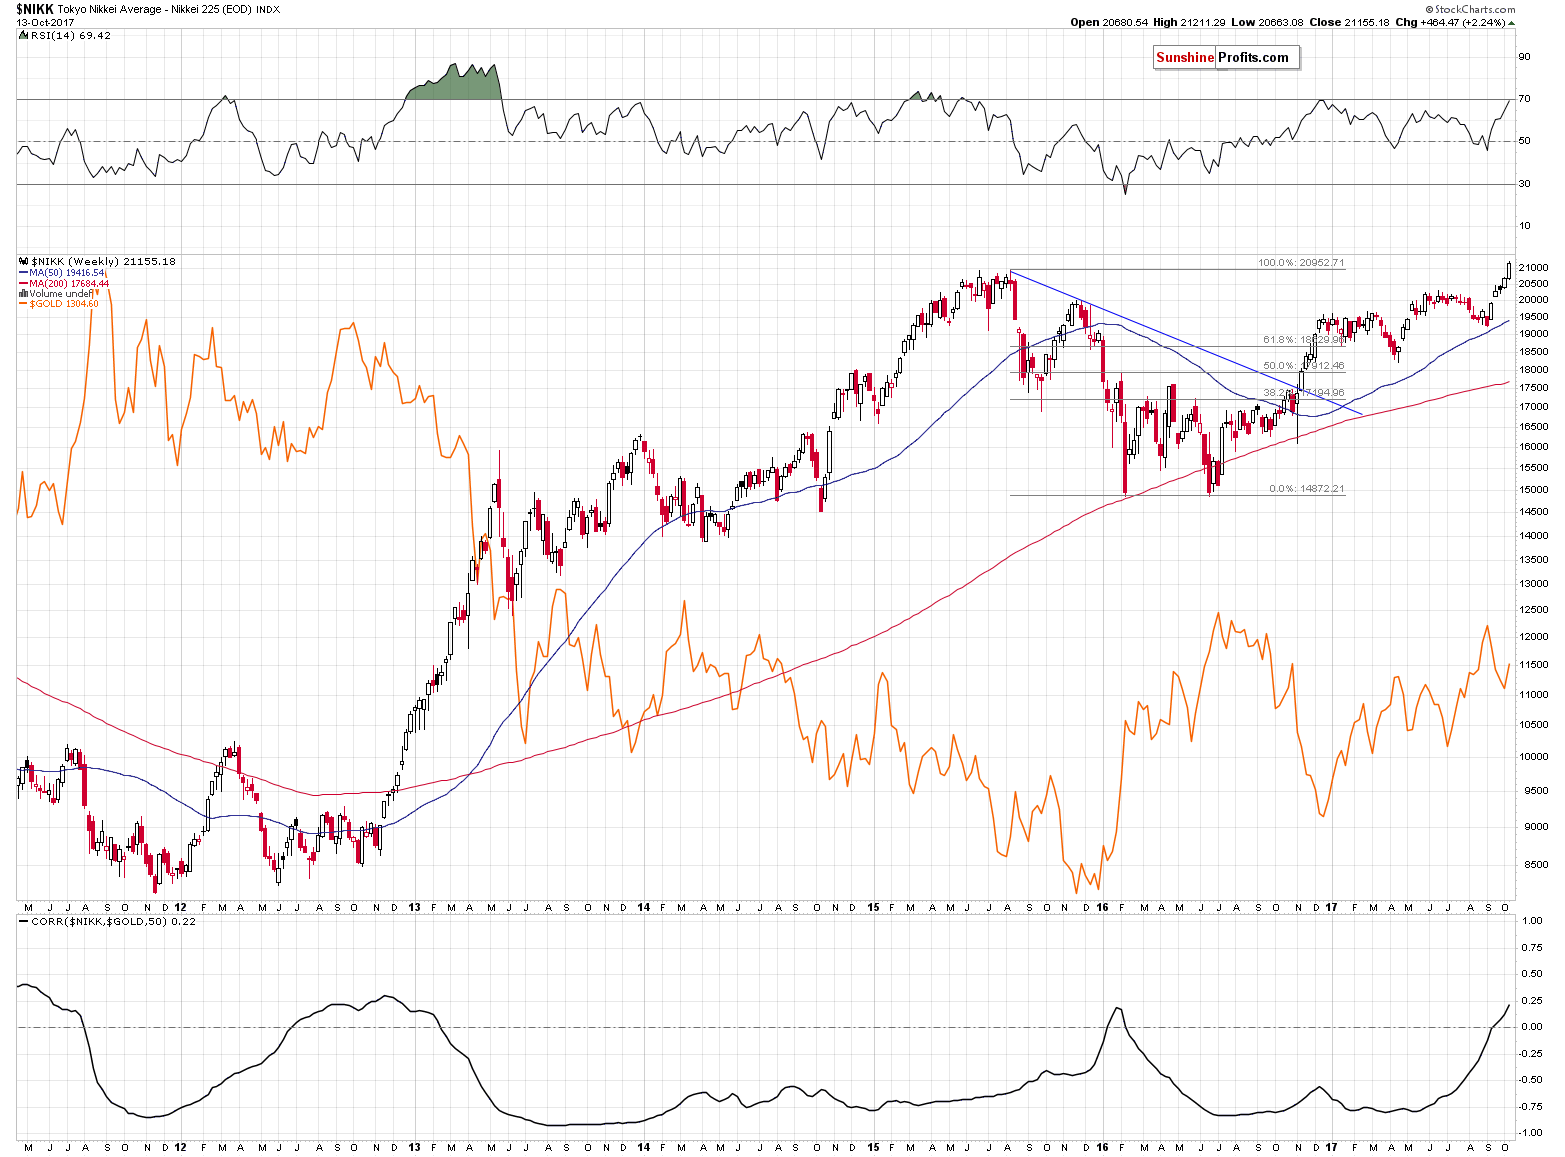
The correlation between Nikkei 225 and gold moved above 0 and the RSI just moved to the 30 level. There was only one similar situation in the recent past and that is when Nikkei was breaking above its previous weekly high. Well, since the Nikkei just broke above its 2015 high in weekly terms, the situations are now very similar.
Back in 2015 it meant that a big rally was about to unfold and the same appears to be likely also this time. Why should we – gold and silver investors – bother with the above analysis? Because Japanese stocks tend to move in the opposite direction to the price of gold in the medium term (in the short-term their moves are not necessarily aligned).
In particular, we should care about the above because the only similar (in fact, very similar) situation in Nikkei was when gold was after the late-2012 top and was during a breather before the huge decline that took place in the following months. This is the same similarity that other long-term factors indicated previously, which means that this scenario is now even more likely to take place in the following weeks and months.
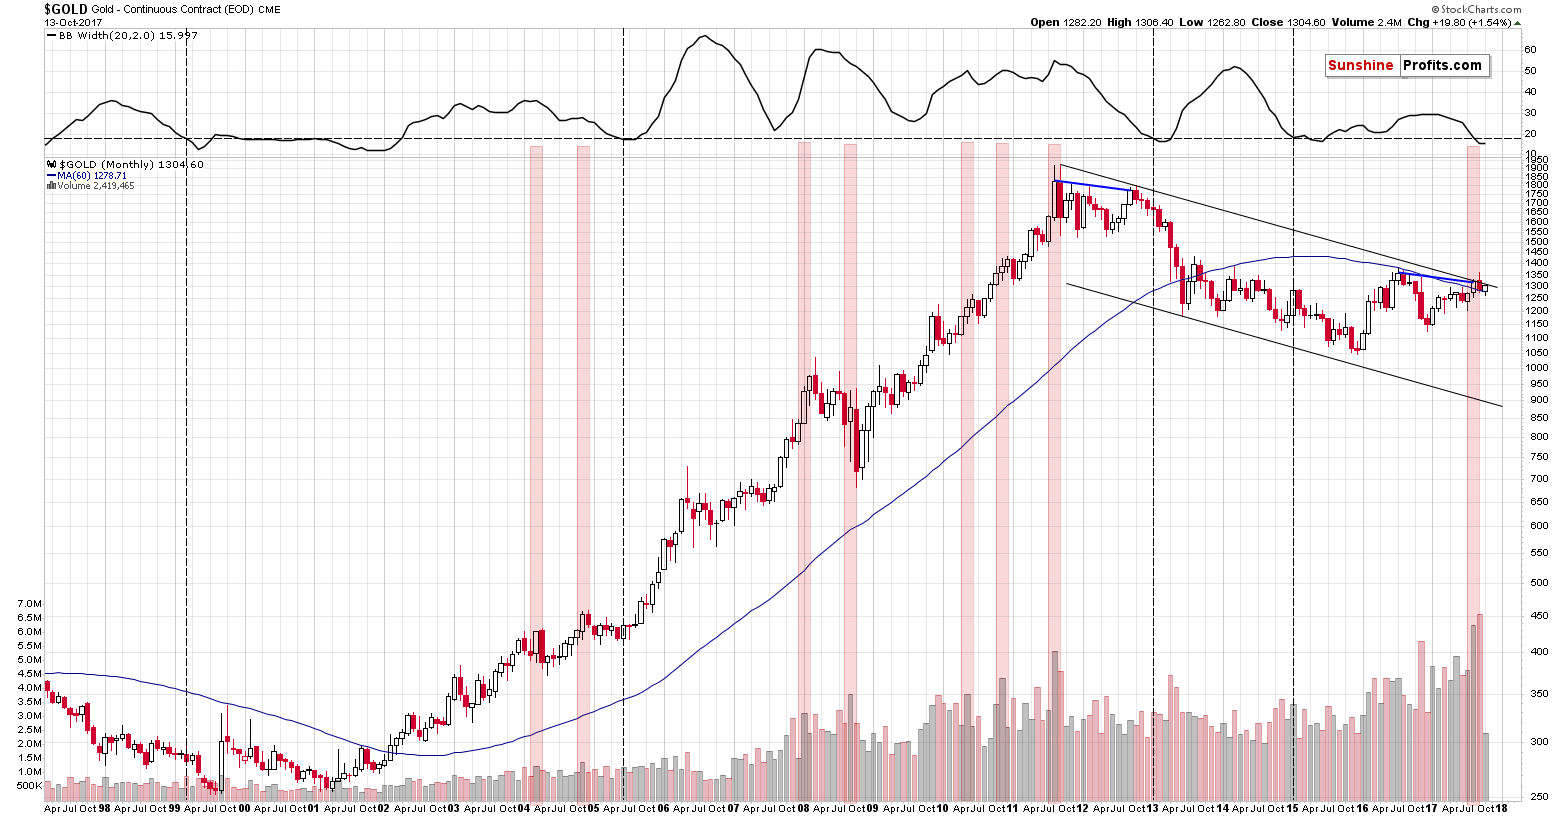
From the long-term chart it seems that the rally is over or extremely close to being over. Last Monday, we wrote the following:
As we discussed previously, the high volume and the analogy to the 2011-2012 trading makes the recent months particularly similar to two cases: the months right after the 2011 top and the months right after the 2012 top. Which of them is more similar is not relevant for today’s discussion as they both point to the possibility of the same outcome in the short term.
Back in 2011, the month right after the top erased the previous month’s gains and the action that followed was a corrective upswing that almost (!) took gold back to the previous high in terms of the monthly closing prices.
Back in 2012, the month right after the top erased almost the entire previous month’s gains and the action that followed was a corrective upswing that almost (!) took gold back to the previous high in terms of the monthly closing prices – temporarily, but still.
So, if the similarity is to continue, gold could (! – doesn’t have to) rally almost to the August 31st closing price, which approximately corresponds to the declining, long-term resistance line and the psychologically important $1,300 level. Consequently, the $1,300 level and its surrounding appears to be the maximum target for the upswing that might have just started. A move to this level would not only not invalidate the bearish long-term analogy – it would be in tune with it.
Gold’s price has increased almost to the August closing price. Consequently, as we explained a week ago, this week’s upswing does not invalidate these analogies – it remains in tune with them.
On a side note, we saw that some analysts featured the chart similar to the above one with the declining long-term resistance line drawn differently. Please be careful when taking this line into account – the above chart shows this line drawn very precisely and the chart below confirms it.
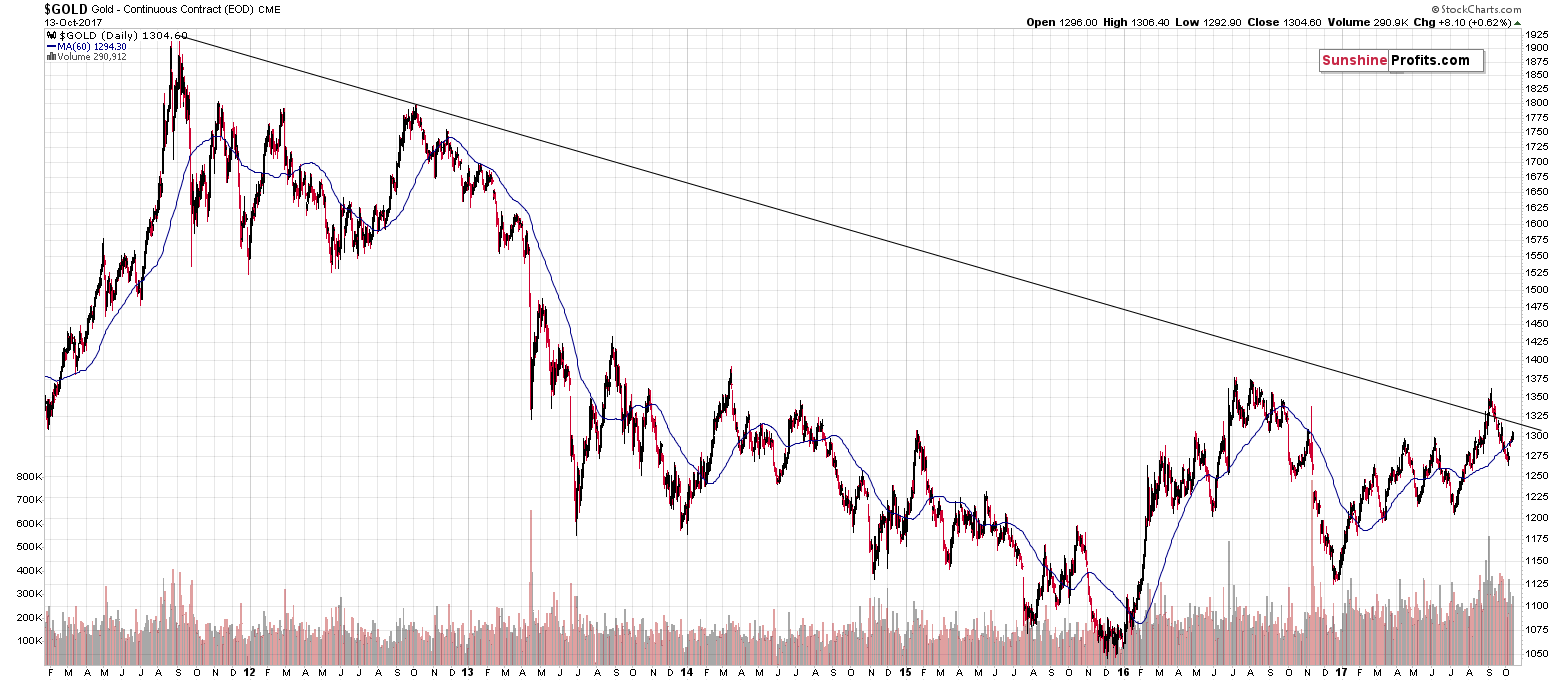
If drew the line above the actual 2011 top and used a thicker line, it could appear that gold broke above this line and verified the breakout during the recent decline (and it would appear that the price of gold is currently above the line). Even though it would appear to be the case – it is not. Gold has clearly invalidated the previous breakout above this line and it remains below it. The implications of these price moves are bearish, not bullish.
What about gold and silver’s breakouts?
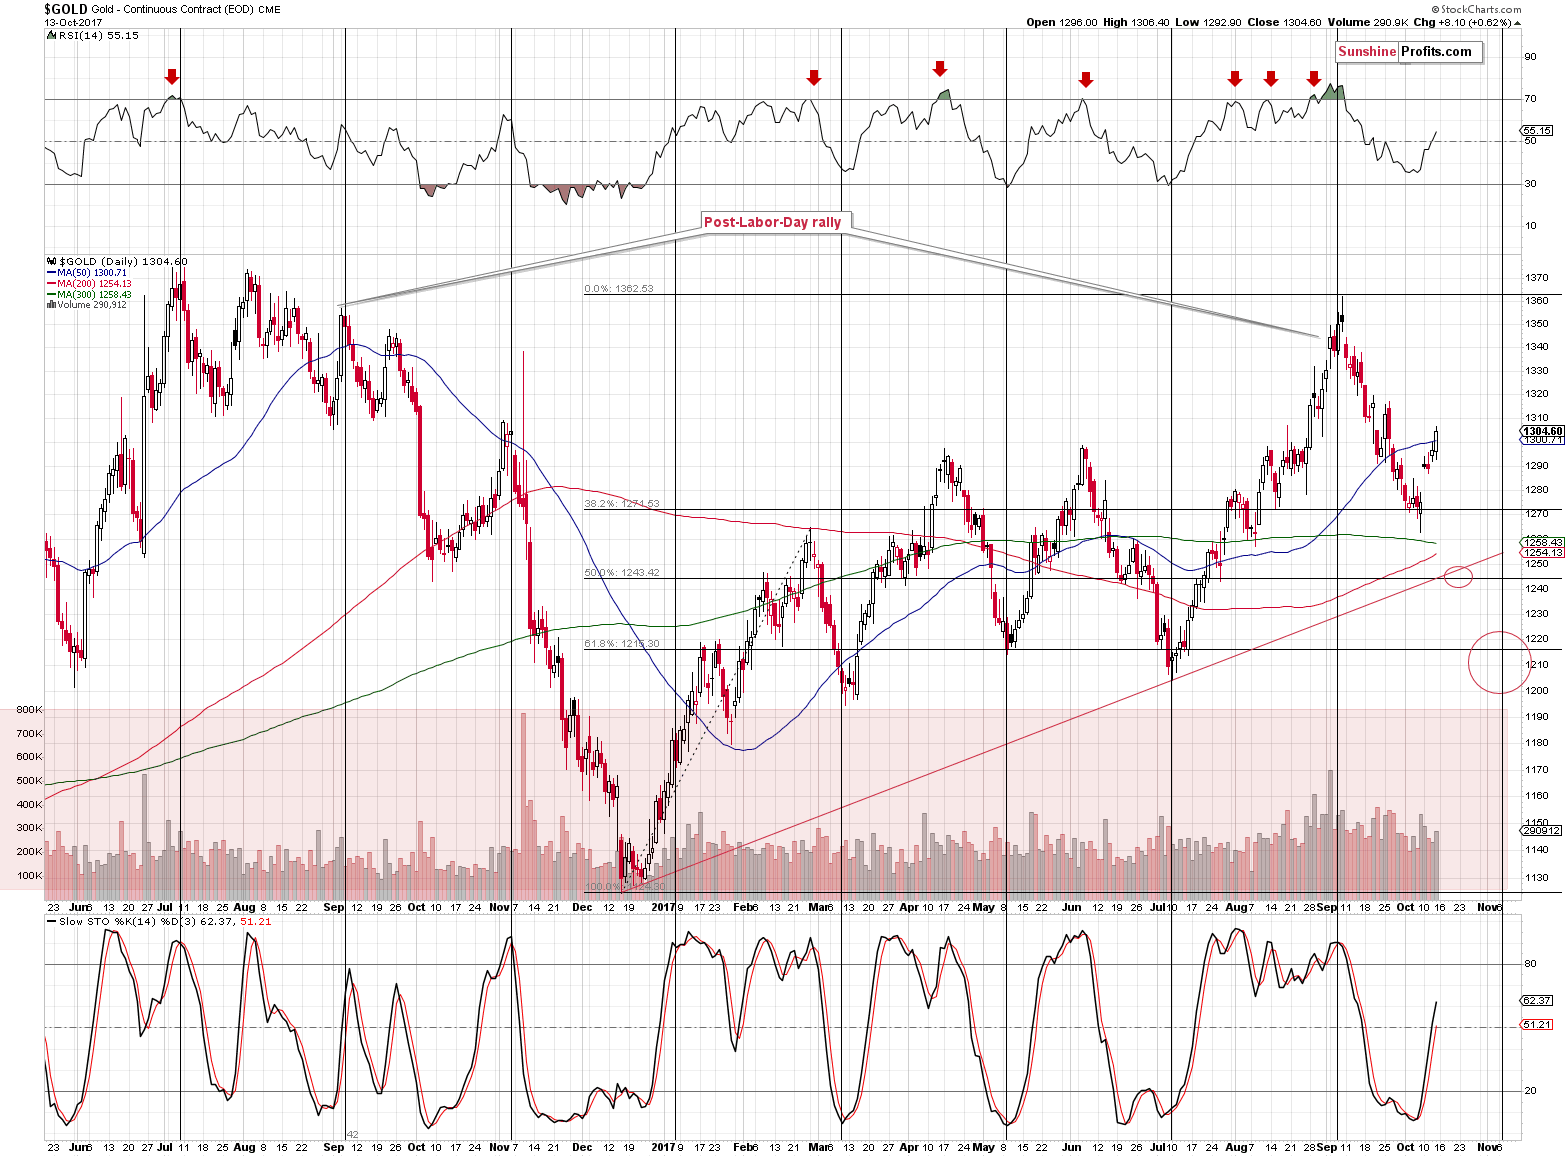
The breakouts in gold: above $1,300 and above the 50-day moving average are relatively small and the volume on which gold moved above these levels was not big, so this move is not confirmed. The implications are therefore not strongly bullish for the short term.
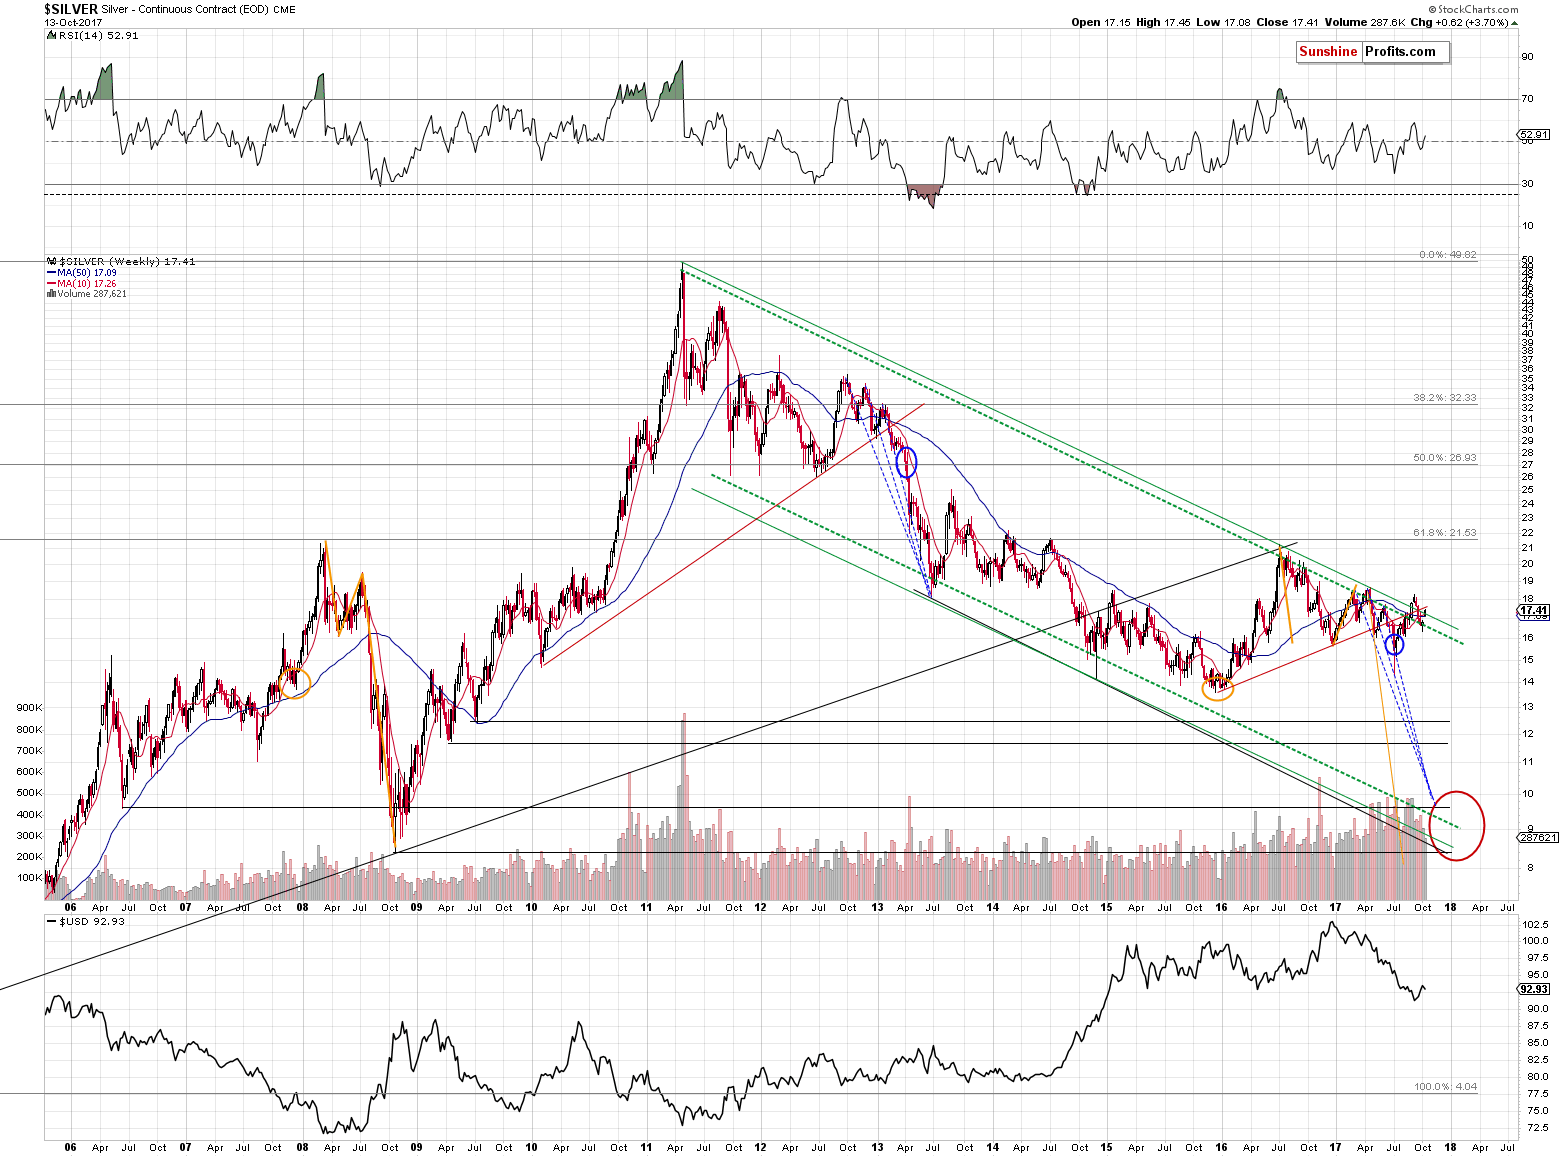
Silver also broke above the declining resistance lines once again (not above the rising red line, though) and it moved a bit above our target. This weekly move took place on relatively low volume and since silver is known (at least among those who have been following the precious metals market and our analyses for some time) for its fake moves, we don’t put much weight to it, unless we see a reliable confirmation.
Instead of seeing the above, we are seeing relatively low volume action in gold that is in tune with the previous pre-plunge behavior and weakness in mining stocks.
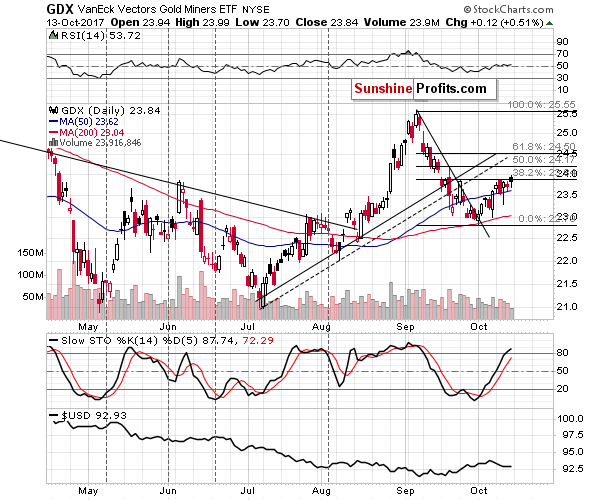
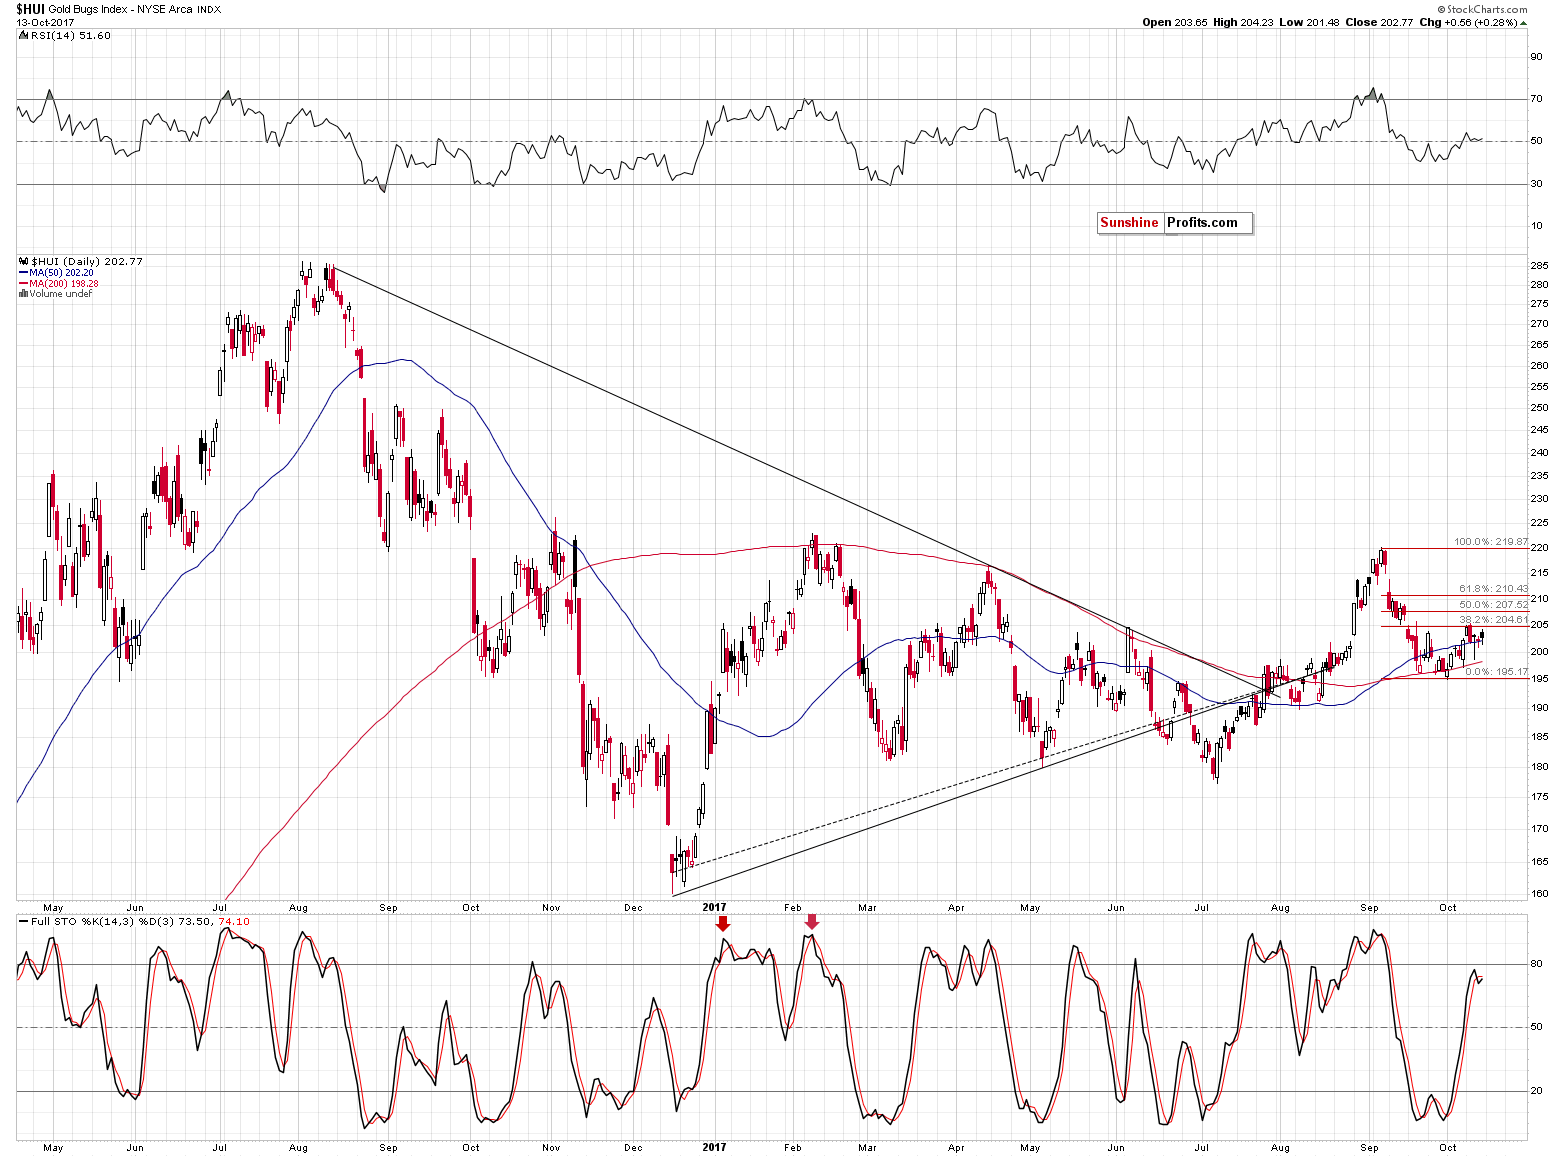
Mining stocks moved higher on Friday on very small volume and they didn’t move to new highs – the 38.2% Fibonacci retracement level remains unbroken. Even the sell signal from the daily Stochastic in the HUI Index was not invalidated. Consequently, the short-term and medium-term outlook for the mining stocks remains bearish.
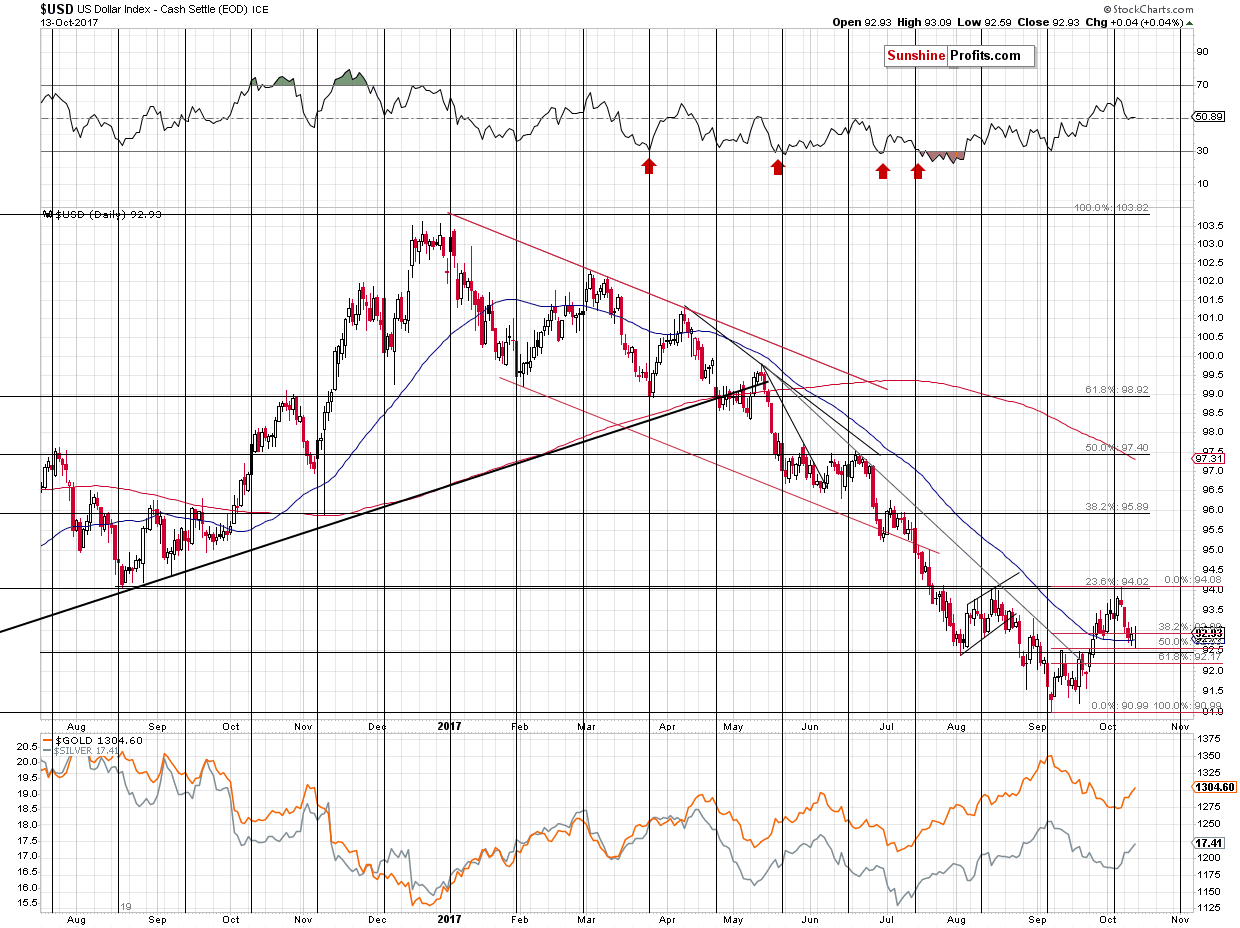
The USD Index moved to 92.59, which could mean that the bottom is already in. At the moment of writing these words, the USDX is back at 93.19, which could confirm the above, but we still can’t rule out another move toward 92.5 before the rally really starts. Either way, it seems that we are one step closer to seeing a bigger rally in the USD and another wave down in gold and the rest of the precious metals sector.
Summing up, gold, silver and mining stocks all moved extremely close to their upside targets for this short-term corrective upswing. On Friday, silver once again outperformed while miners disappointed, which is another classic bearish confirmation. Consequently, it seems that the rally will be over very soon. Those who engaged in day-trading and aimed to profit on the short-term upswing in the precious metals sector may want to close their long positions at this time or prepare to do so shortly and switch to short ones.
The outlook for the precious metals sector for the following months remains bearish. The analogy between the two most recent series of interest rate hikes confirms it, and the same goes for the analysis of the breakouts in the case of Japanese stocks.
As always, we will keep you – our subscribers – informed.
To summarize:
Trading capital (supplementary part of the portfolio; our opinion): Short positions (150% of the full position) in gold, silver and mining stocks are justified from the risk/reward perspective with the following stop-loss orders and initial target price levels / profit-take orders:
- Gold: initial target price level: $1,063; stop-loss: $1,366; initial target price for the DGLD ETN: $81.88; stop-loss for the DGLD ETN $38.74
- Silver: initial target price: $13.12; stop-loss: $19.22; initial target price for the DSLV ETN: $46.18; stop-loss for the DSLV ETN $17.93
- Mining stocks (price levels for the GDX ETF): initial target price: $9.34; stop-loss: $26.34; initial target price for the DUST ETF: $143.56; stop-loss for the DUST ETF $21.37
In case one wants to bet on junior mining stocks' prices (we do not suggest doing so – we think senior mining stocks are more predictable in the case of short-term trades – if one wants to do it anyway, we provide the details), here are the stop-loss details and initial target prices:
- GDXJ ETF: initial target price: $14.13; stop-loss: $45.31
- JDST ETF: initial target price: $417.04; stop-loss: $43.12
Long-term capital (core part of the portfolio; our opinion): No positions (in other words: cash)
Insurance capital (core part of the portfolio; our opinion): Full position
Important Details for New Subscribers
Whether you already subscribed or not, we encourage you to find out how to make the most of our alerts and read our replies to the most common alert-and-gold-trading-related-questions.
Please note that the in the trading section we describe the situation for the day that the alert is posted. In other words, it we are writing about a speculative position, it means that it is up-to-date on the day it was posted. We are also featuring the initial target prices, so that you can decide whether keeping a position on a given day is something that is in tune with your approach (some moves are too small for medium-term traders and some might appear too big for day-traders).
Plus, you might want to read why our stop-loss orders are usually relatively far from the current price.
Please note that a full position doesn’t mean using all of the capital for a given trade. You will find details on our thoughts on gold portfolio structuring in the Key Insights section on our website.
As a reminder – “initial target price” means exactly that – an “initial” one, it’s not a price level at which we suggest closing positions. If this becomes the case (like it did in the previous trade) we will refer to these levels as levels of exit orders (exactly as we’ve done previously). Stop-loss levels, however, are naturally not “initial”, but something that, in our opinion, might be entered as an order.
Since it is impossible to synchronize target prices and stop-loss levels for all the ETFs and ETNs with the main markets that we provide these levels for (gold, silver and mining stocks – the GDX ETF), the stop-loss levels and target prices for other ETNs and ETF (among other: UGLD, DGLD, USLV, DSLV, NUGT, DUST, JNUG, JDST) are provided as supplementary, and not as “final”. This means that if a stop-loss or a target level is reached for any of the “additional instruments” (DGLD for instance), but not for the “main instrument” (gold in this case), we will view positions in both gold and DGLD as still open and the stop-loss for DGLD would have to be moved lower. On the other hand, if gold moves to a stop-loss level but DGLD doesn’t, then we will view both positions (in gold and DGLD) as closed. In other words, since it’s not possible to be 100% certain that each related instrument moves to a given level when the underlying instrument does, we can’t provide levels that would be binding. The levels that we do provide are our best estimate of the levels that will correspond to the levels in the underlying assets, but it will be the underlying assets that one will need to focus on regarding the signs pointing to closing a given position or keeping it open. We might adjust the levels in the “additional instruments” without adjusting the levels in the “main instruments”, which will simply mean that we have improved our estimation of these levels, not that we changed our outlook on the markets. We are already working on a tool that would update these levels on a daily basis for the most popular ETFs, ETNs and individual mining stocks.
Our preferred ways to invest in and to trade gold along with the reasoning can be found in the how to buy gold section. Additionally, our preferred ETFs and ETNs can be found in our Gold & Silver ETF Ranking.
As a reminder, Gold & Silver Trading Alerts are posted before or on each trading day (we usually post them before the opening bell, but we don't promise doing that each day). If there's anything urgent, we will send you an additional small alert before posting the main one.
=====
Latest Free Trading Alerts:
On Friday, the reports on U.S. consumer inflation and retail sales were released. What do they imply for the gold market?
CPI and Retail Sales in September 2017 and Gold
S&P 500 index gained 0.1% on Friday, after reaching new record high. Will uptrend continue? Or is this some topping pattern ahead of downward correction?
Stocks Slightly Higher, As They Set New Record Highs
=====
Hand-picked precious-metals-related links:
PRECIOUS-Gold hovers above $1,300, supported by geopolitics
Gold prices seen to remain bearish for rest of 2017
Gold During Periods of Conflict
Gold Speculators Cut Back On Their Net Positions For 4th Week
Palladium Tops $1,000 for First Time Since 2001
=====
In other news:
Yellen Calls Inflation the 'Biggest Surprise' in the Economy
China data boosts world stocks and commodities, oil jumps
Madrid moves towards direct rule over Catalonia as deadline passes
Some ECB Members Identify 2.5 Trillion-Euro QE Limit
What Global Finance Chiefs Are Saying About the Economy
The Kobe Steel scandal: What we know so far
Barron's Looks Back At The Market Crash Of 1987
This Is What The Nobel Prize-Winning Economic Theory Means For Traders
=====
Thank you.
Sincerely,
Przemyslaw Radomski, CFA
Founder, Editor-in-chief, Gold & Silver Fund Manager
Gold & Silver Trading Alerts
Forex Trading Alerts
Oil Investment Updates
Oil Trading Alerts

