

Briefly: in our opinion, full (300% of the regular position size) speculative short positions in junior mining stocks are justified from the risk/reward point of view at the moment of publishing this Alert.
Today’s technical analysis will be very similar to what I provided to you yesterday because the markets pretty much moved exactly as I had expected. As you may recall, I wrote about the analogy between now and early August in the following way (I’m putting the key part in bold):
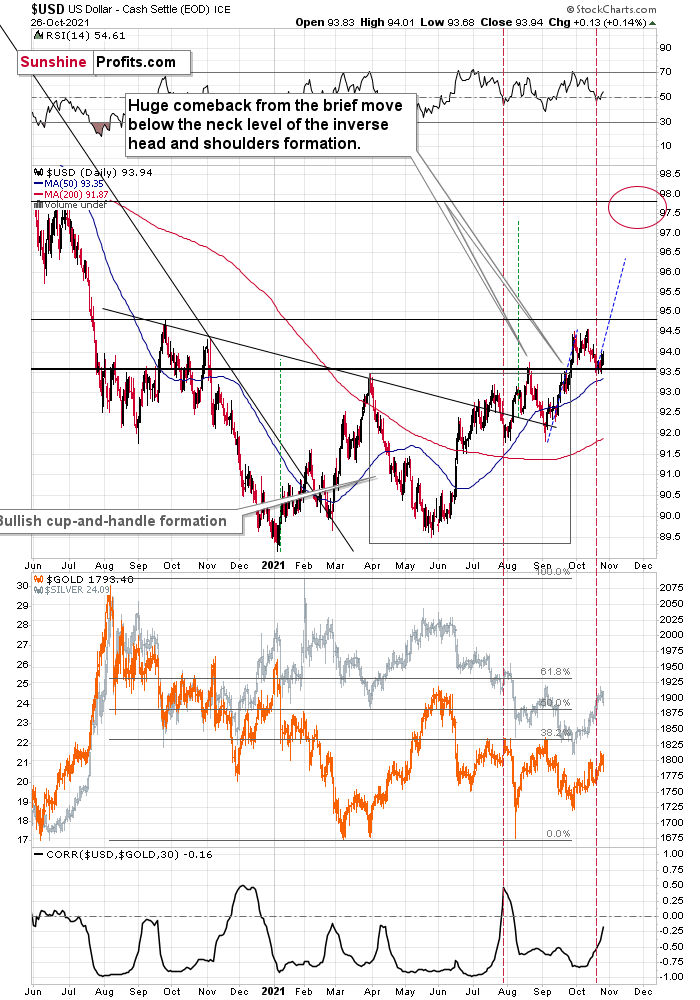
The situation now appears to be the same as it was at the beginning of August, where the bottom also took several days to form, but when the USD Index finally moved higher once again, gold plunged. To be precise, back then, the bottom formed over 5 trading days, and yesterday was the fifth trading day of the current bottom. On the sixth day – back then – the USDX did very little and gold declined modestly, and it was the seventh day when the action really started. And… the short-term decline was over on the very next day. It was not easy to catch this decline if one wanted to wait for a big confirmation that it was indeed taking place. It seems that the same – patient – approach is justified in the current situation.
The RSI indicator (upper part of the chart) continues to confirm this similarity.
Yesterday, the USD Index ended the session 0.13 higher, so – just as in early August – it moved very little. Gold declined modestly back then, and, well, it moved lower by $13.40 yesterday, so it seems that it fits well. Gold is down by $6 in today’s pre-market trading (at the moment of writing these words), so it seems that history might repeat itself to a very big degree.
If it repeated itself to the letter, we would have a $100+ decline in gold this week. But since history rhymes more than it repeats, I think it’s more realistic to simply expect gold to fall substantially soon, without giving the decline just 2 days to materialize.
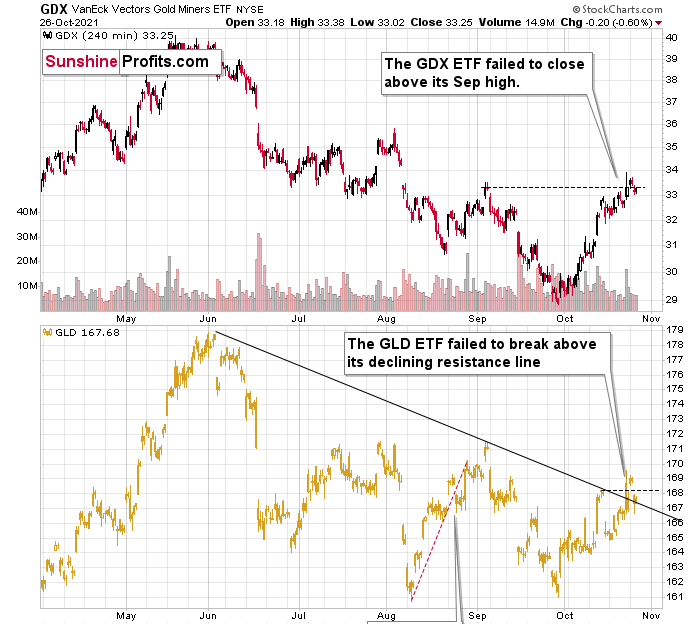
Yesterday, I described the above chart as “another attempt”. Mining stocks (GDX ETF) once again failed to hold the move above their September highs, which is – of course – bearish. GLD failed to hold above its previous October highs as well. It did manage to close above the declining resistance line based on the previous highs, but given today’s pre-market rally, it’s doubtful if GLD will be able to hold this level for long.
There are different rules for confirming a breakout or breakdown, but in the precious metals sector, based on almost two decades of experience in it, I prefer to see three closes above or below a certain level to view the breakout or breakdown as confirmed. Gold / GLD hasn’t confirmed its breakout just yet, and it seems to me that it won’t confirm it soon. Instead, another – big – downswing seems to be just around the corner.
Also, let’s keep in mind how mining stocks (seniors and juniors) reacted to the previous tapering announcement. They moved higher only very initially, but then fell substantially.
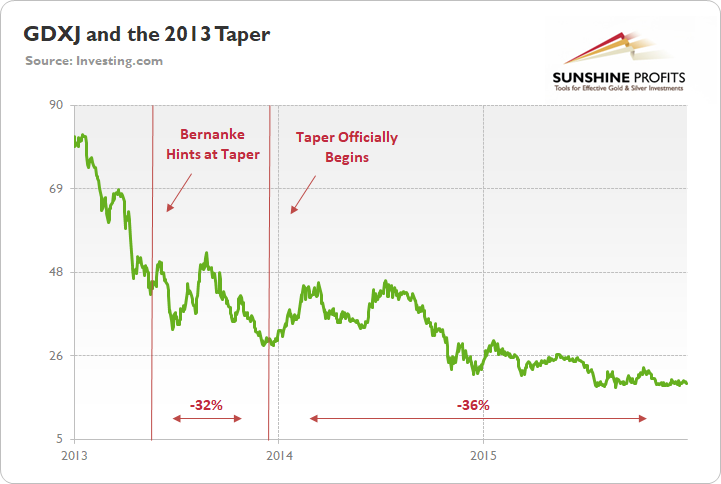
To explain, the green line above tracks the GDXJ ETF from the beginning of 2013 to the end of 2015. If you analyze the left side of the chart, you can see that when Fed Chairman Ben Bernanke hinted at tapering on May 22, 2013, the GDXJ ETF declined by 32% from May 22 until the taper began on Dec. 18.
Moreover, the onslaught didn’t end there. Once the taper officially began, the GDXJ ETF enjoyed a relief rally (similar to what we’re witnessing now) as long-term interest rates declined, and the PMs assumed that the worst was in the rearview.
All in all, the technical picture for the precious metals sector looks bearish, even though the recent short-term corrective upswing might make one think otherwise.
Having said that, let’s take a look at the markets from a more fundamental point of view.
Central Banks on Deck
With the Bank of Canada (BoC) and the European Central Bank (ECB) announcing their monetary policy decisions on Oct. 27 and Oct. 28 respectively, the USD Index could benefit from the ‘sell the news’ events.
For example, both the CAD (9.1% of the USD Index’s movement) and the EUR (57.6% of the USD Index’s movement) have benefited from a hawkish re-pricing of potential interest rate hikes. And with the former one of the best-performing developed market currencies versus the U.S. dollar YTD, a reversion to the mean could materialize sooner rather than later.
To explain, BoC Governor Tiff Macklem (Canada’s Jerome Powell) reiterated on Oct. 7 that he views inflation as “temporary” and that “part of that is base year effects. Prices were very low a year ago. They've normalized. Part of that is related to these very unique circumstances of the pandemic.”
However, with the futures market pricing in four rate hikes by the BoC in 2022, investors’ expectations are well ahead of the BoC’s own forward guidance. As a result, Scotiabank expects dovish pushback on Oct. 27 and for the USD/CAD to rally to 1.25/1.26.
The bank told its clients on Oct. 26:
“The CAD is one currency that we fully expect to hold its own – and even improve somewhat – against a more robust USD going forward, given our forecast for a relatively rapid tightening in the BoC policy rate once that tightening cycle gets started (we assume H2 next year).”
However:
“Policy makers might try to dampen rate expectations somewhat in order to avoid disappointing market participants and creating more volatility down the road.”
As a result:
“We look for narrow range trading for the CAD ahead of tomorrow’s policy decision and feel the risk of soft-pedaling nearer-term rate expectations might nudge the CAD somewhat lower in the short-run. USD gains to the 1.25/1.26 will very likely be met with renewed USD supply, however.”
Also expecting dovish pushback, Josh Nye, Senior Economist at the Royal Bank of Canada, told Bloomberg on Oct. 26 that “we don’t see the [BoC] validating the recent move higher in interest rate expectations; instead, maintaining its guidance that it will keep the overnight rate steady until economic slack is absorbed in the second half of 2022.”
On the other side of the coin, the ECB is much more important than the BoC. With the EUR/USD accounting for nearly 58% of the movement of the USD Index, the currency pair is the head of the snake. Moreover, with the EUR/USD dipping below 1.1600 on Oct. 26, the ECB may disappoint euro bulls once again.
For one, the futures market expects a rate hike in 2022. However, ECB Chief Economist Philip Lane said on Oct. 19 that investors’ forecast of ECB policy contrasts the central bank’s actual forward guidance:
“Markets may not have fully absorbed the ECB’s forward guidance,” said Lane. “When you look at market prices of the forward interest rate curve, I think it’s challenging to reconcile some of the market views with our pretty clear, straightforward forward guidance.”
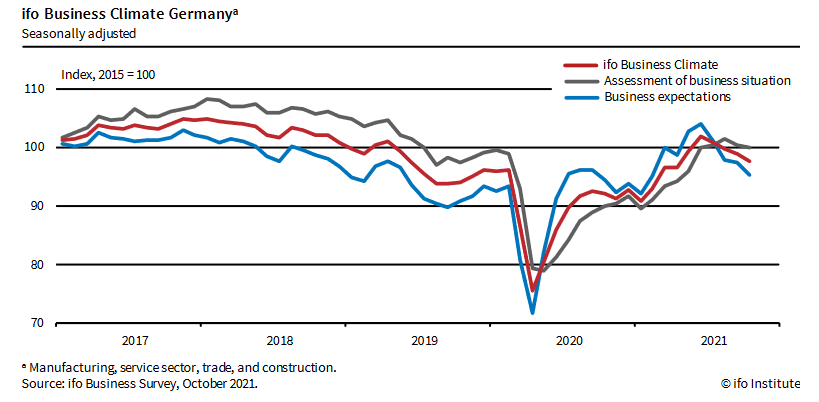
Second, the ifo Institute released its Business Climate Index on Oct. 25. For context, the monthly metric is a leading indicator of economic activity in Germany (Europe’s largest economy). The report revealed:
“Sentiment in the German economy has clouded over. The ifo Business Climate Index fell from 98.9 points in September to 97.7 points in October. Skepticism is increasingly evident in expectations. Companies’ assessments of their current situation are also less positive. Supply problems are giving businesses headaches. Capacity utilization in manufacturing is falling. Sand in the wheels of the German economy is hampering recovery.”
Please see below:
Third, IHS Markit released its Eurozone Composite PMI on Oct. 22. And after “Eurozone business activity growth slowed sharply… [and] for a third successive month in October” the headline index declined from 56.2 in September to 54.3 in October.
Chris Williamson, Chief Business Economist at IHS Markit, said:
“A sharp slowdown in October means the Eurozone starts the fourth quarter with the weakest growth momentum since April. A manufacturing sector beset with supply chain delays saw production growth falter to the lowest since the first lockdowns of last year. The services sector has meanwhile seen some of the summer rebound fade just as resurgent virus case numbers bring renewed concerns, notably in Germany.”
Please see below:
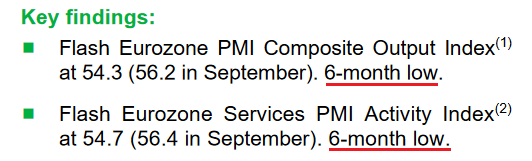 Source: IHS Markit
In stark contrast, IHS Markit’s U.S. Composite PMI (also released on Oct. 22) increased from 55.0 in September to 57.3 in October.
Williamson said:
“October saw resurgent service sector activity as COVID-19 case numbers continued to fall, marking a encouragingly strong start to the fourth quarter for the [U.S.] economy. Hiring has likewise picked up as firms have been encouraged to expand capacity to meet rising demand.”
Please see below:
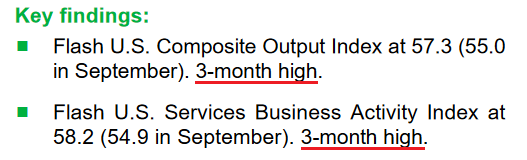 Source: IHS Markit
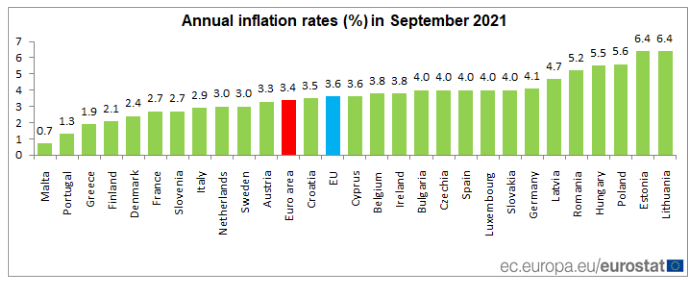
Fourth, while the U.S. Consumer Price Index (CPI) increased by 5.4% year-over-year (YoY) on Oct. 13, inflation in the Eurozone (released on Oct. 18) only increased by 3.4% YoY (the red bar below). As a result, the ECB has more wiggle room to preach the “transitory” narrative than the Fed.
Thus, while the Fed has all but guaranteed a taper announcement at its Nov. 2/3 policy meeting, the ECB should maintain its dovish stance for the foreseeable future. And expecting just that, Scotiabank told its clients on Oct. 26:
“Even a moderately less dovish statement [by the ECB] will stand starkly in contrast to next week’s Fed decision, so room for EUR gains is limited and selling the currency on a post-ECB gain is the most sensible strategy.”
Likewise, MUFG Research told its clients on Oct. 26:
“We believe that there is a good chance that the ECB will push back against current market pricing for ECB rate hikes. The European rate market has got carried away alongside the hawkish re-pricing of rates globally, and has moved to price in an ECB rate hike in the next two years.
“The current pricing appears inconsistent with the new forward guidance adopted by the ECB in July which lifted the bar for delivering rate hikes. Above target inflation will need to be well advanced on a sustainable basis within the forecast horizon before a rate hike is justified.”
The bottom line? While the BoC is more of a wild card and the CAD has rising oil prices underwriting its fundamental strength (Canada is the fourth-largest oil-producing country in the world), Macklem has preached inflationary patience, and he should attempt to temper investors’ rate hike expectations.
More concrete, though, with U.S. economic growth and realized inflation running ahead of the Eurozone, the Fed remains in pole position. And with slumping Eurozone business sentiment adding to the ECB’s ills, the central bank is unlikely to turn hawkish when growth is sputtering and annualized inflation is still within a respectable range. As a result, the EUR/USD remains materially overvalued and lower lows should materialize over the medium term.
In conclusion, the PMs declined on Oct. 26, as the EUR/USD faltered and the USD Index resumed its uptrend. Moreover, with the Fed’s liquidity drain now a done deal and the ECB likely to extend its PEPP program or increase its APP program in 2022, the USD Index should remain well-supported over the next several months. As a result, with the PMs unlikely to celebrate a buoyant U.S. dollar, their returns should head in the opposite direction over the medium term.
Overview of the Upcoming Part of the Decline
- It seems to me that the current corrective upswing in gold is over, and the next short-term move lower is about to begin. Since it seems to be another short-term move more than it seems to be a continuation of the bigger decline, I think that junior miners would be likely to (at least initially) decline more than silver.
- It seems that the first stop for gold will be close to its previous 2021 lows, slightly below $1,700. Then it will likely correct a bit, but it’s unclear if I want to exit or reverse the current short position based on that – it depends on the number and the nature of the bullish indications that we get at that time. Before the next big slide, I will likely prefer to get back to the short position in the junior mining stocks.
- After the above-mentioned correction, we’re likely to see a powerful slide, perhaps close to the 2020 low ($1,450 - $1,500).
- If we see a situation where miners slide in a meaningful and volatile way while silver doesn’t (it just declines moderately), I plan to – once again – switch from short positions in miners to short positions in silver. At this time, it’s too early to say at what price levels this could take place, and if we get this kind of opportunity at all – perhaps with gold close to $1,600.
- I plan to exit all remaining short positions when gold shows substantial strength relative to the USD Index while the latter is still rallying. This might take place with gold close to $1,350 - $1,400. I expect silver to fall the hardest in the final part of the move. This moment (when gold performs very strongly against the rallying USD and miners are strong relative to gold after its substantial decline) is likely to be the best entry point for long-term investments, in my view. This might also happen with gold close to $1,375, but it’s too early to say with certainty at this time. I expect the final bottom to take place near the end of the year, perhaps in mid-December.
- As a confirmation for the above, I will use the (upcoming or perhaps we have already seen it?) top in the general stock market as the starting point for the three-month countdown. The reason is that after the 1929 top, gold miners declined for about three months after the general stock market started to slide. We also saw some confirmations of this theory based on the analogy to 2008. All in all, the precious metals sector is likely to bottom about three months after the general stock market tops.
- The above is based on the information available today, and it might change in the following days/weeks.
You will find my general overview of the outlook for gold on the chart below:
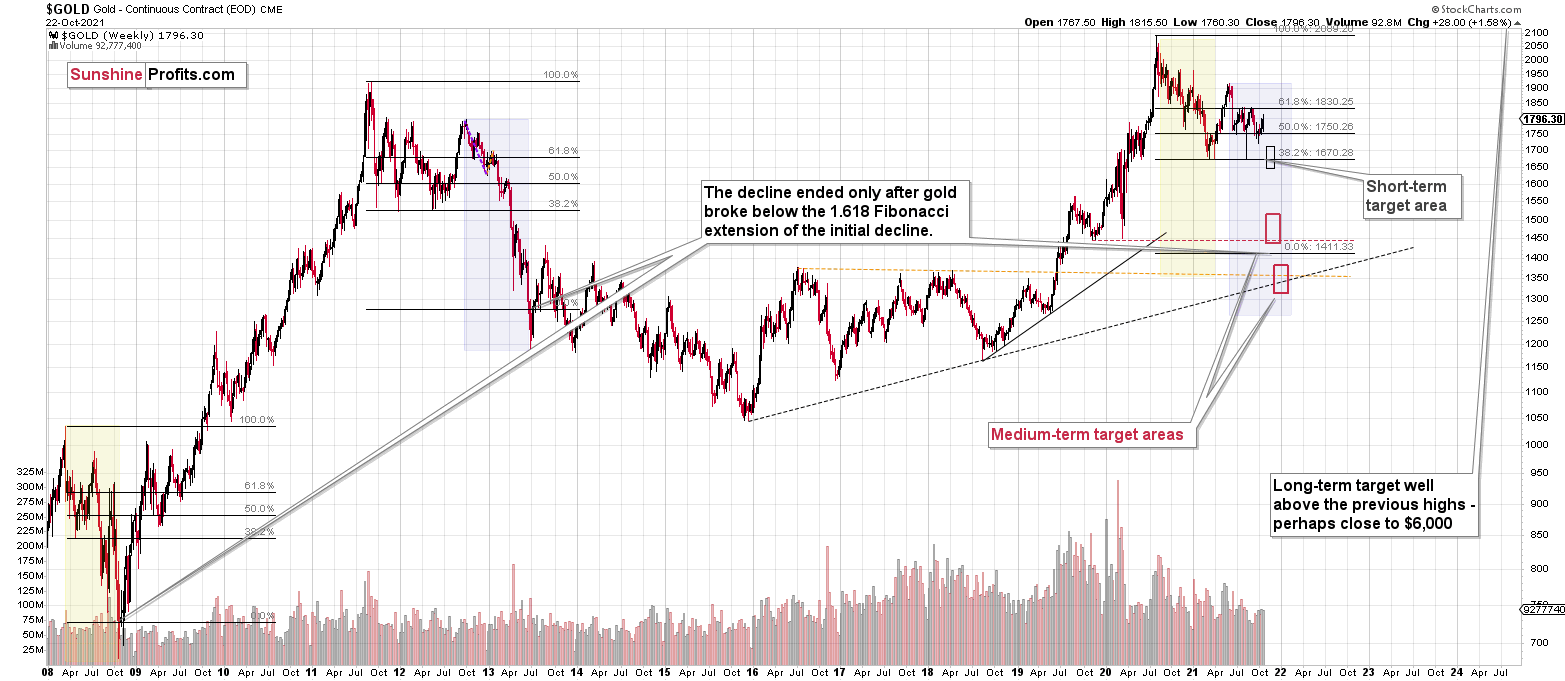
Please note that the above timing details are relatively broad and “for general overview only” – so that you know more or less what I think and how volatile I think the moves are likely to be – on an approximate basis. These time targets are not binding or clear enough for me to think that they should be used for purchasing options, warrants or similar instruments.
Summary
To summarize, the outlook for the precious metals sector remains extremely bearish for the next few months. Since it seems that the PMs are starting another short-term move lower more than it seems that they are continuing their bigger decline, I think that junior miners would be likely to (at least initially) decline more than silver.
From the medium-term point of view, the key two long-term factors remain the analogy to 2013 in gold and the broad head and shoulders pattern in the HUI Index. They both suggest much lower prices ahead.
It seems that our profits from the short positions are going to become truly epic in the following months.
After the sell-off (that takes gold to about $1,350 - $1,500), I expect the precious metals to rally significantly. The final part of the decline might take as little as 1-5 weeks, so it's important to stay alert to any changes.
Most importantly, please stay healthy and safe. We made a lot of money last March and this March, and it seems that we’re about to make much more on the upcoming decline, but you have to be healthy to enjoy the results.
As always, we'll keep you - our subscribers - informed.
By the way, we’re currently providing you with the possibility to extend your subscription by a year, two years, or even three years with a special 20% discount. This discount can be applied right away, without the need to wait for your next renewal – if you choose to secure your premium access and complete the payment upfront. The boring time in the PMs is definitely over, and the time to pay close attention to the market is here. Naturally, it’s your capital, and the choice is up to you, but it seems that it might be a good idea to secure more premium access now while saving 20% at the same time. Our support team will be happy to assist you in the above-described upgrade at preferential terms – if you’d like to proceed, please contact us.
To summarize:
Trading capital (supplementary part of the portfolio; our opinion): Full speculative short positions (300% of the full position) in junior mining stocks are justified from the risk to reward point of view with the following binding exit profit-take price levels:
Mining stocks (price levels for the GDXJ ETF): binding profit-take exit price: $35.73; stop-loss: none (the volatility is too big to justify a stop-loss order in case of this particular trade)
Alternatively, if one seeks leverage, we’re providing the binding profit-take levels for the JDST (2x leveraged) and GDXD (3x leveraged – which is not suggested for most traders/investors due to the significant leverage). The binding profit-take level for the JDST: $16.18; stop-loss for the JDST: none (the volatility is too big to justify a SL order in case of this particular trade); binding profit-take level for the GDXD: $32.08; stop-loss for the GDXD: none (the volatility is too big to justify a SL order in case of this particular trade).
For-your-information targets (our opinion; we continue to think that mining stocks are the preferred way of taking advantage of the upcoming price move, but if for whatever reason one wants / has to use silver or gold for this trade, we are providing the details anyway.):
Silver futures downside profit-take exit price: $19.12
SLV profit-take exit price: $17.72
ZSL profit-take exit price: $41.38
Gold futures downside profit-take exit price: $1,683
HGD.TO – alternative (Canadian) inverse 2x leveraged gold stocks ETF – the upside profit-take exit price: $12.48
Long-term capital (core part of the portfolio; our opinion): No positions (in other words: cash
Insurance capital (core part of the portfolio; our opinion): Full position
Whether you already subscribed or not, we encourage you to find out how to make the most of our alerts and read our replies to the most common alert-and-gold-trading-related-questions.
Please note that we describe the situation for the day that the alert is posted in the trading section. In other words, if we are writing about a speculative position, it means that it is up-to-date on the day it was posted. We are also featuring the initial target prices to decide whether keeping a position on a given day is in tune with your approach (some moves are too small for medium-term traders, and some might appear too big for day-traders).
Additionally, you might want to read why our stop-loss orders are usually relatively far from the current price.
Please note that a full position doesn't mean using all of the capital for a given trade. You will find details on our thoughts on gold portfolio structuring in the Key Insights section on our website.
As a reminder - "initial target price" means exactly that - an "initial" one. It's not a price level at which we suggest closing positions. If this becomes the case (like it did in the previous trade), we will refer to these levels as levels of exit orders (exactly as we've done previously). Stop-loss levels, however, are naturally not "initial", but something that, in our opinion, might be entered as an order.
Since it is impossible to synchronize target prices and stop-loss levels for all the ETFs and ETNs with the main markets that we provide these levels for (gold, silver and mining stocks - the GDX ETF), the stop-loss levels and target prices for other ETNs and ETF (among other: UGL, GLL, AGQ, ZSL, NUGT, DUST, JNUG, JDST) are provided as supplementary, and not as "final". This means that if a stop-loss or a target level is reached for any of the "additional instruments" (GLL for instance), but not for the "main instrument" (gold in this case), we will view positions in both gold and GLL as still open and the stop-loss for GLL would have to be moved lower. On the other hand, if gold moves to a stop-loss level but GLL doesn't, then we will view both positions (in gold and GLL) as closed. In other words, since it's not possible to be 100% certain that each related instrument moves to a given level when the underlying instrument does, we can't provide levels that would be binding. The levels that we do provide are our best estimate of the levels that will correspond to the levels in the underlying assets, but it will be the underlying assets that one will need to focus on regarding the signs pointing to closing a given position or keeping it open. We might adjust the levels in the "additional instruments" without adjusting the levels in the "main instruments", which will simply mean that we have improved our estimation of these levels, not that we changed our outlook on the markets. We are already working on a tool that would update these levels daily for the most popular ETFs, ETNs and individual mining stocks.
Our preferred ways to invest in and to trade gold along with the reasoning can be found in the how to buy gold section. Furthermore, our preferred ETFs and ETNs can be found in our Gold & Silver ETF Ranking.
As a reminder, Gold & Silver Trading Alerts are posted before or on each trading day (we usually post them before the opening bell, but we don't promise doing that each day). If there's anything urgent, we will send you an additional small alert before posting the main one.
Thank you.
Przemyslaw Radomski, CFA
Founder, Editor-in-chief

