

Briefly: in our opinion, full (300% of the regular position size) speculative short positions in mining stocks are justified from the risk/reward point of view at the moment of publishing this Alert. We are adjusting the exit levels for the leveraged ETNs, as they are closer to their targets when they were months ago and such better approximation is now possible.
Gold moved higher once again yesterday (Feb. 9), but it reversed and declined before the closing bell. Miners declined as well. Does it mean that the next top is in or about to be in? That’s exactly what it means. Especially considering that gold’s reversal took place almost right at the triangle-vertex-based reversal and during USD’s breakout’s verification.
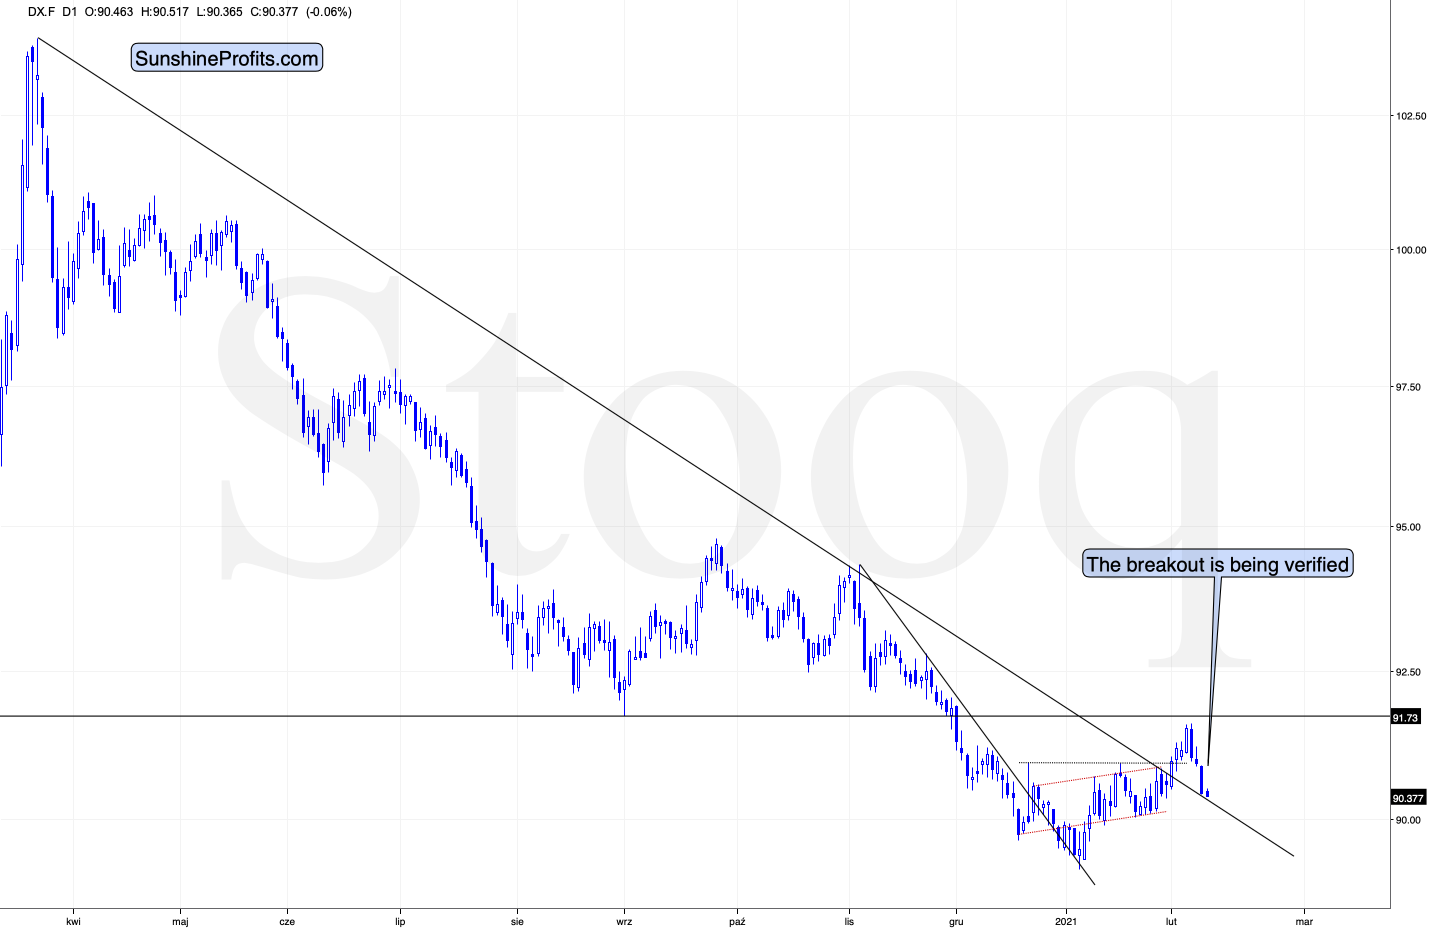
Figure 1 - USD Index
I previously wrote that because assets don’t move in a straight line, it’s plausible that the USD Index retests its declining resistance line, while gold retests its rising support line. If this occurs, the USDX is likely to decline to the 90.6 range, while gold will receive a short-term boost. I emphasized that the outcome does not change their medium-term trends and the above confirmations signal that the USDX is heading north and gold is heading south.
The part that I put in bold is exactly what is being realized right now. The USDX is correcting after the breakout, likely verifying the previous resistance as support.
Unless the USDX breaks back below the declining medium-term support line in a meaningful way, the bullish implications for the following weeks will remain intact. At the moment of writing these words, the USD Index is practically right at the support line, which means that it’s quite likely to reverse shortly.
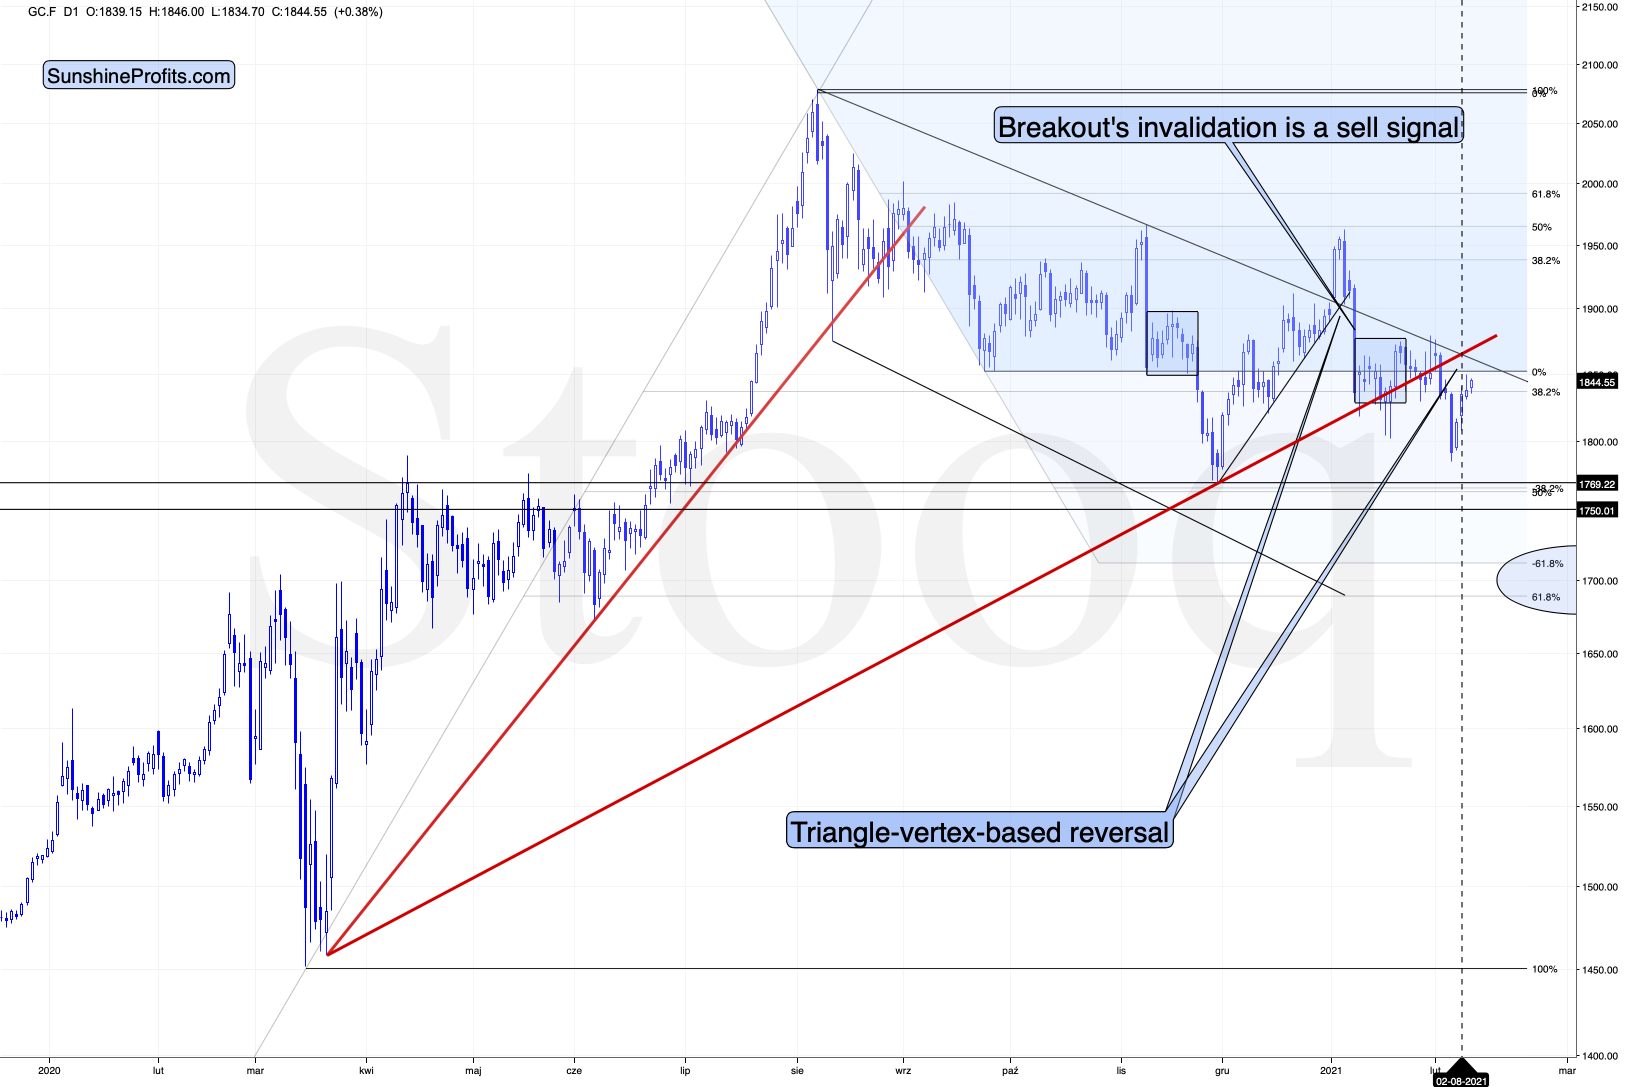
Figure 2 - COMEX Gold Futures
Gold formed a reversal yesterday, but it ended the session slightly higher. The latter might seem bullish, until one compares that to the size of the daily decline in the USD Index. The move lower in the latter was quite visible, so what we saw in gold should be viewed as USDX’s underperformance and thus a bearish sign.
Let’s keep in mind that gold was just at its triangle-vertex-based reversal (based on the declining black resistance line and the rising red support line), which perfectly fits the shape of yesterday’s session – the shooting star reversal candlestick. The implications are bearish.
Today, gold moved slightly higher, but the move was too small to change anything. Gold didn’t move above yesterday’s intraday high, which means that the short-term top might already be in.
What about silver, did the white metal change anything?
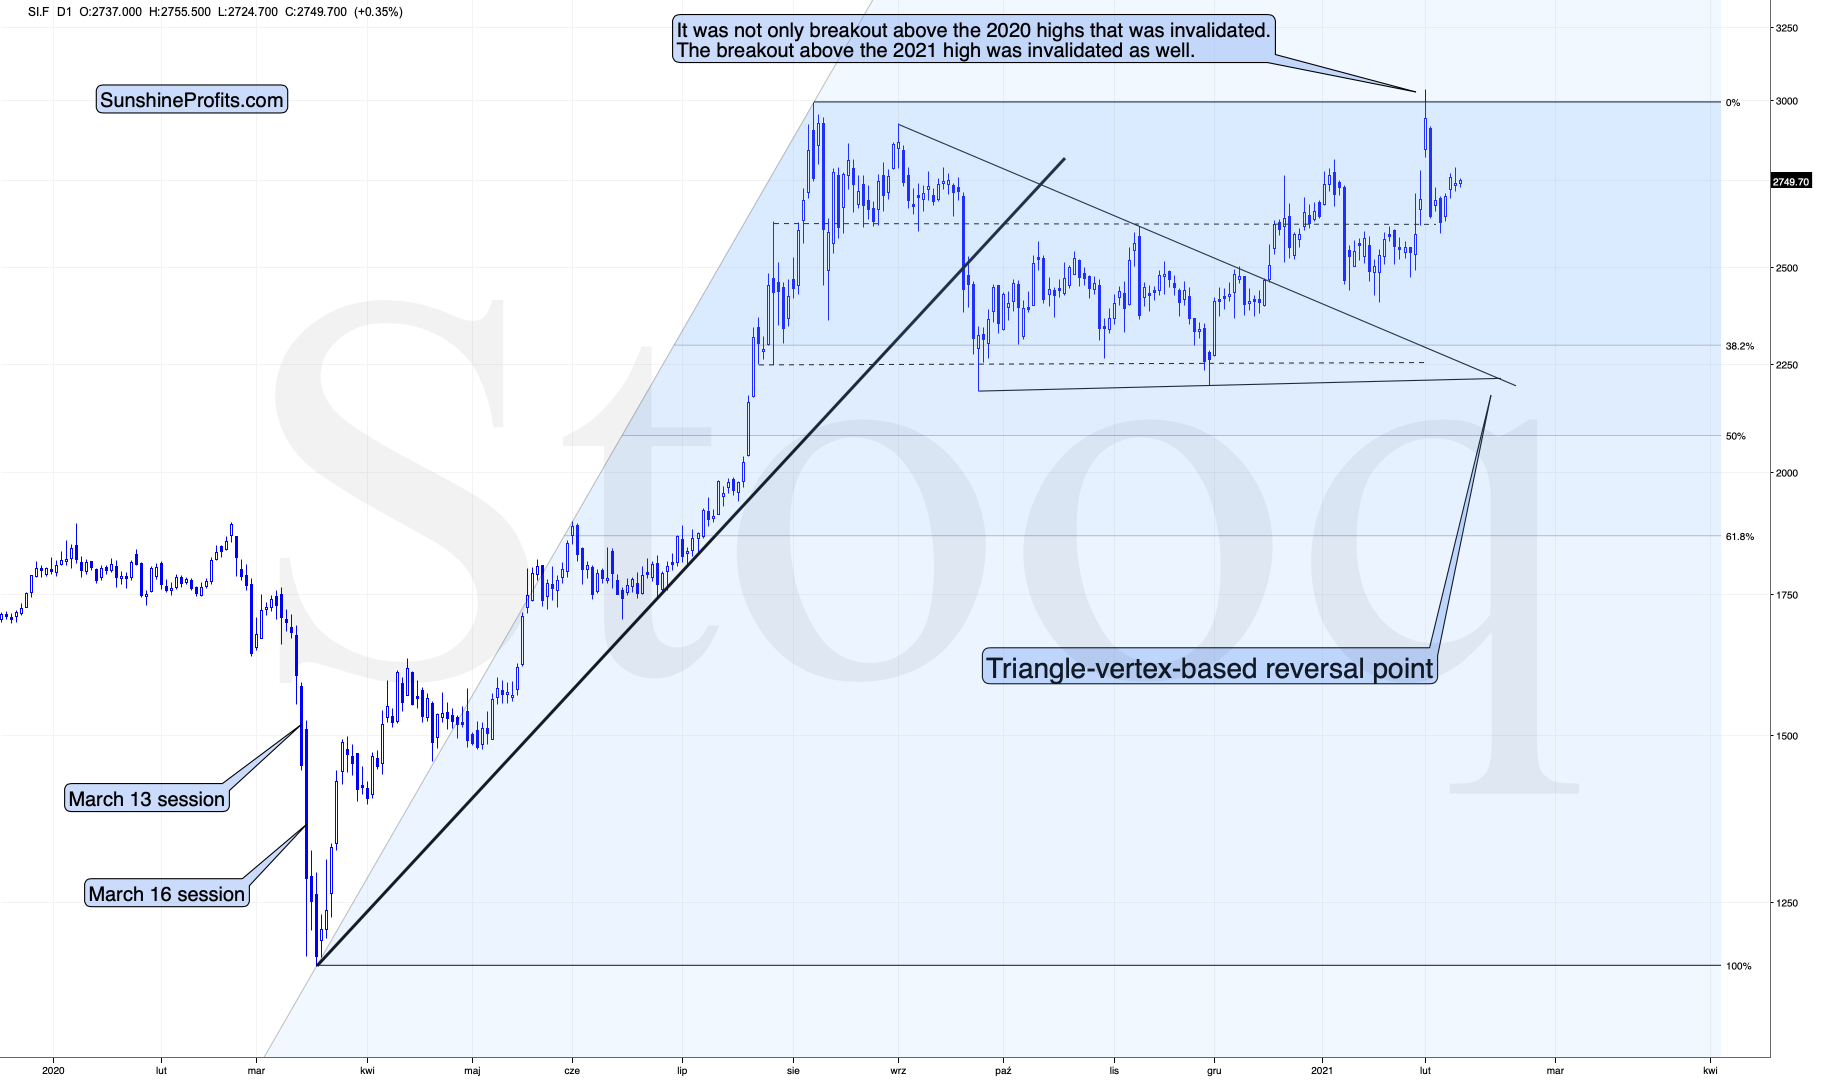
Figure 3 - COMEX Silver Futures
Not really. Just like gold, silver is taking a breather after the increased volatility. This is normal.
Speaking of silver, please note how big the silver inflows were last week.
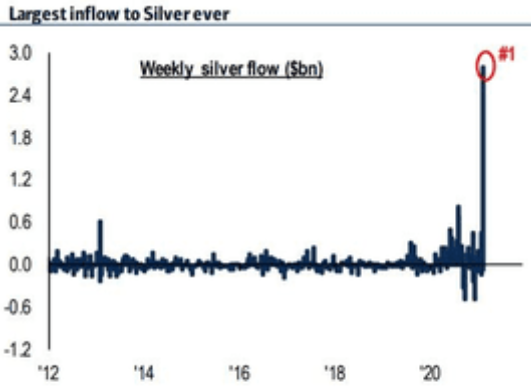
Figure 4
This might seem bullish at first sight – a lot of capital entering the silver market is bound to push the silver price higher, right?
Wrong. This could simply be an indication of a temporary (yet massive) increase in the white metal’s potential (which no doubt will be realized, but not necessarily yet), which is something that we tend to see at market tops along with increased interest in terms like “silver squeeze” or “silver manipulation”.
Please compare the first spike that you can see on the above chart with what silver did next (on the following chart).
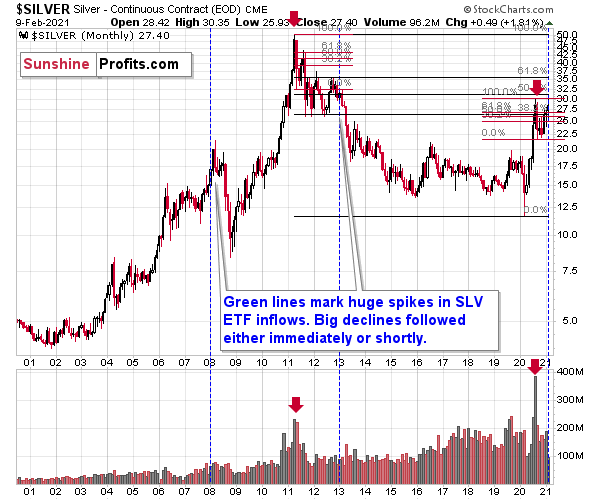
Figure 5
Silver declined severely in the first half of 2013. Also please note that at that time, the silver market was already well after the massive monthly volume spike. We saw the same thing in mid-2020.
The outlook for silver is very bullish for the next years, but the implications of the above factors are very bearish for the medium term.
And the miners?
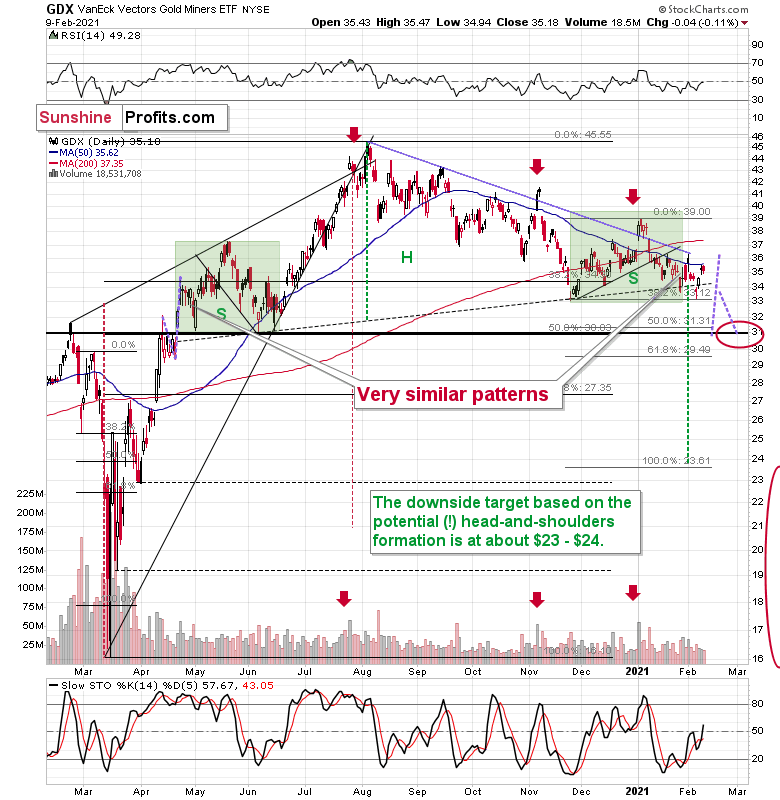
Figure 6 - VanEck Vectors Gold Miners ETF (GDX)
Mining stocks declined slightly yesterday, which is a telling sign when compared with gold’s small (but still) rally. Miners tend to underperform gold at the top, and that’s likely what we just saw.
Overall, mining stocks are declining in a relatively regular manner as well. After their early January top, they declined profoundly, and since that time they have also been declining, but at a slower pace. We’ve been seeing lower highs and lower lows in the past month or so, and this week’s upswing fits this pattern very well.
Ever since the mid-September breakdown below the 50-day moving average, the GDX ETF was unable to trigger a substantial and lasting move above this MA. The times when the GDX was able to move above it were also the times when the biggest short-term declines started.
So, did anything change yesterday? Not really.
My previous comments on the above chart remain up-to-date:
The most recent move higher only made the similarity of this shoulder portion of the bearish head-and-shoulders pattern to the left shoulder (figure 2 - both marked with green) bigger. This means that when the GDX breaks below the neck level of the pattern in a decisive way, the implications are likely to be extremely bearish for the next several weeks or months.
Due to the uncanny similarity between the two green rectangles, I decided to check what happens if this mirror-similarity continues. I used purple, dashed lines for that. There were two important short-term price swings in April 2020 – one shows the size of the correction and one is a near-vertical move higher.
Copying these price moves (purple lines) to the current situation, we get a scenario in which GDX (mining stocks) moves to about $31 and then comes back up to about $34. This would be in perfect tune with what I wrote previously. After breaking below the head-and-shoulders pattern, gold miners would then be likely to verify this breakdown by moving back up to the neck level of the pattern. Then, we would likely see another powerful slide – perhaps to at least $24.
This is especially the case, since silver and mining stocks tend to decline particularly strongly if the stock market is declining as well. And while the exact timing of the market’s slide is not 100% clear, stocks’ day of reckoning is coming. And it might be very, very close.
Eyes Wide Shut
As the NASDAQ Composite records yet another all-time high, investors are sleepwalking through one of the most dangerous equity markets ever.
On Feb. 4, I warned that fund managers’ cash positions were frighteningly low.
I wrote:
Mutual fund managers are now holding less than 2% of their portfolios in cash – an all-time low.
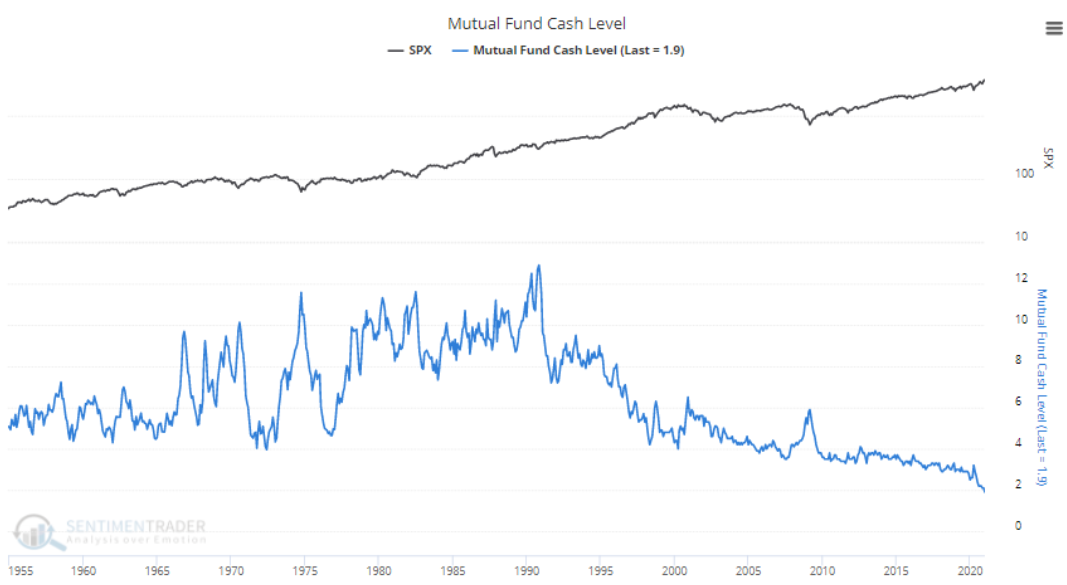
Figure 7 - Source: SentimenTrader
Moreover, with fear of missing out (FOMO) taking a sledgehammer to valuation, pension funds are also following the bad behavior. If you analyze the chart below, you can see that pension fund cash positions have fallen to 2.6% – also an all-time low.
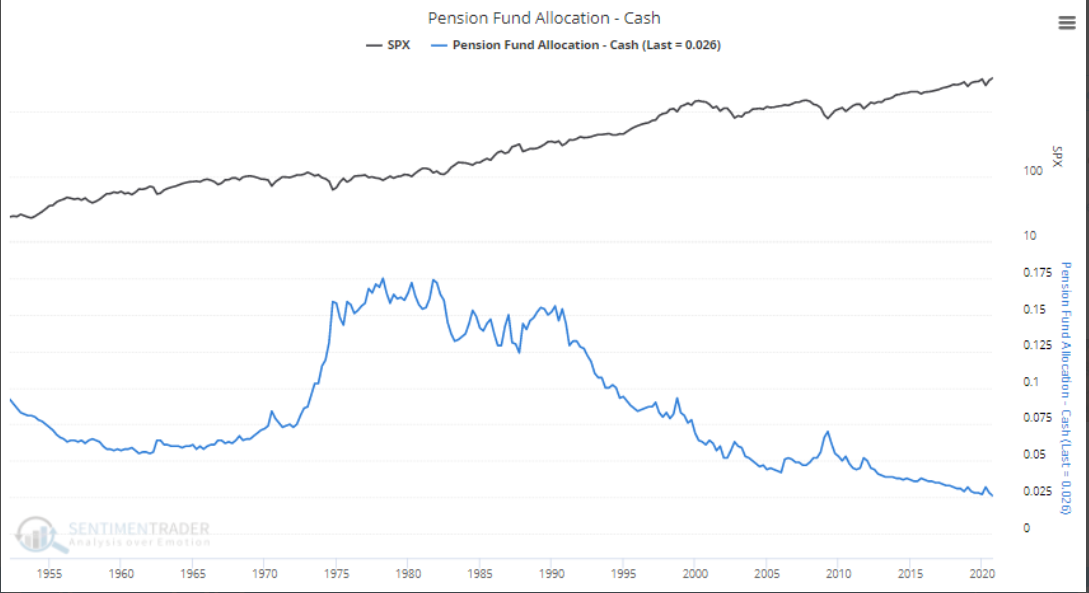
Figure 8 - Source: SentimenTrader
And with daydreams of riches continuing to transfix rationality, the upward inertia has left equity bears nearly extinct. As of Jan. 15 (the latest data available), S&P 500 short interest has hit its lowest level since the peak of the dot-com bubble.
Please see below:
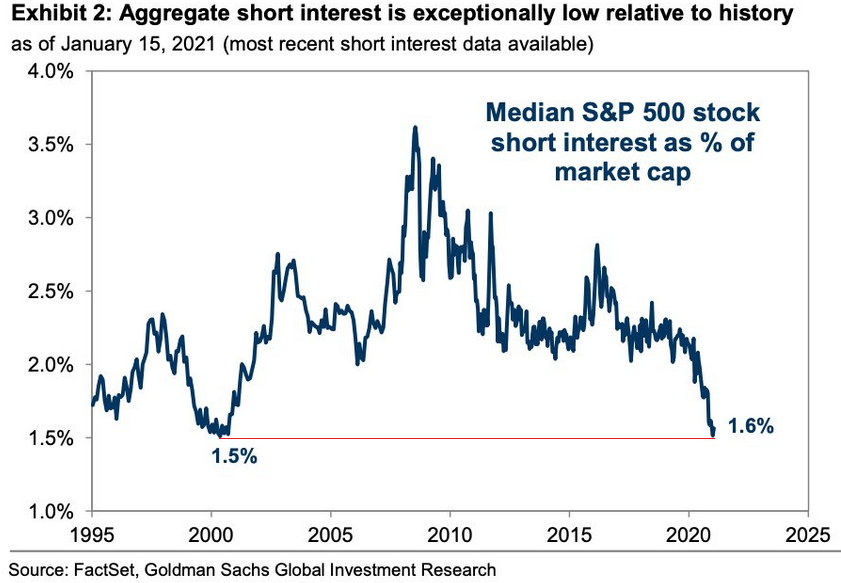
Figure 9
To explain the importance, fund managers’ cash positions and short sellers are akin to airbags in your car. In the event of a crash, airbags serve their purpose by cushioning the blow. Similarly, when the market crashes, short-sellers cover their positions (by purchasing the underlying asset), helping to alleviate the downward impact. Similarly, when fund managers’ cash positions are high, they have more ‘dry powder’ at their disposal to hit the bid and support prices. As a result, with both variables being excommunicated, nearly every investor is now driving with their pedal to the metal.
Also encapsulating the speculative euphoria, last week, technology companies recorded their highest-ever weekly inflow.
Please see below:
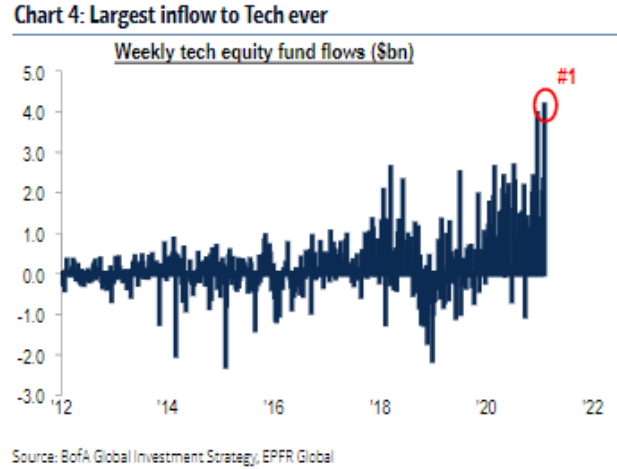
Figure 10
And not to be outdone, the Russell 2000 (a proxy for U.S. small caps) is also earning its fair share of speculative gold medals. On Feb. 4, I warned that money was pouring into companies that are on the brink of financial distress.
I wrote:
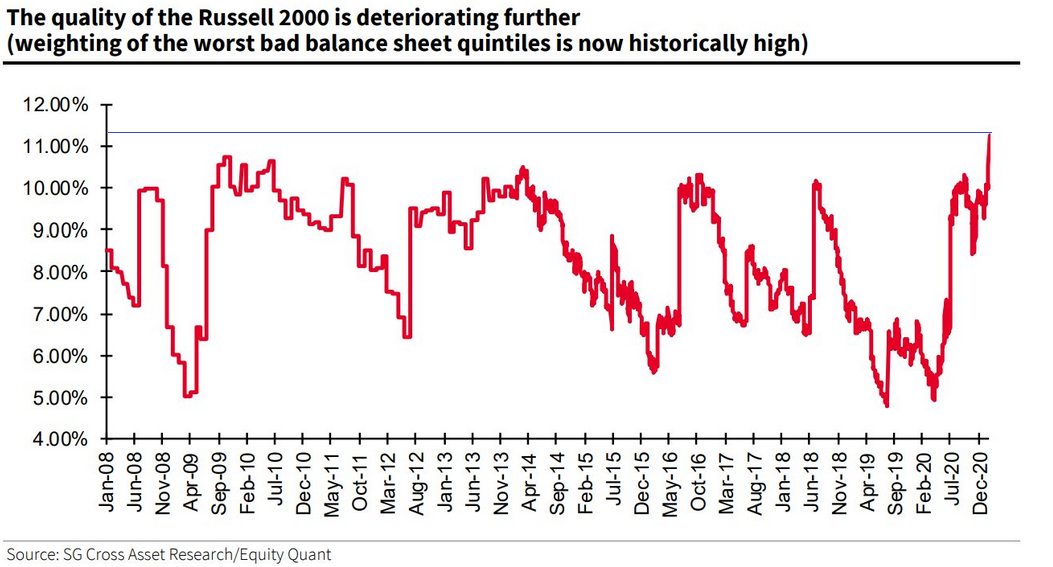
Figure 11
The red line above represents companies with ‘weak balance sheets.’ Essentially, these are companies with high leverage ratios that rely on a strong economic backdrop to service their debt. At the end of 2019, these companies made up roughly 6% of the Russell 2000 index. Today, that figure has nearly doubled to an all-time high of more than 11%.
Moreover, amid investors’ foray into the riskiest corners of the U.S. equity market, they’ve also bid the Russell 2000 (as of Feb. 8) to more than 39% above its 200-day moving average (also an all-time high).
Please see below:
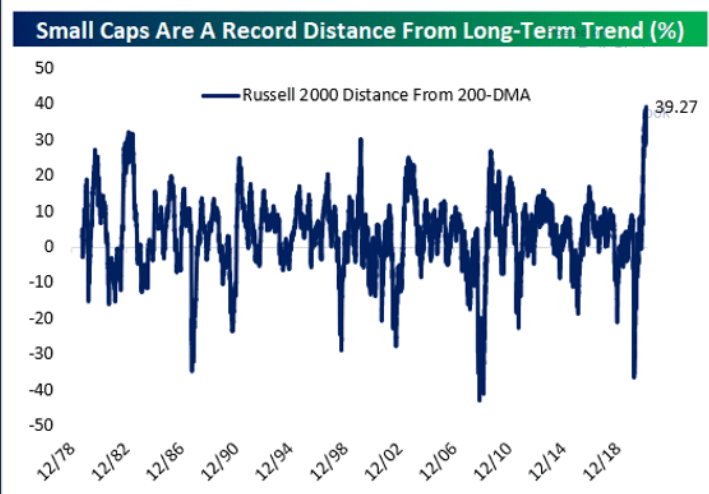
Figure 12 - Source: thedailyshot.com
Ignoring a sound diet, bond investors also continue to feast on junk food. On Feb. 8, the average yield on junk bonds (represented by Barclays U.S. Corporate High-Yield index) fell below 4% for the first-time ever.
Please see below:
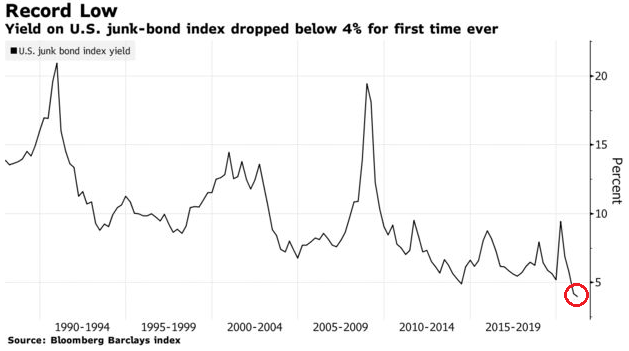
Figure 13
In addition, issuances of CCC-rated debt – the riskiest tier of junk – have been massively oversubscribed, as yield-hungry investors throw caution to the wind. More importantly though, the frenzy has lured even riskier companies to the market, with the group raising a record $52 billion in January alone.
Even more indicative of the reckless behavior, the riskiest companies are also negotiating the riskiest loan terms. Peddling payment-in-kind (PIK) interest, junk bond issuers are now paying investors with IOUs. Unlike traditional bonds, where fixed cash flows are paid at pre-defined dates, PIK bonds are essentially loans on top of loans. Here, investors forego cash payments and add hypothetical interest payments to their bond’s principal balance. Then, at maturity, investors receive the entire proceeds.
And what’s the problem?
Well, as I’m sure you can tell, the IOUs are worthless if insolvency strikes first.
Moving up the speculative ladder, in January, small traders bought call options at nearly 9x their 2019 pace. For context, ‘small traders’ purchase 10 or less call option contracts and have exposure to 1,000 shares or less. As such, they’re usually the least sophisticated market participants.
But because their Delta/Gamma splurge continues to impact dealers’ hedging activity, U.S. equity volume has gone completely parabolic. On Feb. 8, U.S. equities (trading at record prices) exchanged hands at nearly 4x their historical average.
Please see below:
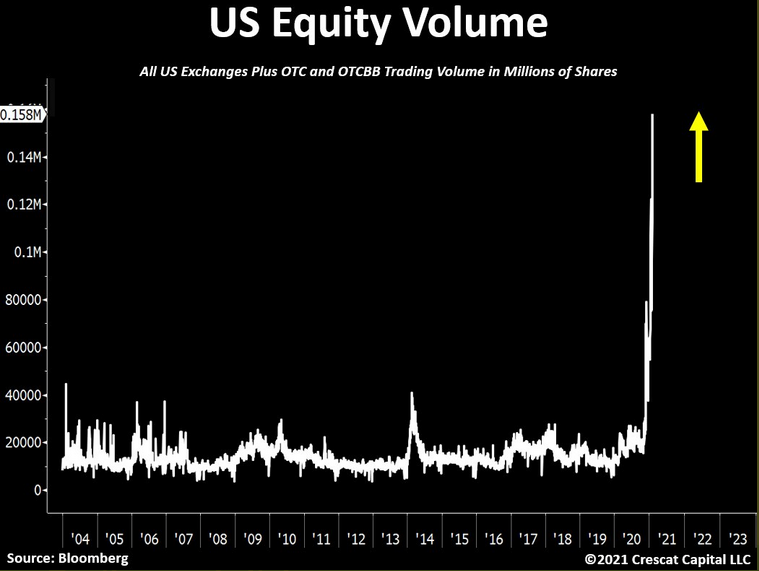
Figure 14
In addition, as more and more first-time buyers dip their toes into the equity pool, the ripple can be felt across Google Search trends. As of Feb. 8, online searches for “penny stocks” have exploded.
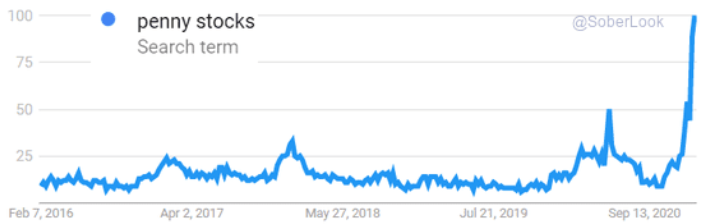
Figure 15 - Source: thedailyshot.com
Even more telling, retail interest in the stock market usually peaks during bouts of volatility. In a nutshell: when the stock market crashes and news outlets cover the story (that otherwise wouldn’t during normal times), it piques the interest of the general public. As a result, crashes tend to bring about investing tourists.
Please see below:
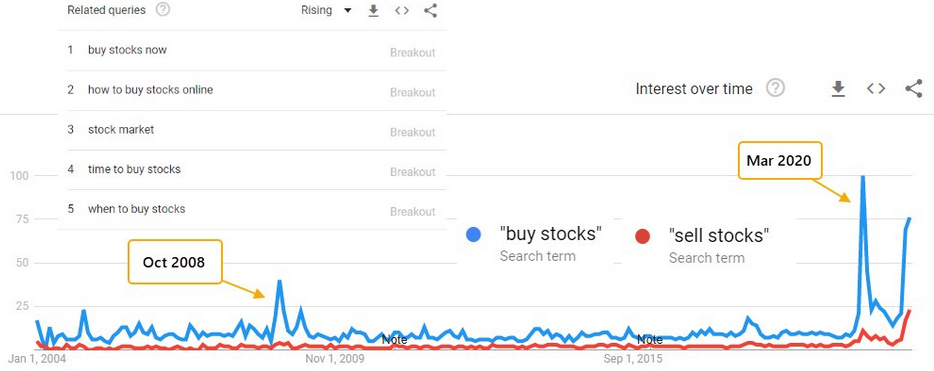
Figure 16 - Source: SentimenTrader
To explain the chart above, the blue line depicts the trend in “buy stocks” in Google searches over the last ~17 years. If you analyze the first two spikes in October 2008 and March 2020, they occurred alongside extreme market stress. However, if you look at the third spike on the right side of the chart (almost as high as March 2020), it’s occurred alongside U.S. equities current melt-up.
The key takeaway?
As the equity bubble grows larger, it’s sucking in more and more unsophisticated investors. However, as 2000 proved, overconfidence can give way to fear at the blink of an eye.
As the final chart in today’s edition, investors’ belief in a utopian future has also come full circle.
Please see below:
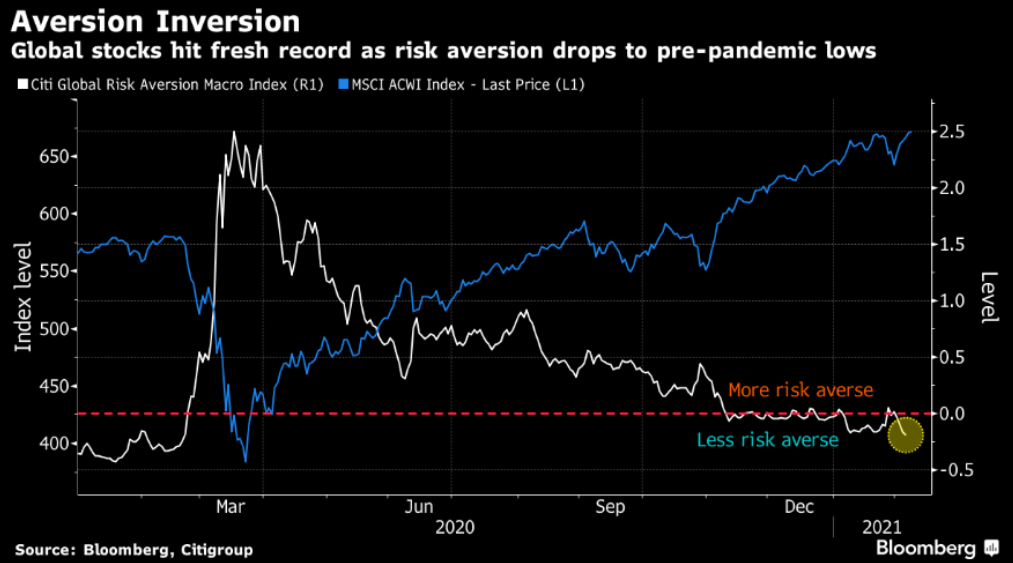
Figure 17
To explain, the white line above depicts the movement of Citigroup’s Global Risk Aversion Macro Index – which uses credit spreads, swap spreads and implied volatility to quantify investors’ perception of risk. As you can see, the index is now back to its pre-pandemic lows. More importantly though, the reading encapsulates all of the above and highlights the excessive complacency underwriting global equities.
In conclusion, global stocks are living on a razor’s edge and their margin for error continues to dwindle. And due to gold and silver’s moderate-to-strong correlation with the S&P 500 (250-day correlations of 0.71 and 0.87 respectively), one false step could knock over the entire house of cards. As a result, it’s prudent to consider these cross-asset implications when assessing the future performance of the precious metals. However, once the events reach their precipice, the PMs will be able to resume their long-term uptrend.
Overview of the Upcoming Part of the Decline
- I expect the initial bottom to form with gold falling to roughly $1,700, and I expect the GDX ETF to decline to about $31 - $32 at that time. I then plan to exit the short positions in the miners and I will consider long positions in the miners at that time – in order to benefit from the likely rebound.
I expect the above-mentioned decline to take another 1 – 7 weeks to materialize and I expect the rebound to take place during 1-3 weeks.
- After the rebound (perhaps to $33 - $34 in the GDX), I plan to get back in with the short position in the mining stocks.
- Then, after miners slide once again in a meaningful and volatile way, but silver doesn’t (and it just declines moderately), I plan to switch from short positions in miners to short positions in silver (this could take another 1-4 weeks to materialize). I plan to exit those short positions when gold shows substantial strength relative to the USD Index, while the latter is still rallying. This might take place with gold close to $1,500 and the entire decline (from above $1,700 to about $1,500) would be likely to take place within 1-10 weeks and I would expect silver to fall hardest in the final part of the move. This moment (when gold performs very strongly against the rallying USD and miners are strong relative to gold – after gold has already declined substantially) is likely to be the best entry point for long-term investments in my view. This might happen with gold close to $1,500, but it’s too early to say with certainty at this time.
Consequently, the entire decline could take between 3 and 20 weeks, while the initial part of the decline (to $1,700 in gold) is likely to take between 1 and 7 weeks.
If gold declines even below $1,500 (say, to ~$1250 or so), then it could take another 10 weeks or so for it to bottom, but this is not what I view as a very likely outcome.
The above is based on the information available today and it might change in the following days/weeks.
Summary
To summarize, the PMs short-term downswing has likely just begun, as miners broke below the neck level of their almost-yearly head-and-shoulders formation. We saw a small invalidation, but we don’t trust its bullish implications – we just saw something similar that failed to ignite a lasting rally and the USD’s decline seems to be a normal, post-breakout pullback.
In addition, because we’re likely entering the “winter” part of the Kondratiev cycle, the outlook for the precious metals’ sector remains particularly bearish during the very first part of the cycle, when cash is king.
Silver’s strength seems bullish at first sight, but taking a closer look at this move, and comparing it with previous cases (when silver got so much attention) and with miners’ weakness, provides us with bearish implications for the medium term.
The confirmed breakout in the USD Index is yet another confirmation of the bearish outlook for the precious metals market.
Naturally, everyone's trading is their responsibility. But in our opinion, if there ever was a time to either enter a short position in the miners or increase its size if it was not already sizable, it's now. We made money on the March decline, and on the March rebound, with another massive slide already underway.
After the sell-off (that takes gold to about $1,500), we expect the precious metals to rally significantly. The final part of the decline might take as little as 1-5 weeks, so it's important to stay alert to any changes.
Most importantly, please stay healthy and safe. We made a lot of money on the March decline and the subsequent rebound (its initial part) price moves (and we'll likely earn much more in the following weeks and months), but you have to be healthy to enjoy the results.
As always, we'll keep you - our subscribers - informed.
To summarize:
Trading capital (supplementary part of the portfolio; our opinion): Full speculative short positions (300% of the full position) in mining stocks is justified from the risk to reward point of view with the following binding exit profit-take price levels:
Senior mining stocks (price levels for the GDX ETF): binding profit-take exit price: $32.02; stop-loss: none (the volatility is too big to justify a SL order in case of this particular trade); binding profit-take level for the DUST ETF: $23.89; stop-loss for the DUST ETF: none (the volatility is too big to justify a SL order in case of this particular trade)
Junior mining stocks (price levels for the GDXJ ETF): binding profit-take exit price: $42.72; stop-loss: none (the volatility is too big to justify a SL order in case of this particular trade); binding profit-take level for the JDST ETF: $14.19; stop-loss for the JDST ETF: none (the volatility is too big to justify a SL order in case of this particular trade)
For-your-information targets (our opinion; we continue to think that mining stocks are the preferred way of taking advantage of the upcoming price move, but if for whatever reason one wants / has to use silver or gold for this trade, we are providing the details anyway. In our view, silver has greater potential than gold does):
Silver futures downside profit-take exit price: unclear at this time - initially, it might be a good idea to exit, when gold moves to $1,703.
Gold futures downside profit-take exit price: $1,703
Long-term capital (core part of the portfolio; our opinion): No positions (in other words: cash
Insurance capital (core part of the portfolio; our opinion): Full position
Whether you already subscribed or not, we encourage you to find out how to make the most of our alerts and read our replies to the most common alert-and-gold-trading-related-questions.
Please note that we describe the situation for the day that the alert is posted in the trading section. In other words, if we are writing about a speculative position, it means that it is up-to-date on the day it was posted. We are also featuring the initial target prices to decide whether keeping a position on a given day is in tune with your approach (some moves are too small for medium-term traders, and some might appear too big for day-traders).
Additionally, you might want to read why our stop-loss orders are usually relatively far from the current price.
Please note that a full position doesn't mean using all of the capital for a given trade. You will find details on our thoughts on gold portfolio structuring in the Key Insights section on our website.
As a reminder - "initial target price" means exactly that - an "initial" one. It's not a price level at which we suggest closing positions. If this becomes the case (like it did in the previous trade), we will refer to these levels as levels of exit orders (exactly as we've done previously). Stop-loss levels, however, are naturally not "initial", but something that, in our opinion, might be entered as an order.
Since it is impossible to synchronize target prices and stop-loss levels for all the ETFs and ETNs with the main markets that we provide these levels for (gold, silver and mining stocks - the GDX ETF), the stop-loss levels and target prices for other ETNs and ETF (among other: UGL, GLL, AGQ, ZSL, NUGT, DUST, JNUG, JDST) are provided as supplementary, and not as "final". This means that if a stop-loss or a target level is reached for any of the "additional instruments" (GLL for instance), but not for the "main instrument" (gold in this case), we will view positions in both gold and GLL as still open and the stop-loss for GLL would have to be moved lower. On the other hand, if gold moves to a stop-loss level but GLL doesn't, then we will view both positions (in gold and GLL) as closed. In other words, since it's not possible to be 100% certain that each related instrument moves to a given level when the underlying instrument does, we can't provide levels that would be binding. The levels that we do provide are our best estimate of the levels that will correspond to the levels in the underlying assets, but it will be the underlying assets that one will need to focus on regarding the signs pointing to closing a given position or keeping it open. We might adjust the levels in the "additional instruments" without adjusting the levels in the "main instruments", which will simply mean that we have improved our estimation of these levels, not that we changed our outlook on the markets. We are already working on a tool that would update these levels daily for the most popular ETFs, ETNs and individual mining stocks.
Our preferred ways to invest in and to trade gold along with the reasoning can be found in the how to buy gold section. Furthermore, our preferred ETFs and ETNs can be found in our Gold & Silver ETF Ranking.
As a reminder, Gold & Silver Trading Alerts are posted before or on each trading day (we usually post them before the opening bell, but we don't promise doing that each day). If there's anything urgent, we will send you an additional small alert before posting the main one.
Thank you.
Przemyslaw Radomski, CFA
Founder, Editor-in-chief

