

Briefly: in our opinion, full (200% of the regular size of the position) speculative short positions in gold, silver and mining stocks are justified from the risk/reward perspective at the moment of publishing this alert.
Gold, silver, and mining stocks moved lower on Friday, but they didn’t move below their previous short-term lows, so this session might not seem particularly important. But it was. The weekly closing prices are more meaningful than the daily ones and what we saw in them makes the case for the next big move even stronger. This is no time to be hesitating what to do. It’s time to be prepared. And profit.
Let’s start today’s analysis with a quick update on the short-term price performance of gold, silver, and mining stocks (charts courtesy of http://stockcharts.com).
Metals and Miners at Previous Lows
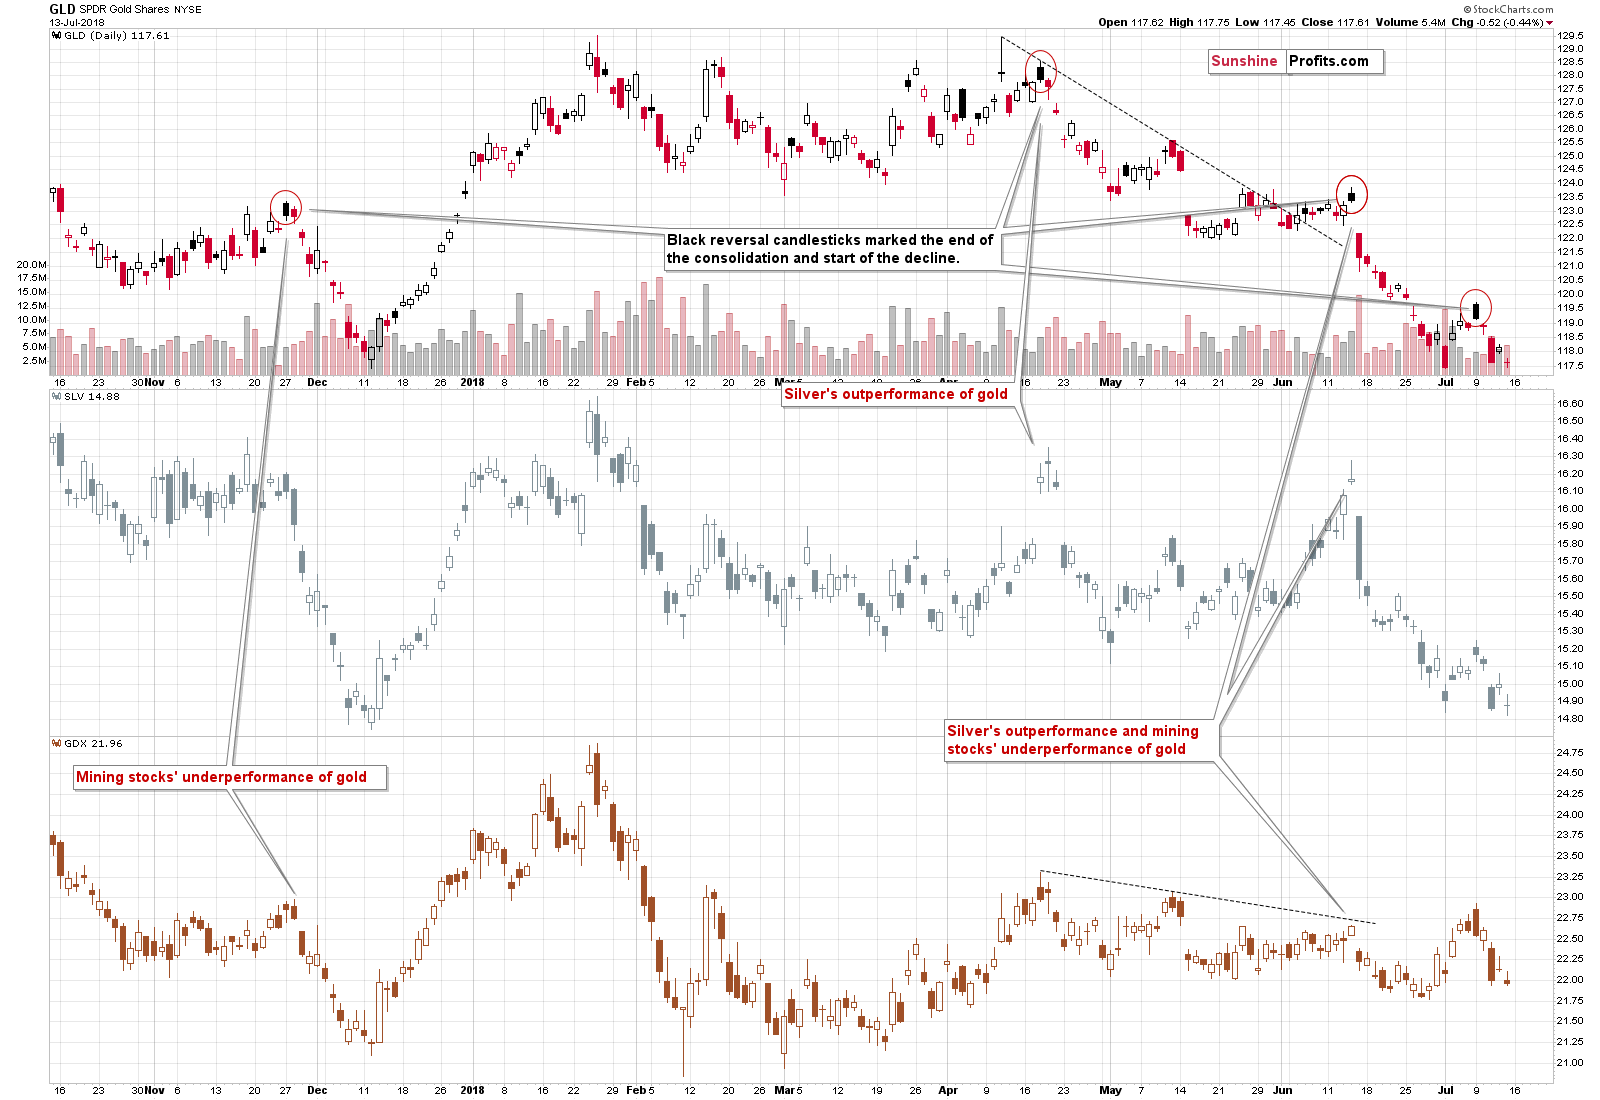
The above title summarizes the chart quite well. Gold, silver and miners moved to their previous lows and there was no meaningful breakdown from this point of view.
Unlike gold and silver, mining stocks are not at their 2018 lows, which seems quite bullish at first sight, but it’s not. We have already discussed the moves in the gold stocks to gold ratio and how it verified its major breakdown and then invalidated a few more short-term breakouts. What we see on the above chart is the consequence of the earlier outperformance that has not yet been reversed. But, based on the verification of the breakdown and the invalidation, the miners’ strength is likely over and it’s only a matter of time before their underperformance becomes more prominent.
Overall, not much changed on Friday and the outlook is just as bearish as it had been previously.
What changed and what was very important is that we had important weekly moves that were confirmed by closing prices. This goes for both: gold, and the key currency that influences it – the Japanese yen.
Speaking of currencies, Friday’s session wasn’t spectacular in daily terms if you look at PMs performance alone, but when you compare it to the fact that the USD Index moved a bit lower on that day, it becomes a strong bearish signal.
Gold-USD Link and Yen’s Major Breakdown
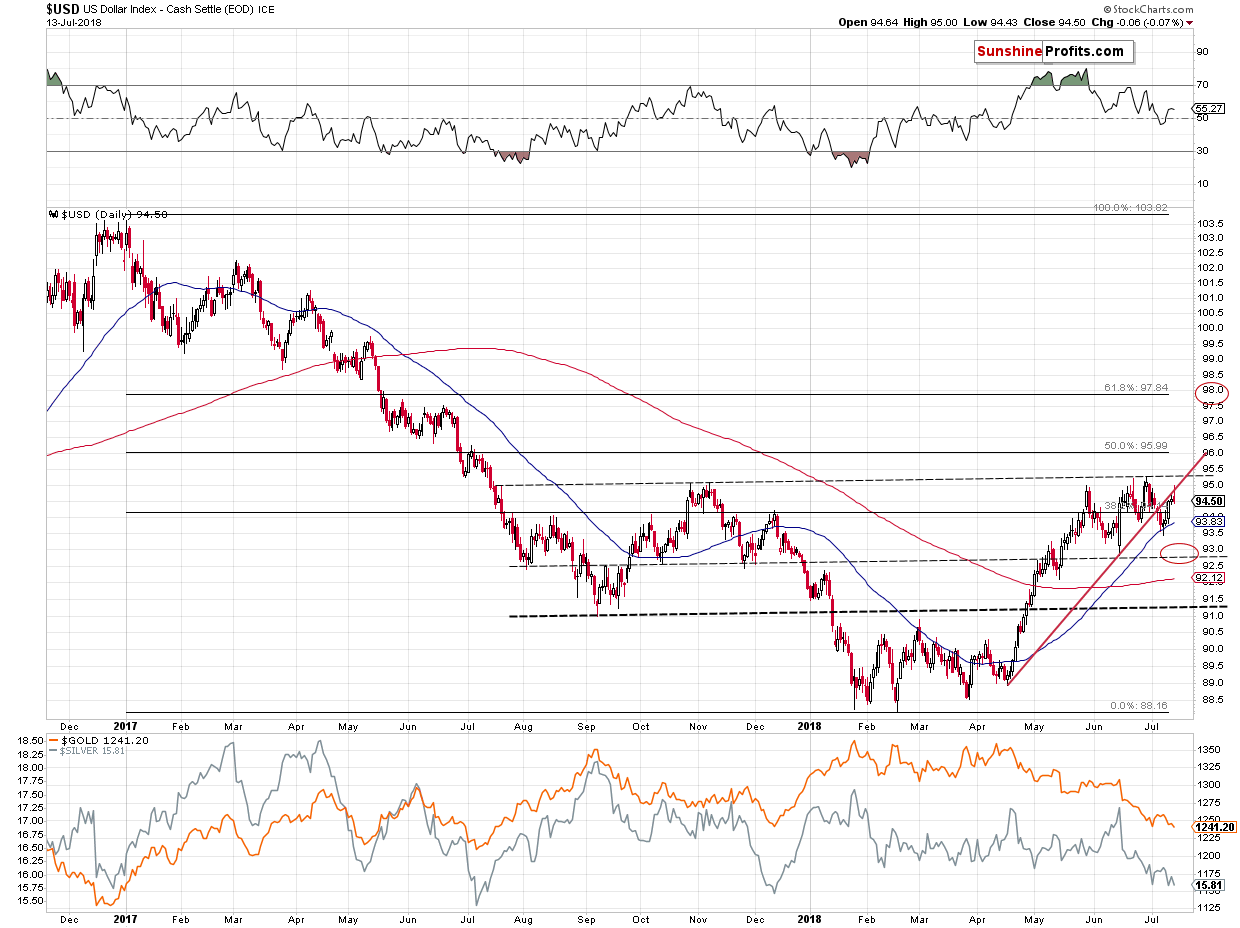
The USD Index moved initially higher on Friday, but it declined shortly thereafter and overall it managed to move back above the rising red support/resistance line. Consequently, our previous comments remain up-to-date:
The USD Index has recently moved below the rising red support line and this was the factor that was supposed to take it much lower and trigger a sizable rally in gold. At first sight, nothing really changed in the case of the USDX – it’s still below the rising red support line, possibly verifying it as resistance.
But, in this case it seems like the devil is in the details. The key 2 components of the USD Index are the euro and the yen. The euro moved very close to its resistance and it seems to be in the decline mode. The situation in the Japanese yen is also very specific.
In the past few Alerts we discussed yen’s short- and medium-term breakdowns and we wrote that they – along with yesterday’s pre-market decline – were a very good reason for a long-term breakdown.
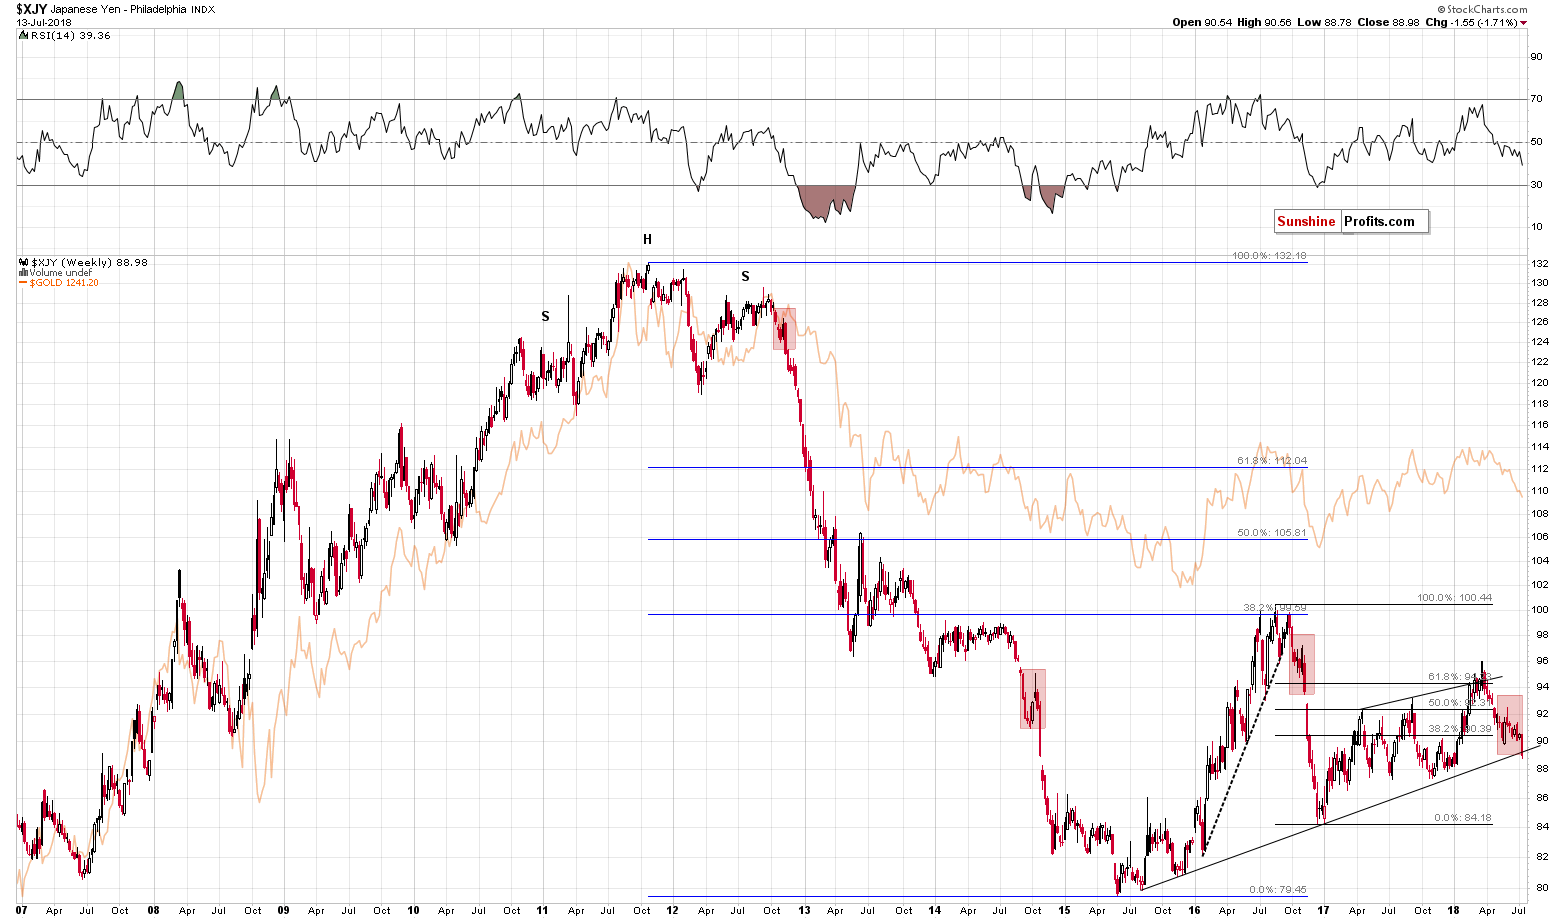
And we saw it. The Japanese yen just broke below the key long-term support line. Also, when viewing the currency while using the linear scale instead of a logarithmic one, this breakdown took place even sooner.
This is the most profound development on the long-term yen chart since the late-2016 breakdown. The results are clearly visible – a huge decline in the currency. And in gold.
There are multiple factors pointing to lower gold prices right now and this breakdown is one of the most important ones. Naturally, the breakdowns need to be confirmed, before their implications are completely bearish. But, let’s keep in mind that the yen is already after short- and medium-term breakdowns.
The breakdown below the red triangle is definitely confirmed and the move below the rising dashed line is almost fully confirmed. Almost, because ideally we would want to see three consecutive trading closes below a certain price level to say that the breakdown is verified, but at the same time there has been no rally so far today, so it seems that we’ll have the third day today. Plus, the breakdowns can be verified if the move below a given support level is really significant – and this also seems to be the case right now.
So, based on the short- and medium-term breakdowns, we are likely to see a confirmation of the long-term breakdown. This makes the outlook already very bearish.
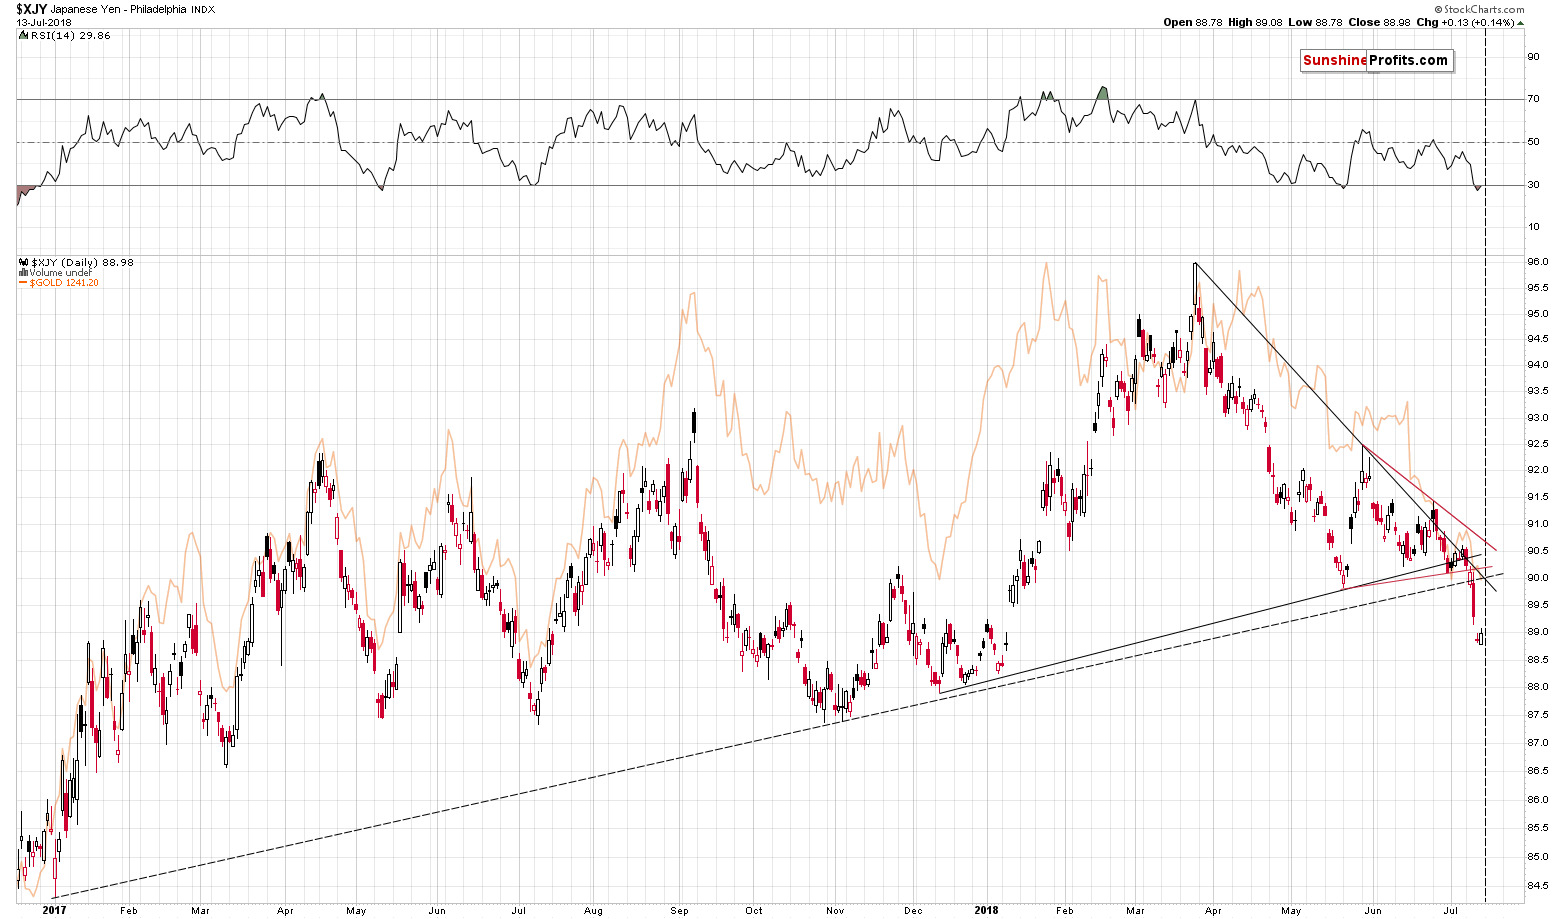
The Japanese yen closed the week below the rising long-term support line and the breakdown below the medium-term support line was confirmed by the third consecutive close below it. Both mean that the outlook for the Japanese currency has deteriorated substantially for the following weeks.
Due to the strong link between gold and yen, the above means that the odds of seeing a huge decline in the following weeks (not necessarily days, though, but we’ll move to that in the next paragraph) in both the yen and the precious metals sector, increased substantially.
Let’s keep in mind that there’s a triangle-apex-based reversal today (vertical dashed line), which may mean that we can see some kind of reversal today and a very short-term rally. This would likely serve as a quick verification of the breakdown below the long-term support line. The verification of a breakdown is not a bullish phenomenon, but a bearish one and it doesn’t seem that one should adjust their positions based on just the above. The same goes for the very short-term outlook in the case of gold and the rest of the precious metals sector.
In other words, a short-term corrective upswing may take place and if it does, there’s no need to be stressed about it – it will be the normal course of action. Action that we think is best to be left ignored – i.e. we don’t think that adjusting the positions is a good idea. Why? Because of what happened after similar situations in the past.
Please take one more look at the long-term Japanese yen chart. There were three similar cases to the very recent one and we marked them with red rectangles. All corrective upswings after these similar patterns were so tiny that they are practically invisible on the above chart. In all these cases it was much better to just hold on to a position than to try to time every correction. That’s what we plan to do in the near term with regard to our positions in the metals – unless something major happens we’ll likely stick to the short positions.
All in all, the implications for the precious metals market are very bearish.
Having said that, let’s move to the other major factor that we saw based on the weekly closing prices.
Gold’s Long-term Breakdown
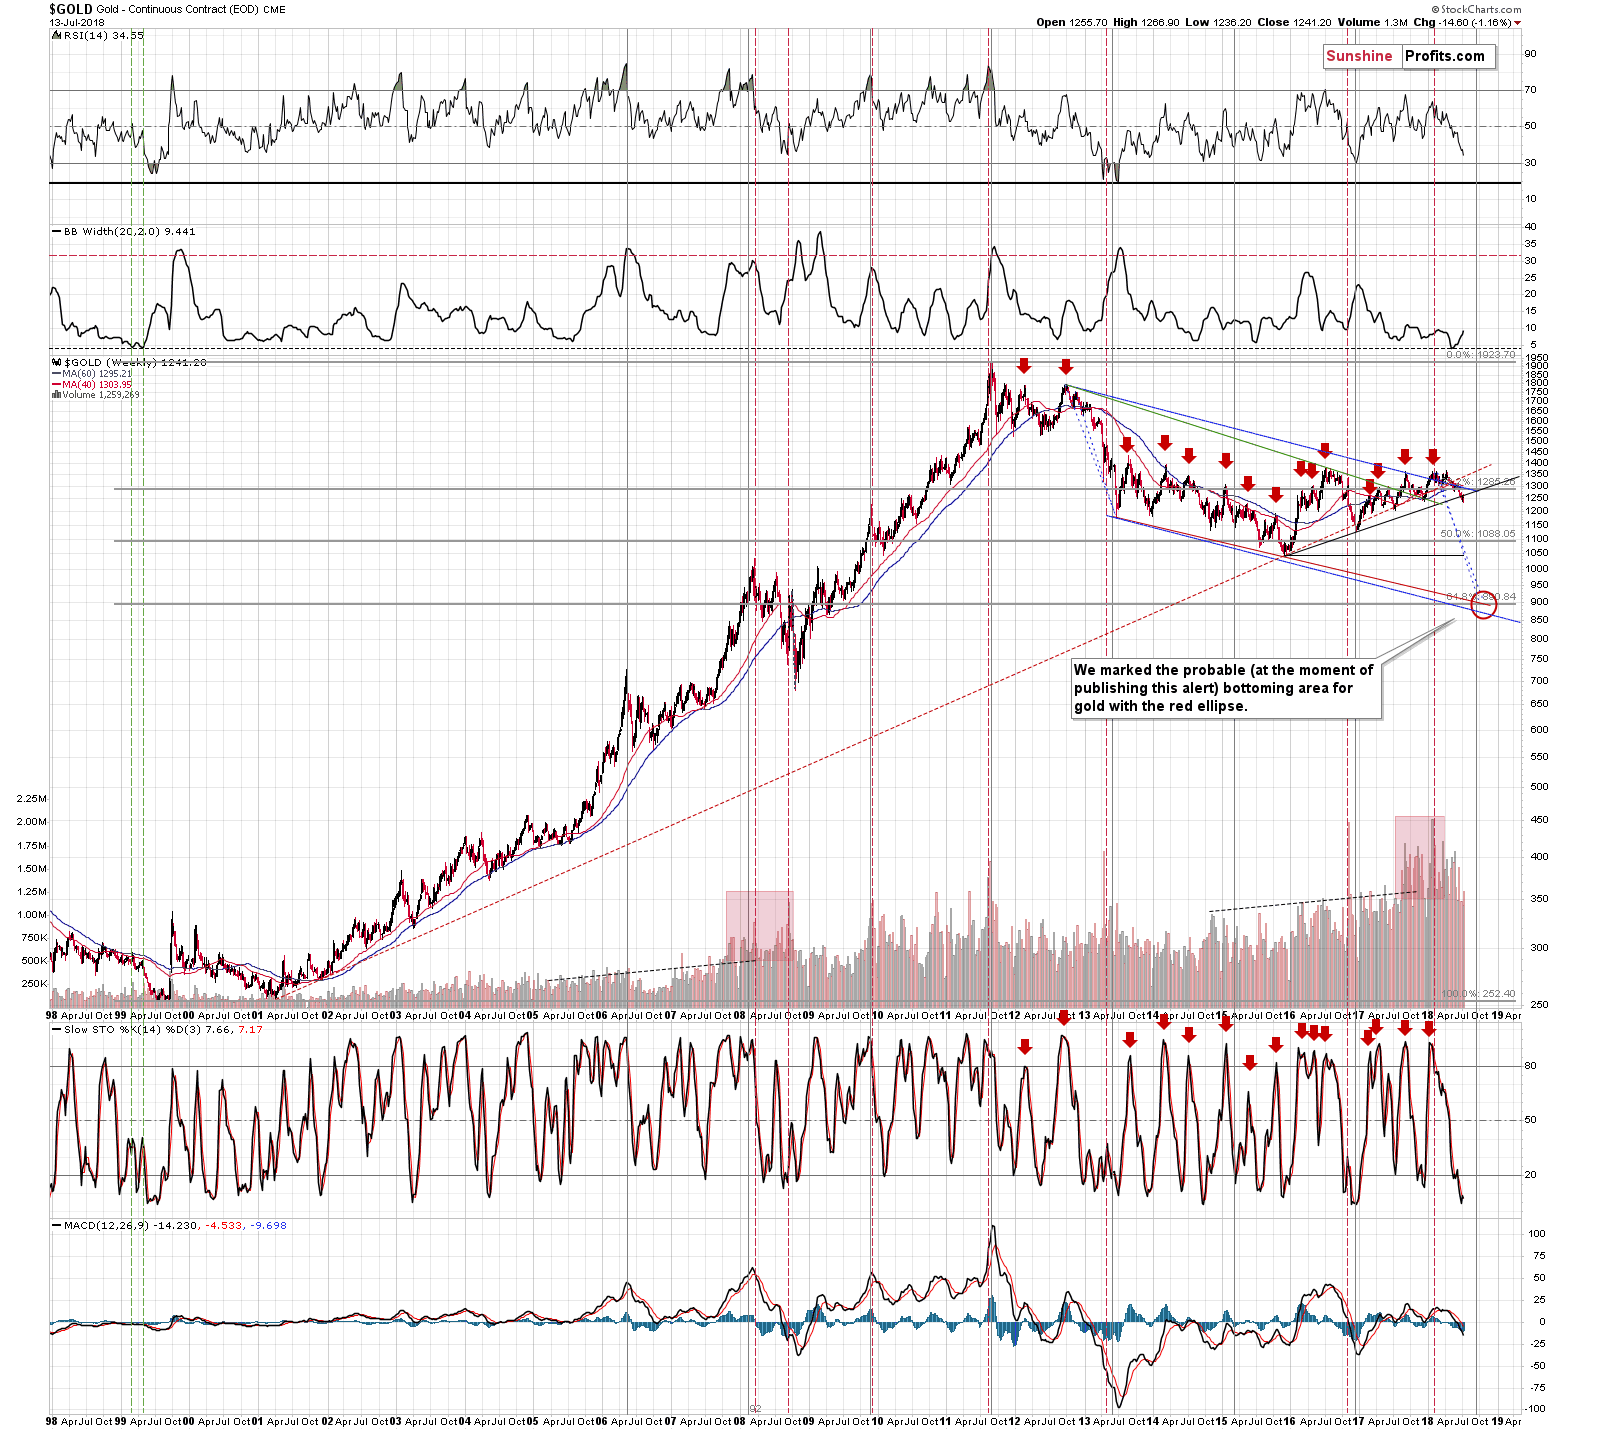
The key development that we saw is the breakdown in gold that was verified in terms of time and by a temporary move back to the previously broken line and another slide. The cherry on the analytical cake was the weekly closing price after the decline. And that’s what we saw.
We previously commented on gold’s breakdown in the following way:
Gold moved higher in the past several days, just like it was likely to based on several techniques. One of them was gold’s move to the rising medium-term support line based on the late 2015 and late 2016 bottoms. But, instead of rallying after reaching this line, gold moved below it and then rallied back up to it. Initially, gold reacted in a strong manner, but instead of invalidating the breakdown and rallying to $1,300 (which seemed quite realistic given very oversold situation in terms of the RSI indicator), gold just moved back to the rising support line and verified it as resistance.
One could say that it just attempted to move higher yesterday, and it will be successful today, but in light of today’s pre-market decline it seems that the odds for seeing a breakout are limited.
Verifications of breakdowns are bearish developments, so the above makes the outlook more bearish for the short term.
Last week’s performance is a perfect confirmation of the above, because gold declined and the weekly volume was the highest in 4 weeks.
Another factor worth discussing is gold’s volatility. We’re using the Bollinger Band’s width as a proxy for it and we previously discussed this in the June 4 Gold & Silver Trading Alert in the following way:
The second indicator from the top is the width of the Bollinger Band – a technical tool that can be used in a few ways and one of them checking when the bands are narrowing and viewing this as a sign of an upcoming huge move. Everyone heard the “calm before the storm” phrase and it is a perfect description of what the above technique tries to detect. It is designed to show if the market is currently too calm and it should make one suspicious as very calm and very volatile periods tend to be quite close to each other.
The Bollinger Band’s width is currently very small, which implies that a big move is just around the corner.
The above is just a general technique, so some may say that there’s no specific reason why it should work in gold at this particular time. The truth, however, is that there is not one but two specific reasons (or more depending on how one counts) why this technique should be taken into account and viewed as reliable.
The first confirmation is visible on the above chart and it’s the simple fact that this signal has already worked in case of the yellow metal – in 1999. We’ve seen the Bollband’s width as low as it was recently only one time in the past and it was followed by a big decline.
Even more importantly, it worked right before the final decline that ended a prolonged bear market and started a new bull market. Based on multiple other factors we had been expecting gold to slide one final time (below the 2015 lows) and then to move higher in the medium term. It is remarkable that the confirmation from the above technique suggests exactly that.
There may be some short-term implications as well. If you look closely, there were actually two times in 1999 when the Bollinger Band’s width was as low as it was recently. The first time triggered a decline and a smaller corrective upswing, which was then followed by another decline in the indicator and then the final slide.
We have recently seen a move lower in the width of the Bollinger Band along with a decline in gold and now we’re seeing a small corrective upswing in both of them. If the analogy to 1999 is to be upheld, this is the last stop before the final part of the bear market that started in 2011. In other words, the implications for the following weeks and months are very bearish.
When we wrote the above, gold was trading at about $1,300 and the Bollinger Band’s width was just starting to move higher after touching the horizontal dashed line, which marks the 1999 low.
The key thing that we want to emphasize today is that the analogy to 1999 continues. Just like we wrote above, there was a small corrective upswing and then gold’s decline continued.
Moreover, we saw that the volatility in gold increased along with lower gold prices. That’s particularly important, because there were many voices that suggested that low volatility in gold heralded an upcoming big upswing. Based on the analogy to the previous situations and multiple other factors, we wrote that this was not the case and that it was much more likely that gold was just beginning its final slide. Gold’s decline since we wrote the above along with the increase in volatility is confirming that we have most likely been correct about the way the volatility-based technique should work.
This also means that the biggest part of the decline is likely still ahead and it means that it’s high time to make preparations for the upcoming epic bottom in the precious metals sector.
Before summarizing, we would also like to show you the weekly performance in mining stocks.
Miners’ Bearish Weekly Candlestick
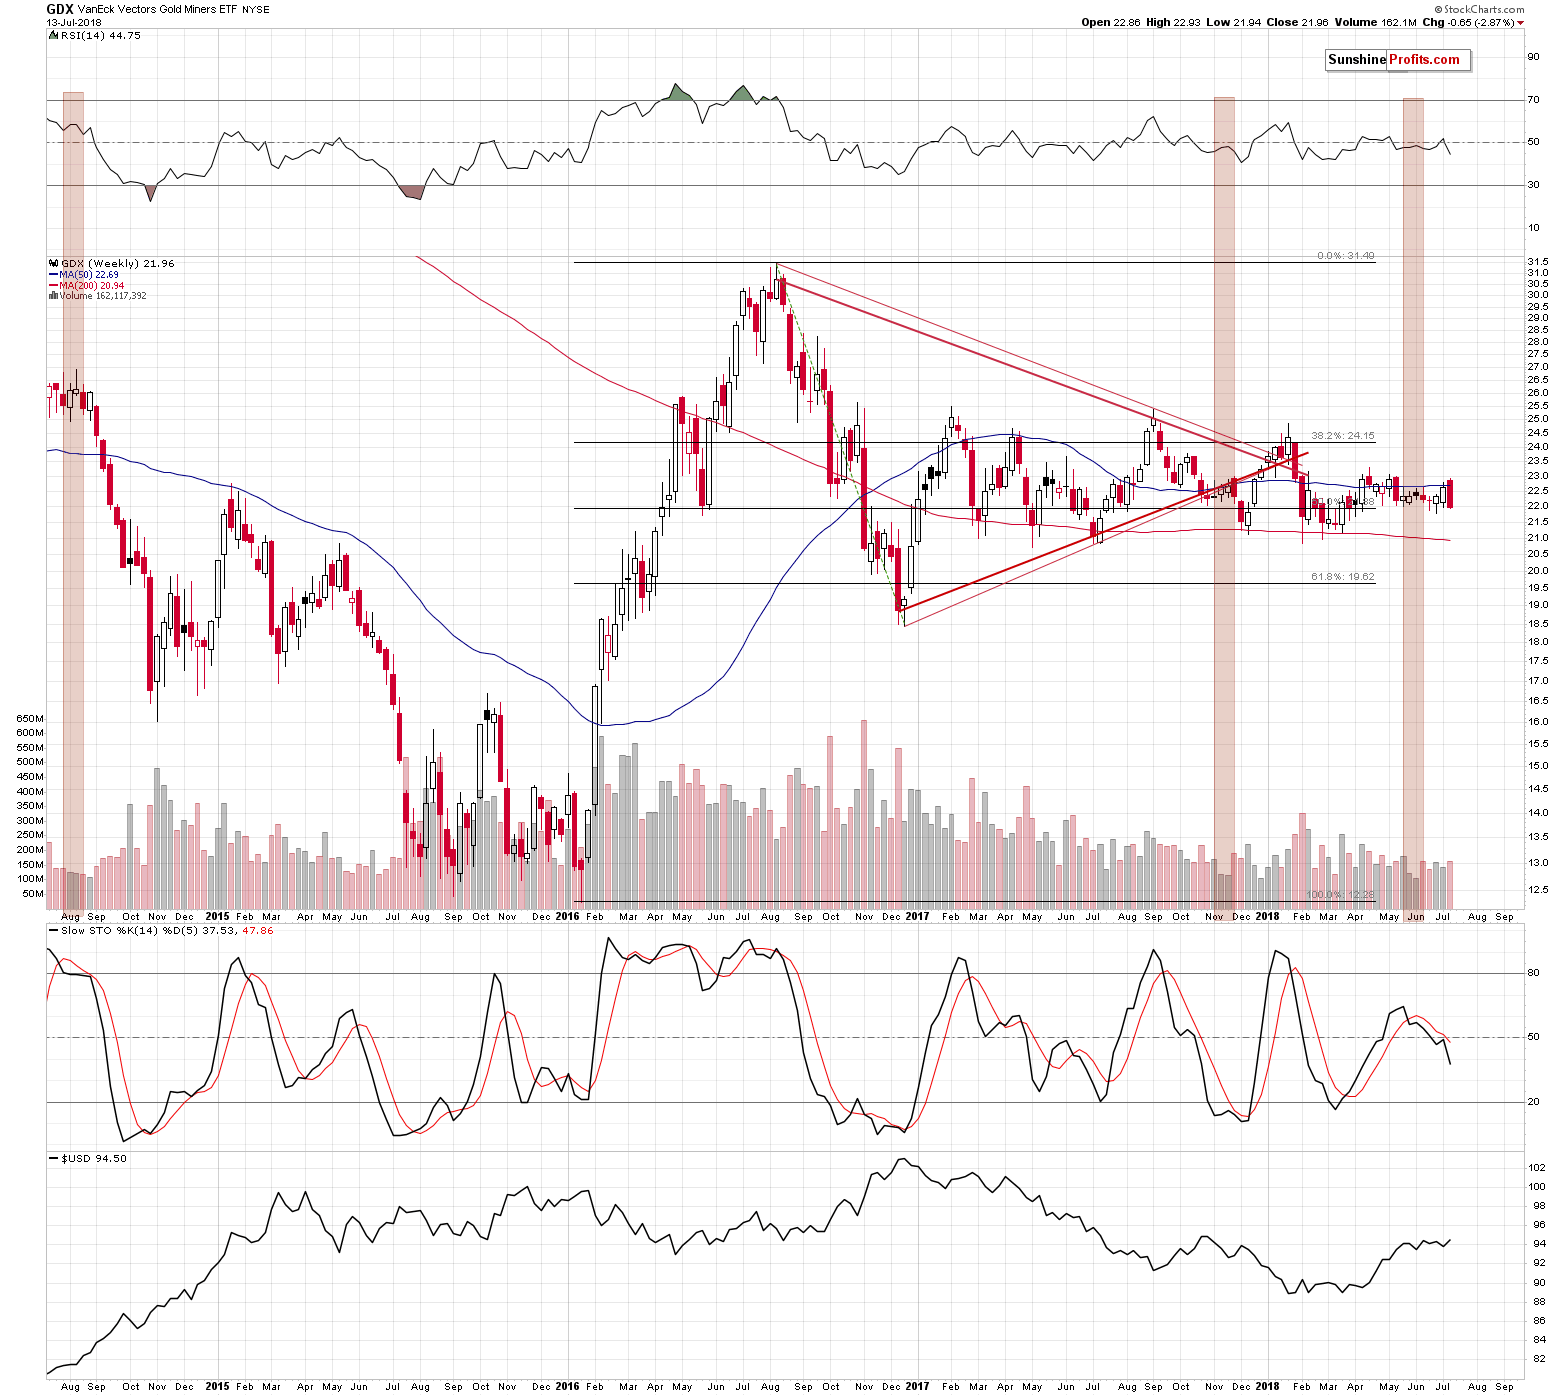
Once again, the title says it all. We just saw a bearish engulfing pattern based on weekly price changes which – just as its name says – has bearish implications. This pattern is seen when a small bullish candlestick is entirely covered (including the intraday extremes) by the following big bearish candlestick. That’s exactly what we saw and since the volume was biggest in 4 weeks, this signal appears to be confirmed.
The implications are bearish for the following weeks, but at the same time the above doesn’t rule out a small (few days) corrective upswing. In other words, if we see a yen-based corrective upswing today or tomorrow, it’s not going to invalidate the bearish implications of the above chart.
Summary
Summing up, the outlook for the precious metals is extremely bearish for the following weeks and months, but it’s not particularly clear for the next few days. We could see a small move higher or a pause, but it doesn’t seem that adjusting positions based on this possibility is a good idea. The reason for a possible corrective upswing is the verification of a major breakdown in the Japanese yen and despite the possibility of triggering a small upswing in the PMs, this breakdown has very bearish implications for the PM sector going forward.
The extra-large short positions in gold, silver, and mining stocks are definitely justified from the risk to reward point of view. The profits on the short position that we opened just a few days ago increased further on Friday and it’s likely that they will increase much more before this trade is over.
As always, we’ll keep you – our subscribers – informed.
To summarize:
Trading capital (supplementary part of the portfolio; our opinion): Full short positions (200% of the full position) in gold, silver and mining stocks are justified from the risk/reward perspective with the following stop-loss orders and initial target price levels:
- Gold: initial target price: $1,142; stop-loss: $1,272; initial target price for the DGLD ETN: $63.96; stop-loss for the DGLD ETN $46.38
- Silver: initial target price: $14.42; stop-loss: $16.46; initial target price for the DSLV ETN: $32.97; stop-loss for the DSLV ETN $24.07
- Mining stocks (price levels for the GDX ETF): initial target price: $19.12; stop-loss: $23.64; initial target price for the DUST ETF: $37.97; stop-loss for the DUST ETF $20.87
In case one wants to bet on junior mining stocks' prices (we do not suggest doing so – we think senior mining stocks are more predictable in the case of short-term trades – but if one wants to do it anyway, we provide the details), here are the stop-loss details and initial target prices:
- GDXJ ETF: initial target price: $28.10; stop-loss: $34.82
- JDST ETF: initial target price: $74.83 stop-loss: $42.78
Long-term capital (core part of the portfolio; our opinion): No positions (in other words: cash)
Insurance capital (core part of the portfolio; our opinion): Full position
Important Details for New Subscribers
Whether you already subscribed or not, we encourage you to find out how to make the most of our alerts and read our replies to the most common alert-and-gold-trading-related-questions.
Please note that the in the trading section we describe the situation for the day that the alert is posted. In other words, it we are writing about a speculative position, it means that it is up-to-date on the day it was posted. We are also featuring the initial target prices, so that you can decide whether keeping a position on a given day is something that is in tune with your approach (some moves are too small for medium-term traders and some might appear too big for day-traders).
Plus, you might want to read why our stop-loss orders are usually relatively far from the current price.
Please note that a full position doesn’t mean using all of the capital for a given trade. You will find details on our thoughts on gold portfolio structuring in the Key Insights section on our website.
As a reminder – “initial target price” means exactly that – an “initial” one, it’s not a price level at which we suggest closing positions. If this becomes the case (like it did in the previous trade) we will refer to these levels as levels of exit orders (exactly as we’ve done previously). Stop-loss levels, however, are naturally not “initial”, but something that, in our opinion, might be entered as an order.
Since it is impossible to synchronize target prices and stop-loss levels for all the ETFs and ETNs with the main markets that we provide these levels for (gold, silver and mining stocks – the GDX ETF), the stop-loss levels and target prices for other ETNs and ETF (among other: UGLD, DGLD, USLV, DSLV, NUGT, DUST, JNUG, JDST) are provided as supplementary, and not as “final”. This means that if a stop-loss or a target level is reached for any of the “additional instruments” (DGLD for instance), but not for the “main instrument” (gold in this case), we will view positions in both gold and DGLD as still open and the stop-loss for DGLD would have to be moved lower. On the other hand, if gold moves to a stop-loss level but DGLD doesn’t, then we will view both positions (in gold and DGLD) as closed. In other words, since it’s not possible to be 100% certain that each related instrument moves to a given level when the underlying instrument does, we can’t provide levels that would be binding. The levels that we do provide are our best estimate of the levels that will correspond to the levels in the underlying assets, but it will be the underlying assets that one will need to focus on regarding the signs pointing to closing a given position or keeping it open. We might adjust the levels in the “additional instruments” without adjusting the levels in the “main instruments”, which will simply mean that we have improved our estimation of these levels, not that we changed our outlook on the markets. We are already working on a tool that would update these levels on a daily basis for the most popular ETFs, ETNs and individual mining stocks.
Our preferred ways to invest in and to trade gold along with the reasoning can be found in the how to buy gold section. Additionally, our preferred ETFs and ETNs can be found in our Gold & Silver ETF Ranking.
As a reminder, Gold & Silver Trading Alerts are posted before or on each trading day (we usually post them before the opening bell, but we don't promise doing that each day). If there's anything urgent, we will send you an additional small alert before posting the main one.
=====
Latest Free Trading Alerts:
Friday's trading session was pretty much uneventful, as investors awaited the coming quarterly earnings releases season. The S&P 500 index continued to trade along the level of 2,800 and it's closer to breaking higher towards the late January record high. There are still two possible medium-term scenarios, but bulls are happier than a week ago.
=====
Hand-picked precious-metals-related links:
PRECIOUS-Gold prices buoyed by weaker dollar, Asian stocks
=====
In other news:
Stocks rise as earning expectations beat China growth fears
Dog Days of Summer Are Here as Traders Give Up Acting on Tweets
Powell to Cross Political Minefield as Trade War Clouds Outlook
Fed is ready to keep raising rates, but faces a list of uncertainties
China's second-quarter GDP growth softens as trade row stirs concerns on outlook
Has Greece finally escaped the grip of catastrophe?
=====
Thank you.
Sincerely,
Przemyslaw Radomski, CFA
Founder, Editor-in-chief, Gold & Silver Fund Manager
Gold & Silver Trading Alerts
Forex Trading Alerts
Oil Investment Updates
Oil Trading Alerts

