

Briefly: in our opinion, full (250% of the regular position size) speculative short positions in mining stocks are justified from the risk/reward point of view at the moment of publishing this Alert.
Let's start today's analysis with a quick look at what you're probably wondering about - gold's relationship with the USD Index, and - most of all - why didn't gold slide, given that the USDX reversed on Friday.
The reply to this question has been visible on the below chart for days.
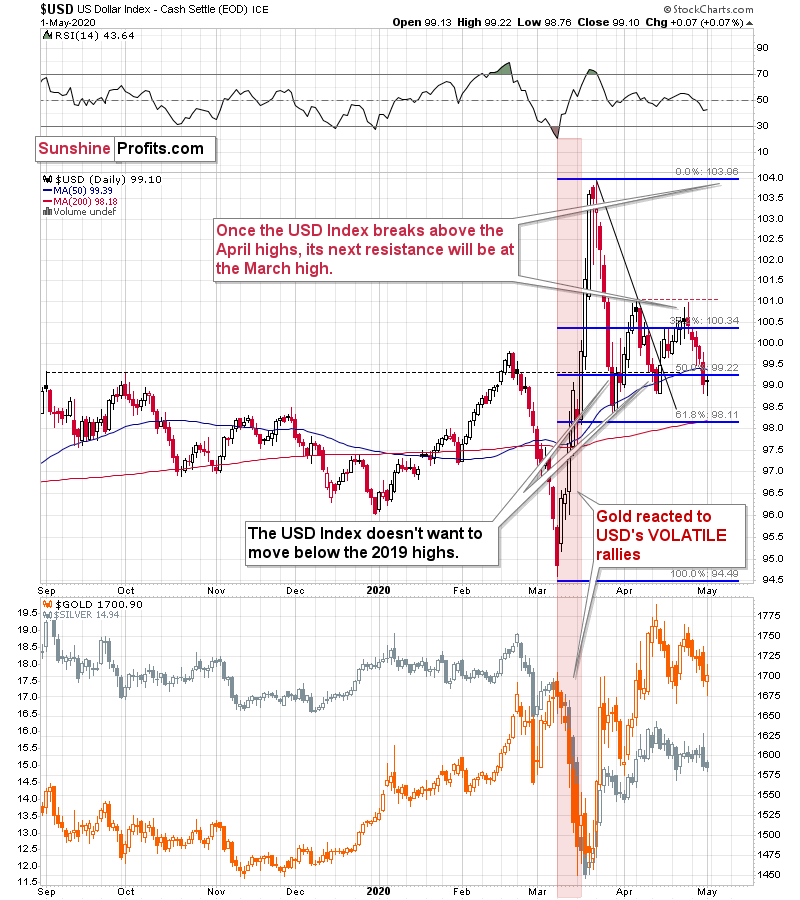
Namely, back in March, gold reacted strongly - and declined profoundly - when the USD index rallied sharply. Smaller upswings didn't trigger substantial reactions. Friday's upswing was tiny - just 0.07% - which means that one shouldn't expect gold to plunge. Therefore, the lack of gold's volatile decline is not particularly bullish or bearish - it's more or less normal.
Fundamentally speaking, one might be wondering what could trigger the demand for the US dollar to skyrocket. So far our answer was that plunging stock markets around the world, and investors' flight to safety would be what makes the US (& world reserve) currency to rally profoundly. And that remains up-to-date, but we would like to add one more important factor. This factor is that the Covid-19 cases are rising rapidly in countries that previously were barely on the radar screen in that regard.
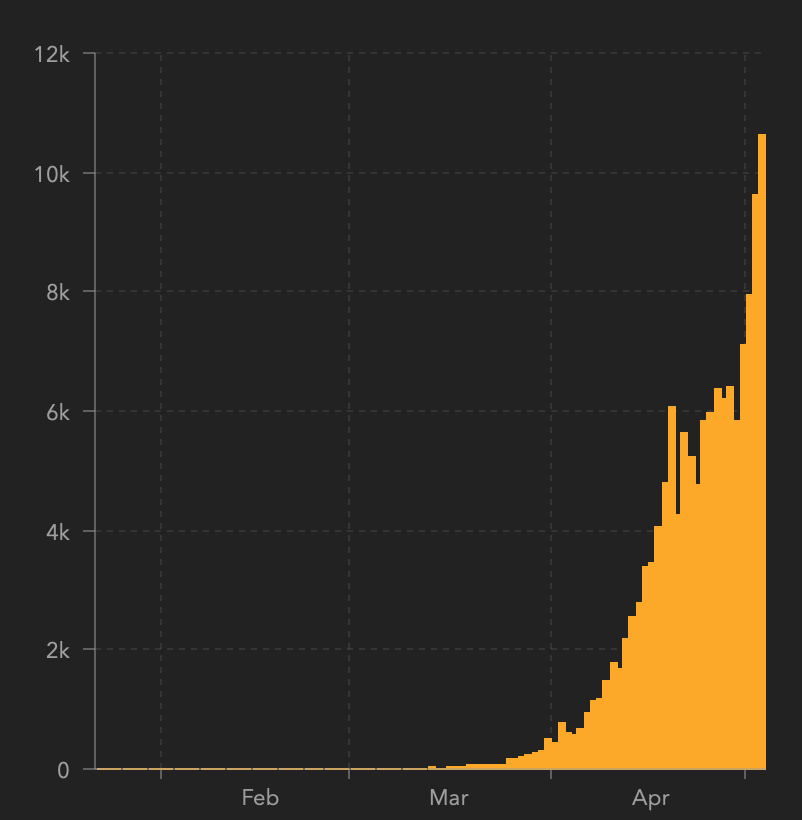
Corona Updates from Around the World
The new daily cases in Russia just exceeded 10k.
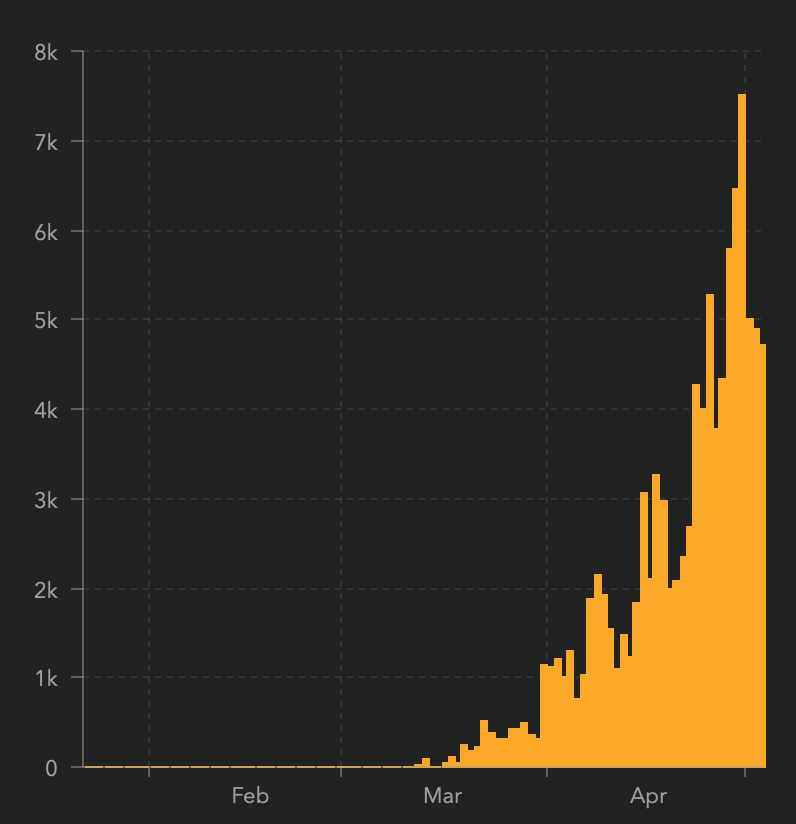
They were just above 7k in Brazil, and they are now hovering at about 5k per day.
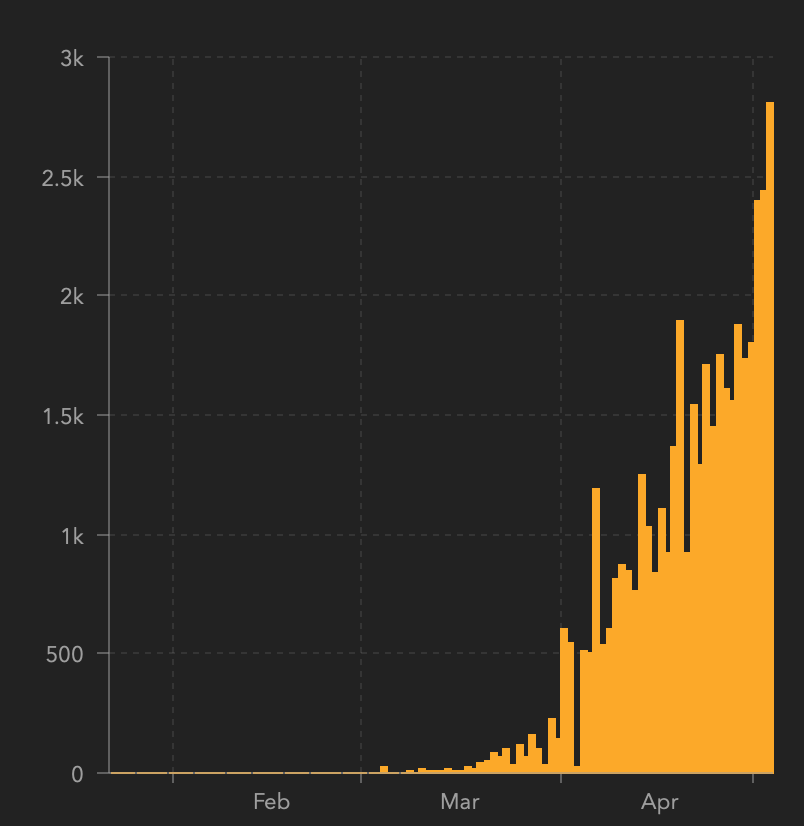
In India, the latest daily increase was just above 2.5k, but we see constant growth in this number.
The numbers from China are extremely low, but it seems doubtful if they can be viewed as realistic.
These countries together constitute the BRIC group, and their impact on gold was supposed to be positive in general, as their growth should have undermined the demand for the US dollar. Of course, that's just a general link and one of long-term nature. What is more interesting from the short-term point of view, is that the situation in these countries is - overall - getting worse at a greater speed than the situation is getting worse (in some states, it's actually getting better) in the US. This suggests that in the short run, we could expect the opposite to the general tendency to take place. People could be buying the USD not because it's perfect, or that the situation in the US is, but because it is better (or improving more smoothly) than what they see domestically.
Taking both factors into account, we have a strong case for a strong dollar. And initially gold - and the rest of the precious metals sector - is likely to respond to it with lower prices. The slide is unlikely to extend for more than a few weeks, but it's still very likely to happen.
Stocks, Ratios and PMs
The situation in the stock market is likely to impact the PMs negatively as well, at least in the short term. We previously commented on the S&P 500 performance in the following way:
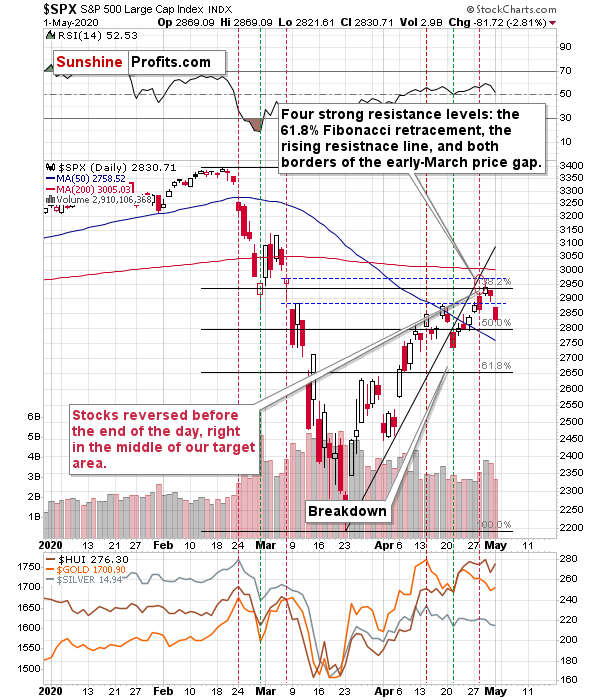
During yesterday's session the S&P 500 closed very insignificantly above the 61.8% Fibonacci retracement level and below the upper border of the price gap. In other words, it moved and reversed practically right in the middle of our target area. We wrote that the outlook was bearish, but that "on a very short-term basis, anything could happen in the stock market" and it did - we saw another daily move higher.
The final of the individual strong resistance levels is based on the upper border of the price gap. This gap is at 2972 in case of the S&P 500 index, and at 2964 in case of the S&P 500 index futures. Whether this level is "taken out" or not will depend on the closing price that we see. So far, the S&P futures moved to 2964 today and then they declined - trading at 2948 at the moment of writing these words.
If stocks decline from here, they will confirm the strength of the above-mentioned resistance and at the same time, they would likely invalidate the tiny breakout above the 61.8% Fibonacci retracement, which could trigger technical selling. This would likely have a very negative impact on the mining stock sector.
That's exactly what happened. Stocks invalidated their breakout above the 61.8% Fibonacci retracement, and they have indeed triggered technical selling. The S&P 500 opened the day with a bearish price gap and then declined during the day, pretty much as it had declined on March 6th. On March 9th (which was the next trading day), the S&P 500 once again opened with a bearish price gap. We are writing this a few hours before the markets open in the US, but the S&P 500 futures are currently down by 0.8%, which increases the odds that we'll see a repeat of what we saw on March 9th - another daily move lower. That was more or less when the really volatile part of the decline in the precious metals market started.
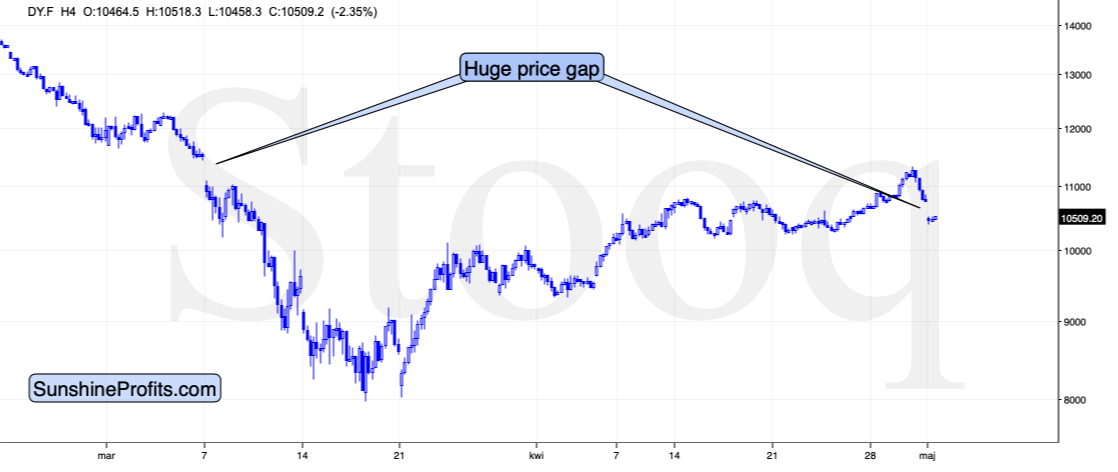
Besides, we have a confirmation of this very bearish analogy also from other stock markets. For example, the German stock market is trading about 3% lower today.
The similarity to the first half of March is uncanny.
Speaking of similarities to the first half of March, silver is providing us with an excellent confirmation.
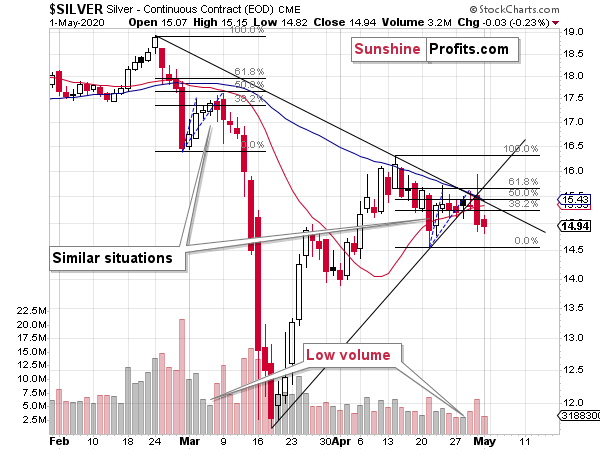
On Thursday, the white metal reversed and declined profoundly on relatively big volume - just like it had done on March 9th. In the following two trading days, it had moved lower, but just slightly so. This time, there was - so far - just one trading day after the big daily decline, and during this day, silver declined rather insignificantly - just like it did in early March. If the analogy is near-perfect, we'll see some back and forth trading also today without a bigger change (a lower close is likely, though). And then...
In March, silver then plunged, and it took the white metals just three more days to slide below $12 from about $17.
As the starting point for silver for now is approximately $15, could it slide to about $10 in just 3 trading days? While we don't want to say that it's inevitable, we do want to stress that the outlook is very bearish, and that a major decline is likely just ahead, even if silver doesn't slide again as fast.
... It seems quite possible, though.
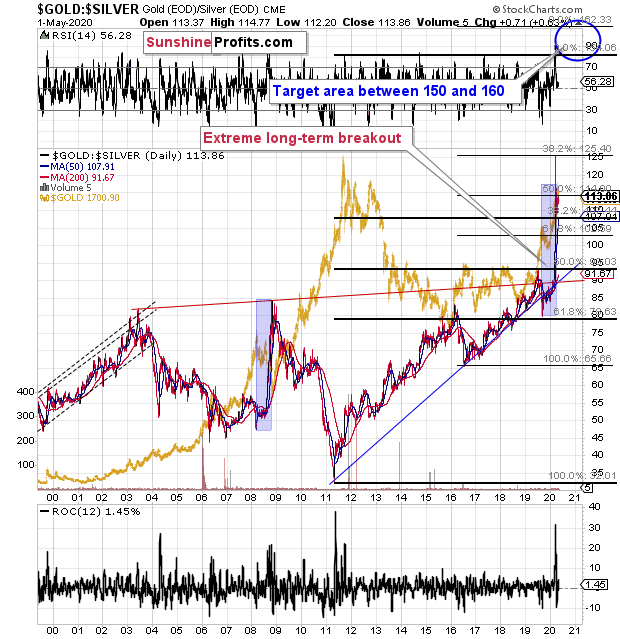
On a side note, please keep in mind that (as we have been indicating, and as most of our colleagues didn't) despite the recent upswing in gold, and the general stock market, the gold to silver ratio didn't invalidate its breakout above the 100 level. Conversely, the breakout was confirmed, and it means that we should expect even higher values of the ratio. And yes, the values near 150 level are quite possible.
Having said that, let's turn to senior miners and their proxy - the GDX ETF.
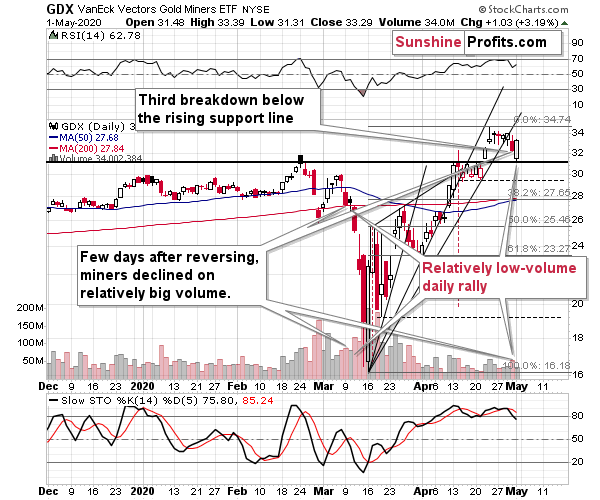
The breakdown below the rising support line took place on relatively big volume, which makes it more bearish, especially since the same thing (decline on relatively big volume) started the most volatile decline in early March. Then - in March, after the relatively-big-volume decline - we saw a relatively-low-volume upswing. And we saw exactly the same thing on Friday!
The daily move higher might seem encouraging, but it is only so until one realizes that the GDX ETF is actually repeating its early-March performance. It serves as a confirmation of the analogy that we've been describing in the previous days and in today's analysis.
The support levels that could trigger quick pauses or rebounds along the way lower, are based on the previous lows, and the Fibonacci retracement levels. The $23 - $23.30 area seems particularly likely to trigger a rebound as that's where the April bottom and the 61.8% Fibonacci retracement level coincide. Please note that the April lows would also be in tune with our very short-term target for gold - slightly below $1,600, which is also very close to gold's early-April lows.
The next particularly strong support level is at the March lows.
From the Readers' Mailbag
Q: What is the price of Gold that will invalidate your projection that gold will decline to sub 1400 ? It is getting hard to ignore the uptrend in Gold?
A: We're not ignoring the uptrend in gold, silver, or mining stocks. In fact, our chart analysis includes the trendlines. It also includes the description of the breakdowns below these trend lines, which indicate that the next short-term move is down.
As far as the "price of gold that would invalidated our projection for gold" - meaning effectively the stop-loss level, is concerned, we wrote about it on April 24th. Quoting:
Of course, the precious metals might show exceptional strength here and the outlook might prove to be bullish even without a big slide in the precious metals prices, but... We don't see strong evidence toward that just yet. And no, a daily rally or few days of higher prices is not enough of a proof.
The confirmations, verifications etc. are used for a reason. This reason is that there are multiple forces that aim to pull the market in their direction and sometimes they succeed in doing that for a short while, despite the real trend. This means that acting on the very initial signs could be misleading.
On the other hand, we (well, not just us - everyone) have the risk of being affected by the confirmation bias and myopic loss aversion - meaning ignoring the new information, especially if taking them into account would mean realizing a loss (either materially, or psychologically - the mind hates that in particular and will play many tricks on one, just to avoid it). Why would the myopic loss aversion be a big problem? Because from the financial point of view it's far better to take even five minor (say 1%) losses than just one huge (20%) one. However, that's not how the mind works - it will "understand" the above as five losses vs. one loss and will aim for the latter outcome - which is actually the worse outcome.
One of the ways one can protect themselves against the above biases in the markets is a stop-loss order. It's good for many cases, especially in case of day trading, when one is barely able to take into account anything more than the price itself. However, the more one zooms out to the long term, and the more non-direct-price factors are taken into account (and the more important they are), the less useful a stop-loss becomes.
If you bought a house with the aim to collecting rent payments and creating a semi-passive income, would you decide (upfront) on selling that house as soon as its value dropped by 5% below the purchase price? Or 10%? The odds are, you wouldn't, because the decision was made based on many other factors than just the price itself.
That's similar to our current outlook and trading positions. We are taking myriads of factors into account, not just the price of gold or the price of silver, or the prices of mining stocks. We're looking at their inter-market relationships, we're looking at how they perform combined with how they performed during situations that were most similar to what we see right now (2008), and we check how they react to details that should make them move in one way or another (USDX, general stock market).
The outlook is not determined by just the price of gold itself - it's determined by many of the above. If this is the case, why should a certain price by itself change the outlook? That's why in case of this trade, we don't have stop-loss levels in place. We could set it (say to $2,100 in gold), but it would be so ridiculously high that it would be useless. Actually, it would be counter-productive, because it gives the false impression that we would actually wait until gold moved that high to change the outlook, whereas the point is that it is not the price itself that we will be looking at, at least not only at it. If gold declined or rallied by $1, while the USD Index soared by 4 index points, our outlook would change immediately. Not because of the price, but because of the relative strength. If silver declined to $8, while gold moved just $50 lower, we would probably change the outlook as well as it would imply a major target being (almost) reached while gold was showing strength.
We moved to always providing the stop-loss orders against our approach (described above) as it was requested by our subscribers. And it turned out that our profitability was much better when our approach toward exiting trades matched our approach to the market in general. It was requested, as most trading strategies are based only on the price and as such, price would be something that invalidates a given outlook. In our case, it's not like that, as our approach is more sophisticated. That's why we will use the stop-loss orders when breaking them would really invalidate the outlook and when it's close enough to be useful instead of being misleading. At this time, it would be misleading, not helpful. Of course, one is free to use these techniques in their trades, especially if one combines our research with some other techniques.
For now, the USD Index is likely to rally, and the stock market is likely to decline. The way gold, silver, and mining stocks respond to the decisive moves in these markets will tell us a lot about the outlook. If PMs and miners' respond in a bullish way (by not declining significantly, or even rallying), the outlook might become bullish. If PMs and miners' respond like they responded in March, or similarly, it will be clear that the outlook has been bearish all along.
For now, the technical signs don't point to strength in the precious metals sector that would be decisive enough to tell us that the situation is bullish, and at the same time we see signs that point to a high probability of situation in which the PMs and miners will have the chance to either plunge, or show their strength by declining just a little. In both cases, exiting short positions now, seems pre-mature.
Q: You mentioned that the decline in the metals will take 1 - 3 weeks. Using GDX as the reference, would you consider its high on 4/23 as the starting point or the day before the decline started on 4/29?
A: We specifically used a relatively wide range of 1-3 weeks so as not to commit to a certain date. As such, it doesn't really matter if you start at 4/23 or 4/29, or even today. The outlook is unlikely to change until the USD Index soars and we see a proof that gold is reversing despite substantial strength in the USDX. In our view, it's very likely that the final bottom will take place this month, quite likely within 1-3 weeks from now. But if we don't see the above-mentioned strength in gold and the clear buying signal before that, and instead we'll see more bearish confirmations while the decline is steady, or we see sideways movement, this period would be prolonged.
Q: What is/will be the mechanism for the price of gold to rise?
It appears to have been increasing since last March, when the Fed first dropped interest rates. And again now in response to the economic slowdown caused by Covid-19.
But where's the inflation that should be resulting?
And because all countries are easing monetary policies, aren't the currencies maintaining their relative values?
If inflation remains low, or there's the prospect of deflation, what will trigger the massive increase in the price of gold you're predicting?
And if the gold price does start to decline here, what mechanism is going to reverse that price direction?
A: (reply provided by Arkadiusz Sieron, PhD - author of our free Fundamental Gold Reports, and premium Gold Market Overview reports):
Good questions. I wrote more about inflation versus deflation in the context of the gold market in the Fundamental Gold Report published on April 16, 2020. My take is that the coronavirus crisis is initially deflationary, so we are likely to see lower inflation rates in the near future. However, this crisis might be more inflationary than the Great Recession because of three factors:
1) the supply disruptions;
2) the quicker recovery (although not V-shaped);
3) the faster growth in the bank credit and money supply. In the long run, there is also a possibility that inflation will be triggered to solve the problem of high public debts.
Anyway, in the linked text I showed that although gold likes high and accelerating inflation, it can also shine without it. There are more fundamental drivers of gold prices than inflation. For example, the real interest rates are a very important factor. This crisis has already lowered them, and we think that the rates will remain ultra low, which should support the gold prices. Other factors are the recession, risk-aversion (given the fragility of our financial system, we could see more turbulences on the way) and high public debt, which could lead to depreciation of fiat currencies (the exchange rates between them may not change, but the price of gold in these currencies should go up) and higher inflation.
On the other hand, there are also some downside risk for gold. If the antiviral drug or the vaccine is developed quickly, it can spur fast economic recovery and create downward pressure on the gold prices. However, many epidemiologists say that vaccine will not be widely distributed earlier than in 2021. And we are of the opinion that social distancing will stay with us for some time, which will prevent a vigorous recovery. Anyway, the ultra-low real interest rates and excessive indebtedness will remain anyway, so that's one more point for the fundamental outlook for gold to be positive.
Summary
Summing up, the outlook for the precious metals market remains very bearish for the next few weeks. The general stock market seems to have already topped, which means that the bearish pressure on the mining stocks and silver is now likely to be much bigger than it was in April. Gold declined along with the USD Index last week, which has very bearish implications for the precious metals sector as gold is likely to truly plunge once the USD Index finally rallies in a meaningful way. And it is likely to rally in a meaningful way, not only because of purely technical reasons, but also because of plunging stock markets, and demand coming from the BRIC (and other) countries.
The above is particularly likely given multiple signs pointing to self-similarity between the current situation and what we saw in early March.
After the sell-off (that takes gold below $1,400), we expect the precious metals to rally significantly. The final decline might take as little as 1-3 weeks, so it's important to stay alert to any changes.
Most importantly - stay healthy and safe. We made a lot of money on the March decline and the subsequent rebound (it's initial part) price moves (and we'll likely make much more in the following weeks and months), but you have to be healthy to really enjoy the results.
By the way, we recently opened a possibility to extend one's subscription for a year with a 10% discount in the yearly subscription fee (the profits that you took have probably covered decades of subscription fees...). It also applies to our All-Inclusive Package (if you didn't know - we just made huge gains shorting crude oil and are also making money on both the decline and temporary rebound in stocks). The boring time in the PMs is over and the time to pay close attention to the market is here - it might be a good idea to secure more access while saving 10% at the same time.
Important: If your subscription got renewed recently, but you'd like to secure more access at a discount - please let us know, we'll make sure that the discount applies right away, while it's still active. Moreover, please note that you can secure more access than a year - if you secured a yearly access, and add more years to your subscription, each following year will be rewarded with an additional 10% discount (20% discount total). We would apply this discount manually - please contact us for details.
Secure more access at a discount.
As always, we'll keep you - our subscribers - informed.
To summarize:
Trading capital (supplementary part of the portfolio; our opinion): Full speculative short positions (250% of the full position) in mining stocks is justified from the risk to reward point of view with the following binding exit profit-take price levels:
Senior mining stocks (price levels for the GDX ETF): binding profit-take exit price: $10.32; stop-loss: none (the volatility is too big to justify a SL order in case of this particular trade); binding profit-take level for the DUST ETF: $231.75; stop-loss for the DUST ETF: none (the volatility is too big to justify a SL order in case of this particular trade)
Junior mining stocks (price levels for the GDXJ ETF): binding profit-take exit price: $9.57; stop-loss: none (the volatility is too big to justify a SL order in case of this particular trade); binding profit-take level for the JDST ETF: $284.25; stop-loss for the JDST ETF: none (the volatility is too big to justify a SL order in case of this particular trade)
For-your-information targets (our opinion; we continue to think that mining stocks are the preferred way of taking advantage of the upcoming price move, but if for whatever reason one wants / has to use silver or gold for this trade, we are providing the details anyway. In our view, silver has greater potential than gold does):
Silver futures downside profit-take exit price: $8.58 (the downside potential for silver is significant, but likely not as big as the one in the mining stocks)
Gold futures downside profit-take exit price: $1,382 (the target for gold is least clear; it might drop to even $1,170 or so; the downside potential for gold is significant, but likely not as big as the one in the mining stocks or silver)
Long-term capital (core part of the portfolio; our opinion): No positions (in other words: cash)
Insurance capital (core part of the portfolio; our opinion): Full position
Whether you already subscribed or not, we encourage you to find out how to make the most of our alerts and read our replies to the most common alert-and-gold-trading-related-questions.
Please note that the in the trading section we describe the situation for the day that the alert is posted. In other words, it we are writing about a speculative position, it means that it is up-to-date on the day it was posted. We are also featuring the initial target prices, so that you can decide whether keeping a position on a given day is something that is in tune with your approach (some moves are too small for medium-term traders and some might appear too big for day-traders).
Plus, you might want to read why our stop-loss orders are usually relatively far from the current price.
Please note that a full position doesn't mean using all of the capital for a given trade. You will find details on our thoughts on gold portfolio structuring in the Key Insights section on our website.
As a reminder - "initial target price" means exactly that - an "initial" one, it's not a price level at which we suggest closing positions. If this becomes the case (like it did in the previous trade) we will refer to these levels as levels of exit orders (exactly as we've done previously). Stop-loss levels, however, are naturally not "initial", but something that, in our opinion, might be entered as an order.
Since it is impossible to synchronize target prices and stop-loss levels for all the ETFs and ETNs with the main markets that we provide these levels for (gold, silver and mining stocks - the GDX ETF), the stop-loss levels and target prices for other ETNs and ETF (among other: UGLD, DGLD, USLV, DSLV, NUGT, DUST, JNUG, JDST) are provided as supplementary, and not as "final". This means that if a stop-loss or a target level is reached for any of the "additional instruments" (DGLD for instance), but not for the "main instrument" (gold in this case), we will view positions in both gold and DGLD as still open and the stop-loss for DGLD would have to be moved lower. On the other hand, if gold moves to a stop-loss level but DGLD doesn't, then we will view both positions (in gold and DGLD) as closed. In other words, since it's not possible to be 100% certain that each related instrument moves to a given level when the underlying instrument does, we can't provide levels that would be binding. The levels that we do provide are our best estimate of the levels that will correspond to the levels in the underlying assets, but it will be the underlying assets that one will need to focus on regarding the signs pointing to closing a given position or keeping it open. We might adjust the levels in the "additional instruments" without adjusting the levels in the "main instruments", which will simply mean that we have improved our estimation of these levels, not that we changed our outlook on the markets. We are already working on a tool that would update these levels on a daily basis for the most popular ETFs, ETNs and individual mining stocks.
Our preferred ways to invest in and to trade gold along with the reasoning can be found in the how to buy gold section. Additionally, our preferred ETFs and ETNs can be found in our Gold & Silver ETF Ranking.
As a reminder, Gold & Silver Trading Alerts are posted before or on each trading day (we usually post them before the opening bell, but we don't promise doing that each day). If there's anything urgent, we will send you an additional small alert before posting the main one.
Thank you.
Sincerely,
Przemyslaw Radomski, CFA
Editor-in-chief, Gold & Silver Fund Manager

