

Briefly: in our opinion, full (300% of the regular position size) speculative short positions in junior mining stocks are justified from the risk/reward point of view at the moment of publishing this Alert.
In yesterday’s intraday Gold & Silver Trading Alert, I wrote the following:
Gold, silver, and mining stocks moved to new yearly highs in today’s trading, without any other major moves in the markets. So far, the session is only halfway completed, so quite a lot can still change. If we saw a decline in the second half of the session, the day would become a reversal, and it would be bearish. If we see the daily close in the GDX ETF at the current price levels, then… It will still not be bullish at this time (!).
Huge daily rallies on big volume (and it’s likely that today’s volume will prove to be big) in mining stocks (GDX) are what tends to take place at the end of a given short-term upswing or close to it. For example, we saw that on Nov. 10, 2021, Aug. 27, 2021, Jul. 29, 2021, and May 17, 2021.
Also, please note that zig-zag patterns are quite common form that corrections take place, at least in case of the mining stocks. Another way to call this pattern is an ABC pattern. The bottom that we saw in mid-December could have been the start of the A rally, then we saw the B decline in early January, and what we see now could be the C rally, and perhaps the final part thereof.
Still, most importantly, please keep in mind the examples when the big daily rallies on strong volume were good shorting, not buying opportunities. It’s rather unlikely that right now – AFTER the daily rally – we are at a favorable moment to go long or to close the short positions. It seems much more likely that we are in a situation where short positions are much more justified from the risk to reward point of view.
The reason I’m quoting this Alert is that it remains up-to-date. The GDX ETF ended the day visibly above the previous yearly highs, and the volume that accompanied yesterday’s sizable decline was indeed huge.
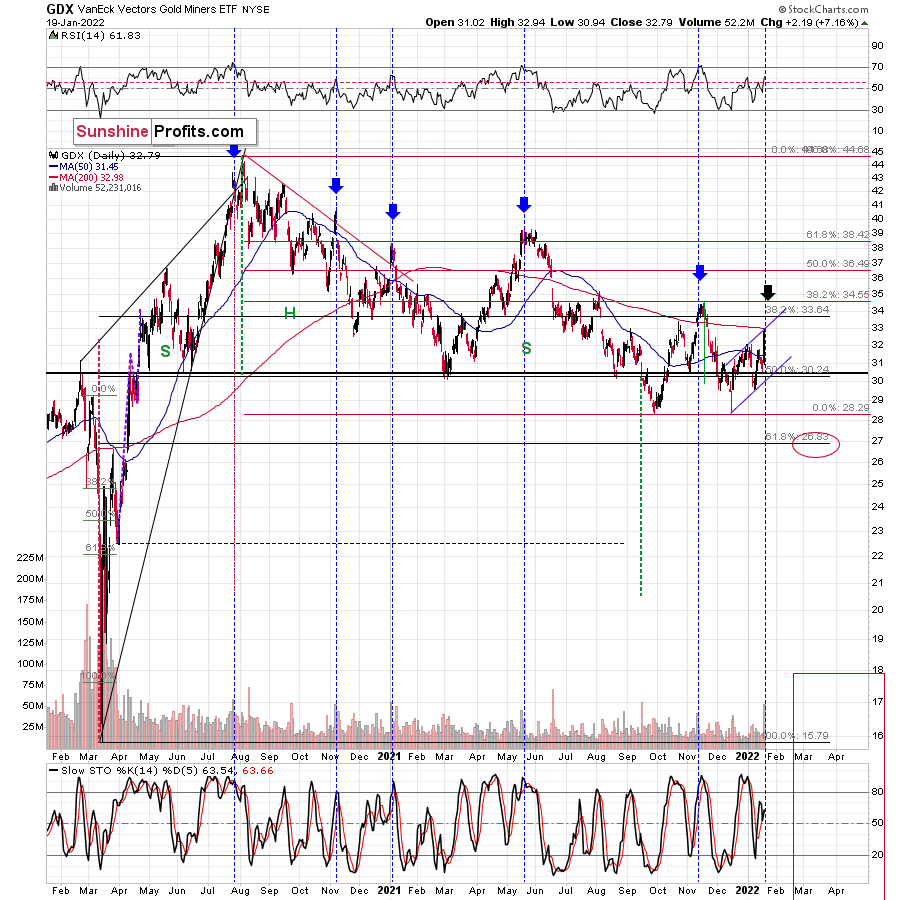
What does it mean? Well, it means that, from the technical point of view, we just saw another day similar to the other days that I marked with vertical dashed lines and black arrows. Those days were either right at the tops or not far from them. As much as yesterday’s (7%!) rally looks bullish, taking a look at the situation from a broad perspective provides us with the opposite – bearish – implications.
The zig-zag scenario is being realized as well. The GDX ETF moved to the upper border of the rising trend channel. Also, doesn’t it remind you of something? Hint: it happened at a similar time of the year.
Yes, the current price/volume action is similar to what we saw in early 2021. The RSI was above 60, a short-term rally that was preceded by a bigger decline, and a strong daily rally on huge volume at the end of the corrective rally. We’ve seen it all now, and we saw it in early 2021.
In the case of gold, we see something similar, but this time, the rally is visibly smaller.
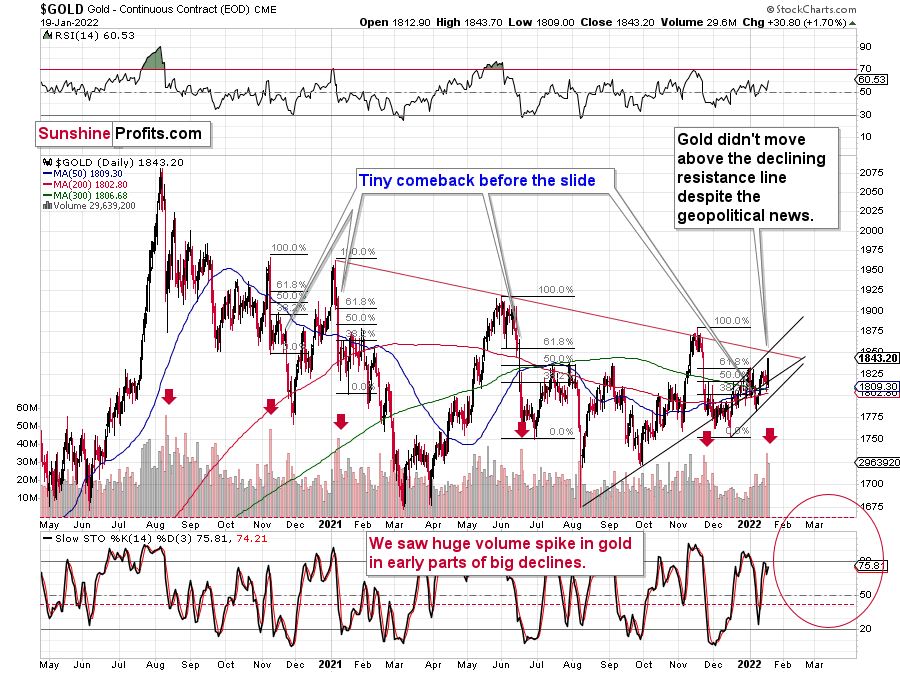
The volume is still significant, and the implications, theoretically, should be bearish. Here’s what I wrote on that yesterday:
The rally above the 2021 highs in bond yields might have come as a shock to many investors, and they might not have been sure how to react or what to make of it. It might also have been the “buy the rumor, sell the fact” type of reaction. Either way, it seems to me that we’ll have to wait a few days and see how it plays out once the dust settles.
The volume that we saw yesterday was huge. After a period of relatively average volume, we saw this huge volume spike. I marked the previous cases with red arrows. In those cases, such volume accompanied gold’s sizable declines. This time, the volume spike accompanied a $4.10 decline, which might appear perplexing.
Fortunately, gold is not the only market that we can analyze, and – as it’s often the case – context provides us with details that help to make sense of what really happened. Let’s check the key supplemental factor – silver’s price action.
Gold didn’t decline, but it moved higher instead. Why could that be?
Tensions around Ukraine have just supposedly escalated, which likely made people buy the precious metals (and mining stocks) as safe havens against possible geopolitical turmoil – against any possible annexations, war, and similar.
I put “supposedly” in bold because, in my opinion, that’s simply not true. It’s possible (everything is, right?), but just because something is possible, doesn’t make it likely.
In particular, in the case of the above-mentioned supposed “news” about greatly increased tensions, I don’t think that the safe-haven buying frenzy is justified. It’s not, and there are several good reasons for it.
Here are two articles on that:
https://www.theguardian.com/world/2022/jan/19/russia-could-act-against-ukraine-at-any-moment-says-us
https://www.bbc.com/news/world-europe-60048395
First of all, let’s consider the source of the information. The source was the White House, which is on the other side of the planet. It’s the very opposite of the “local source”, or a source that would not be biased by any agenda (here: political). It’s also the same source that provided misleading and/or unverified information many times in the past.
Remember when gold soared on the U.S.-based news that an Iranian ship attacked some other ship, “likely” leading to conflict? Nothing like that was confirmed by any other source. Remember Iraq’s weapons of mass destruction (before the U.S. invasion of that country) that were never found? I don’t mean to say that everything coming from the U.S. government and White House is “bad”. I’m saying that the information on which the market rallied is of relatively low quality when it comes to objectivity, and thus that market’s reaction was way too big, compared to what makes sense.
One of the article titles says “Russia could act against Ukraine ‘at any moment’, says US” and the other says “Ukraine tension: Blinken says Russia could attack at short notice”. Please note that while they both make it sound like it’s something “very likely” or that it’s likely to happen “soon”, the text actually says nothing like that. Just because Russia “could” attack, doesn’t mean that it’s likely. It could attack any day, and it could have attacked on any day in the past decades. If something is just 0.0000001% likely, then it’s still true that it “could” happen and both titles would be true. However, it doesn’t mean that acting on it is justified!
One of our Team Members is located in Ukraine (the source doesn’t get any more “local” and objective than this), and he had this to say about the current situation:
“I’m sure that Russia, with its current president Putin, will never take massive military action against Ukraine. If they wanted to do it, they could probably “capture” all of Ukraine in a matter of weeks, if not days. It would be a quick fix for the problem of uniting what has always been one country (Kiev, the ancient capital of Russia, and Kharkov, where I was born, had always been in one state with Moscow until thirty years ago).
However, such military action would create the ideologema of a “captured” Ukraine for future generations of Ukrainian nationalists, resulting in the obvious intent to liberate the “captured” state. It might also make countries that are currently friendly to Russia perceive it as an aggressor. Those are just a couple of the many reasons why it’s obvious to me that such military action is not going to happen any time soon.
The news/propaganda might be targeted toward forming the public opinion on joining Ukraine to NATO, painting the picture of “Russian aggression” or other social engineering purposes”.
Moreover, please note that what we’re discussing here is a geopolitical event, and such events are likely to have only a temporary impact on the precious metals prices. We wrote about that in our Dictionary section, and you’ll find more details there.
All in all, we saw a rally, but it’s unlikely to be the start of a bigger rally. Instead, it’s likely that what we saw was either the final part of the corrective upswing that started in mid-December, 2021, or it’s close to the final part of the corrective upswing. Either way, I think that the short position in the junior mining stocks remains justified from the risk-to-reward point of view.
Having said that, let’s take a look at the markets from a more monetary point of view. Unlike geopolitical events, these are the details that are likely to trigger lasting trends.
Same Story, Different Day
With the general stock market rolling over and investors looking for somewhere to park their cash, suddenly, the PMs are in style once again. For context, financial markets behave a lot like the weather. Sometimes it’s sunny, sometimes it rains. However, sometimes investors misinterpret the season altogether. With gold, silver, and mining stocks rallying as if another round of QE was announced, their glowing price action contrasts with a cloudy fundamental reality.
To explain, when rapid daily price movements occur, they usually happen for two reasons:
- Algorithms pile in when momentum is present.
- Short-covering sends prices even higher.
Thus, while the price action on Jan. 19 may seem profoundly bullish, it’s important to remember that these are short-term phenomena. For example, short-sellers often cover their positions when sentiment shifts and then re-enter soon after. Similarly, momentum investors are mainly short-term traders. As such, they’re usually in, out, and then off to the next target.
In contrast, the medium-term fundamentals that support lower precious metals prices continue to intensify. While the USD Index remains in consolidation mode, higher interest rates, and, more importantly, higher real interest rates, should leave the PMs confronting harsh realities over the next few months.
Please see below:
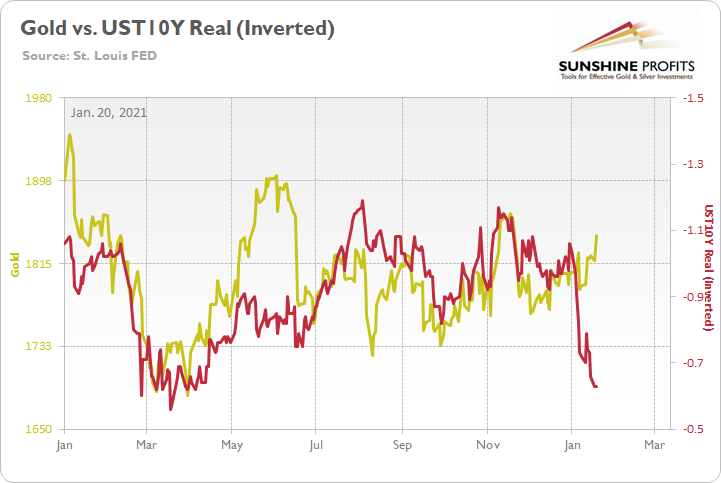
To explain, the gold line above tracks the London Bullion Market Association (LBMA) Gold Price since January 2021, while the red line above tracks the inverted U.S. 10-Year real yield. For context, inverted means that the latter’s scale is flipped upside down, and that a rising red line represents a falling U.S. 10-Year real yield, and a falling red line represents a rising U.S. 10-Year real yield.
If you analyze the relationship, you can see that the former’s performance is closely linked to the latter’s performance. Moreover, if you focus your attention on the right side of the chart, you can see that the U.S. 10-Year real yield has risen precipitously in 2022 and is gunning for its March 2021 lows (depicted by the red line moving sharply lower). As a result, the reading implies an LBMA Gold Price of roughly $1,690.
Likewise, notice what happened in May and early June when gold attempted to run away from the U.S. 10-Year real yield. Initially, it took off like a rocket, only to come back down to earth and reconnect with the red line soon after. As a result, while the yellow metal attempts to defy fundamental and historical precedent, is this time really different?
For context, momentum investors don’t care about any of this. Their time horizons are so short that they plan to hit the exits when sentiment shifts. In essence, it’s almost like the GameStop frenzy that we witnessed in 2021. However, with the stock now down materially from its 2021 highs, it’s an example of how fundamentals often reign supreme over the medium term.
To that point, gold is also attempting to decouple from the copper/U.S. 10-Year Treasury yield ratio. For context, the pair has had a correlation of 0.93 since 2017 (weekly closing prices).
Please see below:
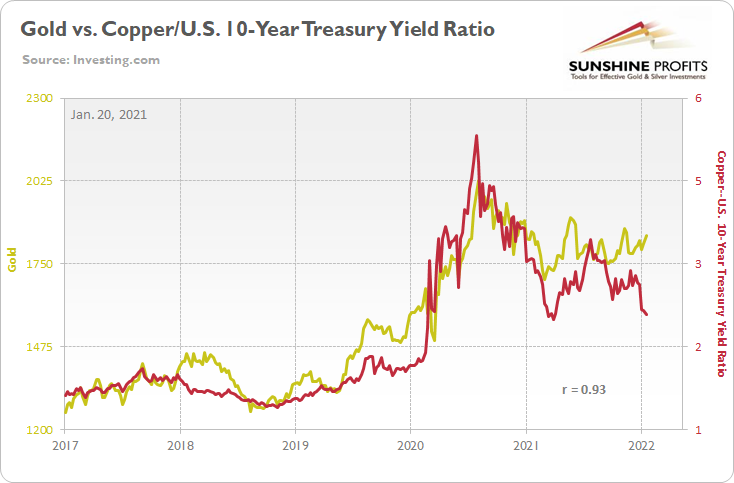
To explain, the red line above tracks the copper/U.S. 10-Year Treasury yield ratio, while the gold line above tracks the gold futures price. If you analyze the relationship, you can see that the latter doesn’t get too far without the former. Moreover, if you scan throughout the chart, you can see that gold has attempted to run away from the ratio on many occasions. However, whether it was early 2018, early 2019, late 2019, or several occasions in 2021, the two lines reconnected once again.
As a result, either the copper/U.S. 10-Year Treasury yield ratio is poised to move materially higher or gold is poised to move materially lower. With the Fed hawked up and the ratio sending the same message as the U.S. 10-Year real yield, gold is attempting to do something that it hasn’t done successfully in more than five years.
To that point, a scatterplot can better visualize the magnitude of gold’s relative overvaluation. With the outperformance near a five-year high, the bulls’ daily goring likely has the yellow metal living on borrowed time.
Please see below:
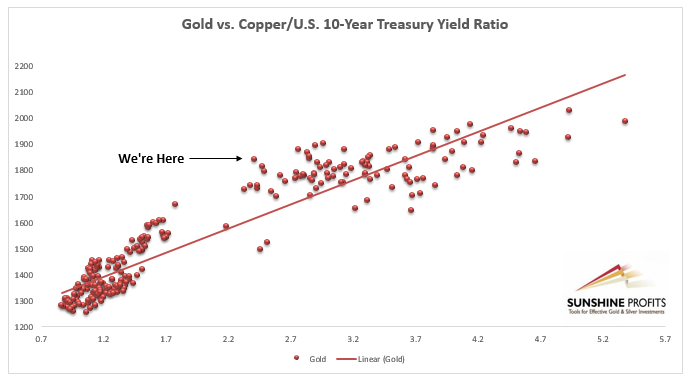
To explain, the scatterplot above visualizes the linear relationship between gold and the copper/U.S. 10-Year Treasury yield ratio since 2017 (weekly closing prices). Again, the correlation during that timeframe is 0.93. For context, the gold futures price is plotted on the y-axis, while the copper/U.S. 10-Year Treasury yield is plotted on the x-axis.
If you analyze the various dots, you can see that gold sometimes outperforms (the dots located above the trendline) and sometimes underperforms (the dots located below the trendline) the copper/U.S. 10-Year Treasury yield ratio. However, with a balanced mix of above-trend and below-trend performance, periods of over-optimism and over-pessimism usually don't last long.
To that point, if you focus your attention on the black arrow labeled "We're Here," it showcases how a gold futures price above $1,840 combined with a copper/U.S. 10-Year Treasury yield ratio below 2.41 is materially above the pair's linear trend. In fact, it's near the highest relative overvaluation in more than five years. Thus, with the law of gravity implying that what goes up must come down, are we entering a new paradigm? If history is any indication, the answer is: no.
Finally, while several of gold's fundamental metrics flash red, investors still underestimate the impact of the continued liquidity drain. For example, while the Fed should officially tighten monetary policy in the coming months, the central bank's daily reverse repurchase agreements (repos) hit an all-time high of more than $1.9 trillion on Dec. 31. Moreover, the facility hit a 2022 high of nearly $1.7 trillion on Jan. 19.
Please see below:
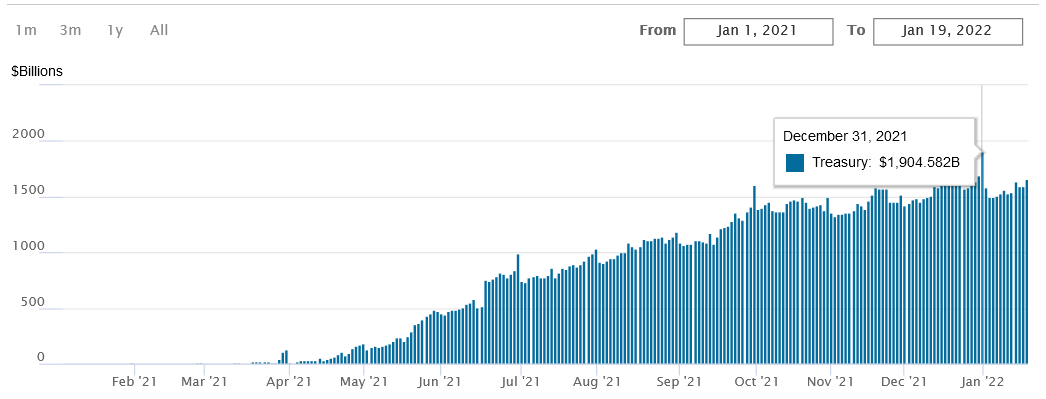 Source: New York Fed
To explain, a reverse repo occurs when an institution offloads cash to the Fed in exchange for a Treasury security (on an overnight or short-term basis). With U.S. financial institutions currently flooded with excess liquidity, they’re shipping cash to the Fed at an alarming rate. Moreover, with cash parked at the Fed, meaning a lower supply of U.S. dollars in circulation, the activity is fundamentally bullish for the USD Index. As a result, a confluence of indicators signals that the PMs are fighting a battle they’ve lost many times before.
The bottom line? While the price action on Jan. 19 would have you think we’re in a bull market, the reality is that many of the fundamental metrics that drive the PMs’ performance signal otherwise. While gold, silver, and mining stocks may find comfort in the USD Index’s recent consolidation, the greenback should seek higher ground over the medium term. Moreover, while higher nominal and real interest rates are currently being ignored, history has been unkind to those who assume that ‘this time is different.’
In conclusion, the PMs rallied on Jan. 19, and mining stocks were noticeable outperformers. However, since momentum begets momentum and short-covering often results in daily spikes, the price action is actually less bullish than it seems. Moreover, with the fundamentals signaling a much different outcome over the next few months, don’t be surprised if the algorithms break investors’ hearts over the medium term.
Overview of the Upcoming Part of the Decline
- It seems to me that the corrective upswing is over, and that gold, silver, and mining stocks are now likely to continue their medium-term decline.
- It seems that the first (bigger) stop for gold will be close to its previous 2021 lows, slightly below $1,700. Then it will likely correct a bit, but it’s unclear if I want to exit or reverse the current short position based on that – it depends on the number and the nature of the bullish indications that we get at that time.
- After the above-mentioned correction, we’re likely to see a powerful slide, perhaps close to the 2020 low ($1,450 - $1,500).
- If we see a situation where miners slide in a meaningful and volatile way while silver doesn’t (it just declines moderately), I plan to – once again – switch from short positions in miners to short positions in silver. At this time, it’s too early to say at what price levels this could take place, and if we get this kind of opportunity at all – perhaps with gold close to $1,600.
- I plan to exit all remaining short positions once gold shows substantial strength relative to the USD Index while the latter is still rallying. This may be the case with gold close to $1,350 - $1,400. I expect silver to fall the hardest in the final part of the move. This moment (when gold performs very strongly against the rallying USD and miners are strong relative to gold after its substantial decline) is likely to be the best entry point for long-term investments, in my view. This can also happen with gold close to $1,375, but at the moment it’s too early to say with certainty.
- As a confirmation for the above, I will use the (upcoming or perhaps we have already seen it?) top in the general stock market as the starting point for the three-month countdown. The reason is that after the 1929 top, gold miners declined for about three months after the general stock market started to slide. We also saw some confirmations of this theory based on the analogy to 2008. All in all, the precious metals sector is likely to bottom about three months after the general stock market tops.
- The above is based on the information available today, and it might change in the following days/weeks.
You will find my general overview of the outlook for gold on the chart below:
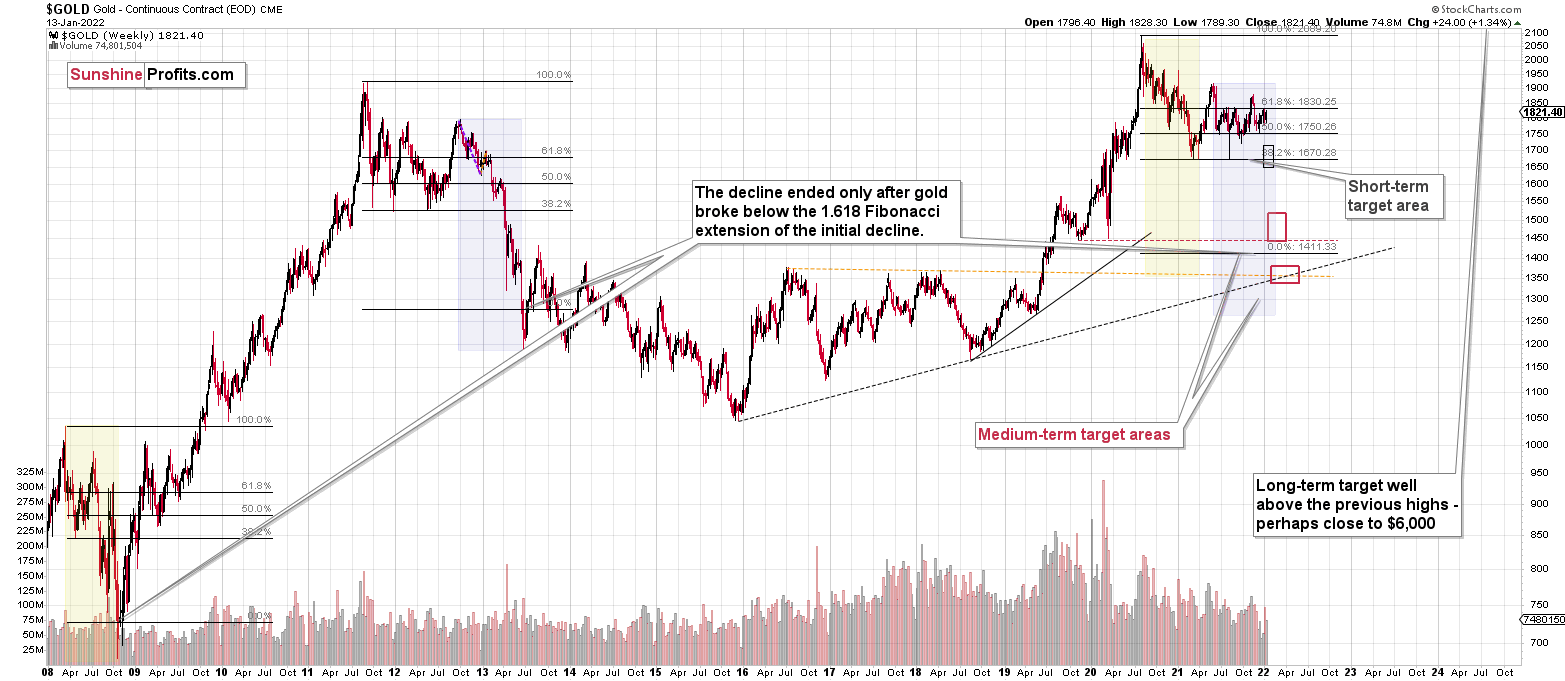
Please note that the above timing details are relatively broad and “for general overview only” – so that you know more or less what I think and how volatile I think the moves are likely to be – on an approximate basis. These time targets are not binding or clear enough for me to think that they should be used for purchasing options, warrants or similar instruments.
Letters to the Editor
Q: Thank you for the update. I have read that on Friday of this week, a huge number of options expire... How do you think it may affect the prices? Thanks for your kindness.
A: In general, option expirations can, at times, trigger some very short-term volatility. In fact, there are specific names for sessions where three or four types of options expire at the same time. These are called “triple witching” and “quadruple witching” sessions, respectively. That’s because really weird (magical?) things can happen with prices on those days. This Friday is not a “witching day”, but if there are more options expiring, it means that we have a greater chance of seeing some price moves in both directions on Friday. These moves are unlikely to be lasting, and as such, they are not that important from our point of view. They would be if we were engaged in day-trading. In this case, it would be best to stay out of the market altogether on a “witching day” or on a day when a huge number of options expire. Again, taking our trade into account, it doesn’t seem that important.
Summary
Summing up, it seems to me that the corrective upswing is over or very close to being over, and that gold, silver, and mining stocks are now likely to continue their medium-term decline (note: silver might continue to outperform and rally for a few more days – it’s practically impossible to tell how high it can go in the very near term, but either way, it’s likely that this decline will be reversed rather quickly).
Please note that if yesterday’s rally was indeed based on the supposedly increased tensions regarding Ukraine, then it’s likely that this rally is not going to be significant, and it might already be over. The “supposedly shocking” news already hit the market, and without any real follow-up (material) action, like Russian troops marching across the border with Ukraine, it seems that there’s nothing additional that markets could rally on. The market already “knows” that the tensions are very high and the chance for military conflict is high, regardless of whether that’s true or not. There’s not much more that can be said to increase that even further – only real action is likely to do it – and seeing such action is very unlikely in my view.
I continue to think that junior mining stocks are currently likely to decline the most out of all parts of the precious metals sector.
From the medium-term point of view, the key two long-term factors remain the analogy to 2013 in gold and the broad head and shoulders pattern in the HUI Index. They both suggest much lower prices ahead.
It seems that our profits from the short positions are going to become truly epic in the following months.
After the sell-off (that takes gold to about $1,350 - $1,500), I expect the precious metals to rally significantly. The final part of the decline might take as little as 1-5 weeks, so it's important to stay alert to any changes.
Most importantly, please stay healthy and safe. We made a lot of money last March and this March, and it seems that we’re about to make much more on the upcoming decline, but you have to be healthy to enjoy the results.
As always, we'll keep you - our subscribers - informed.
To summarize:
Trading capital (supplementary part of the portfolio; our opinion): Full speculative short positions (300% of the full position) in junior mining stocks are justified from the risk to reward point of view with the following binding exit profit-take price levels:
Mining stocks (price levels for the GDXJ ETF): binding profit-take exit price: $35.73; stop-loss: none (the volatility is too big to justify a stop-loss order in case of this particular trade)
Alternatively, if one seeks leverage, we’re providing the binding profit-take levels for the JDST (2x leveraged) and GDXD (3x leveraged – which is not suggested for most traders/investors due to the significant leverage). The binding profit-take level for the JDST: $16.18; stop-loss for the JDST: none (the volatility is too big to justify a SL order in case of this particular trade); binding profit-take level for the GDXD: $32.08; stop-loss for the GDXD: none (the volatility is too big to justify a SL order in case of this particular trade).
For-your-information targets (our opinion; we continue to think that mining stocks are the preferred way of taking advantage of the upcoming price move, but if for whatever reason one wants / has to use silver or gold for this trade, we are providing the details anyway.):
Silver futures downside profit-take exit price: $19.12
SLV profit-take exit price: $17.72
ZSL profit-take exit price: $41.38
Gold futures downside profit-take exit price: $1,683
HGD.TO – alternative (Canadian) inverse 2x leveraged gold stocks ETF – the upside profit-take exit price: $12.48
HZD.TO – alternative (Canadian) inverse 2x leveraged silver ETF – the upside profit-take exit price: $30.48
Long-term capital (core part of the portfolio; our opinion): No positions (in other words: cash
Insurance capital (core part of the portfolio; our opinion): Full position
Whether you already subscribed or not, we encourage you to find out how to make the most of our alerts and read our replies to the most common alert-and-gold-trading-related-questions.
Please note that we describe the situation for the day that the alert is posted in the trading section. In other words, if we are writing about a speculative position, it means that it is up-to-date on the day it was posted. We are also featuring the initial target prices to decide whether keeping a position on a given day is in tune with your approach (some moves are too small for medium-term traders, and some might appear too big for day-traders).
Additionally, you might want to read why our stop-loss orders are usually relatively far from the current price.
Please note that a full position doesn't mean using all of the capital for a given trade. You will find details on our thoughts on gold portfolio structuring in the Key Insights section on our website.
As a reminder - "initial target price" means exactly that - an "initial" one. It's not a price level at which we suggest closing positions. If this becomes the case (like it did in the previous trade), we will refer to these levels as levels of exit orders (exactly as we've done previously). Stop-loss levels, however, are naturally not "initial", but something that, in our opinion, might be entered as an order.
Since it is impossible to synchronize target prices and stop-loss levels for all the ETFs and ETNs with the main markets that we provide these levels for (gold, silver and mining stocks - the GDX ETF), the stop-loss levels and target prices for other ETNs and ETF (among other: UGL, GLL, AGQ, ZSL, NUGT, DUST, JNUG, JDST) are provided as supplementary, and not as "final". This means that if a stop-loss or a target level is reached for any of the "additional instruments" (GLL for instance), but not for the "main instrument" (gold in this case), we will view positions in both gold and GLL as still open and the stop-loss for GLL would have to be moved lower. On the other hand, if gold moves to a stop-loss level but GLL doesn't, then we will view both positions (in gold and GLL) as closed. In other words, since it's not possible to be 100% certain that each related instrument moves to a given level when the underlying instrument does, we can't provide levels that would be binding. The levels that we do provide are our best estimate of the levels that will correspond to the levels in the underlying assets, but it will be the underlying assets that one will need to focus on regarding the signs pointing to closing a given position or keeping it open. We might adjust the levels in the "additional instruments" without adjusting the levels in the "main instruments", which will simply mean that we have improved our estimation of these levels, not that we changed our outlook on the markets. We are already working on a tool that would update these levels daily for the most popular ETFs, ETNs and individual mining stocks.
Our preferred ways to invest in and to trade gold along with the reasoning can be found in the how to buy gold section. Furthermore, our preferred ETFs and ETNs can be found in our Gold & Silver ETF Ranking.
As a reminder, Gold & Silver Trading Alerts are posted before or on each trading day (we usually post them before the opening bell, but we don't promise doing that each day). If there's anything urgent, we will send you an additional small alert before posting the main one.
Thank you.
Przemyslaw Radomski, CFA
Founder, Editor-in-chief

