

Briefly: in our opinion, full (300% of the regular position size) speculative short positions in mining stocks are justified from the risk/reward point of view at the moment of publishing this Alert.
While I usually finish the analyses with the fundamental discussion and start with the technicals, it seems justified to switch the usual order today. The reason is that a large part of yesterday’s and today’s pre-market price moves could be attributed to yesterday’s FOMC (and the following press conference), while today’s moves could be attributed to the aftermath of the above, as well as to the tensions preceding today’s initial jobless claims numbers.
Look at Everything Powell Does
With Jerome Powell, Chairman of the U.S. Federal Reserve (FED), conducting his dovish orchestra on Jul. 28, the maestro did what he often does during FOMC press conferences. To explain, I wrote prior to the announcement:
While the PMs may record a short-term bounce – which often occurs following Powell’s pressers – lower lows are still likely to materialize in the coming months.
And with the man living up to his reputation at 2:30 p.m. ET, his predictability resulted in another example of ‘PMs up, USD Index down.’
Please see below:
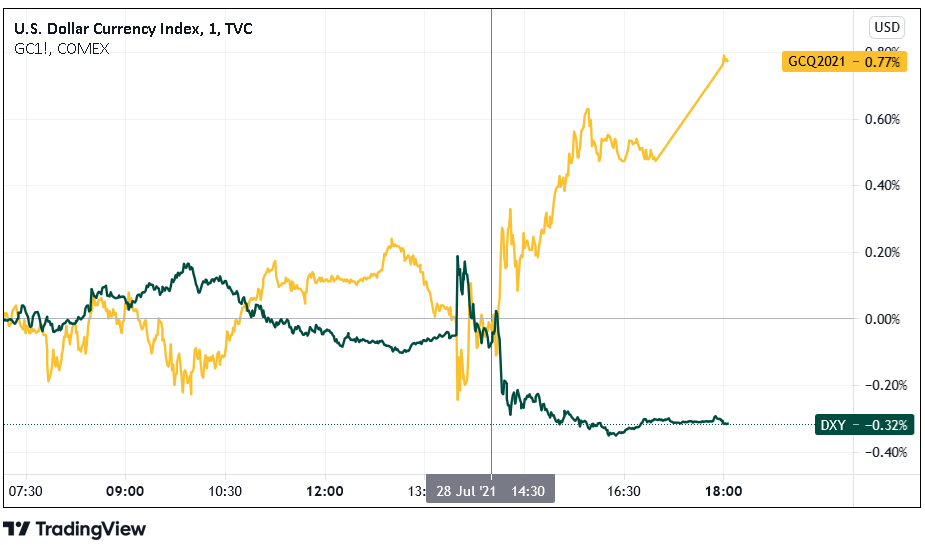
However, because the price action was largely expected, it’s likely another case of ‘been there, done that.’ For example, the PMs bounced and the USD Index sank following the last four FED meetings. However, after the sugar highs wore off and reality reemerged, the reversal of fortunes left the PMs on the wrong side of happiness. As a result, is this time really different?
To explain, we still expect the FED to announce its taper timeline by (or before) its Sep. 21/22 policy meeting. And while the surging reverse repurchase agreements (another $965 billion sold on Jul. 28) are the fundamental equivalent of a taper, if Powell utters the words, it will have a much greater effect on the financial markets. Thus, while the FED Chairman remained staunch in his dovish stance, signs of slippage are already emerging.
Please see below:
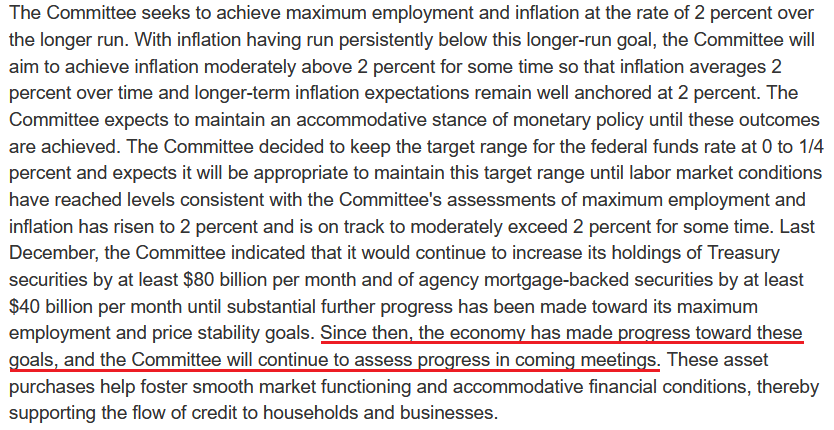 Source: U.S. FED
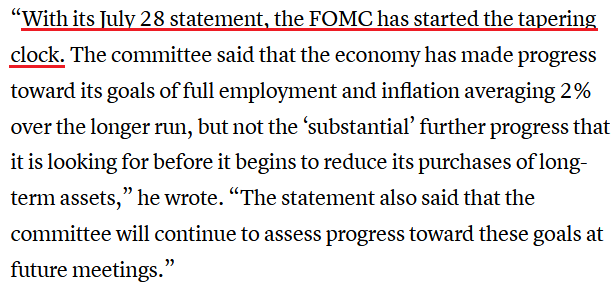
To explain, the FED released its standard statement on Jul. 28, and as expected, ~$120 billion per month of QE remains on autopilot. However, what differs from June and now is that the FED added the underlined section above. And while the FED parrots “substantial further progress” as its criteria for reducing its bond-buying program, the mere mention of “progress” is a subtly hawkish shift. For context, the identical paragraph below (released following the FOMC meeting in June) made no mention of progress whatsoever.
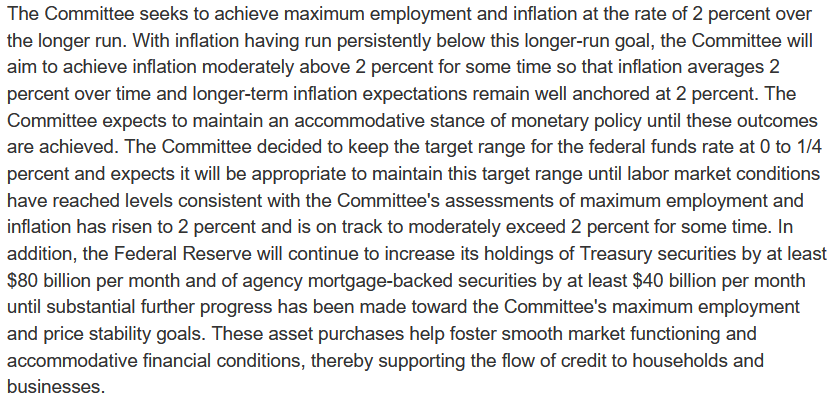 Source: U.S. FED
Furthermore, Powell said the following about the labor market during his press conference:
“I’d say we have some ground to cover on the labor market side. I think we’re some way away from having had substantial further progress toward the maximum employment goal.”
However, during his opening statement, he said:
“As with overall economic activity, conditions in the labor market have continued to improve. Demand for labor is very strong, and employment rose 850,000 in June, with the
leisure and hospitality sector continuing to post notable gains. Nonetheless, the labor market has ways to go. The unemployment rate in June was 5.9 percent, and this figure understates the shortfall in employment, particularly as participation in the labor market has not moved up from the low rates that have prevailed for most of the past year. Factors related to the pandemic, such as caregiving needs, ongoing fears of the virus, and unemployment insurance payments, appear to be weighing on employment growth. These factors should wane in coming months, leading to strong gains in employment.”
“In coming months?” That sounds a lot like Sep. 21/22…
In addition, another subtly hawkish shift was Powell’s nonchalant attitude toward the Delta variant. While the recent spike offered the perfect opportunity for him to use it as an excuse, the FED Chairman essentially brushed aside its potential impact.
He said:
“With successive waves of COVID over the past year and some months now, there has tended to be ... less in the way of economic implications from each wave, and we will see whether that is the case with the Delta variety.”
On top of that:
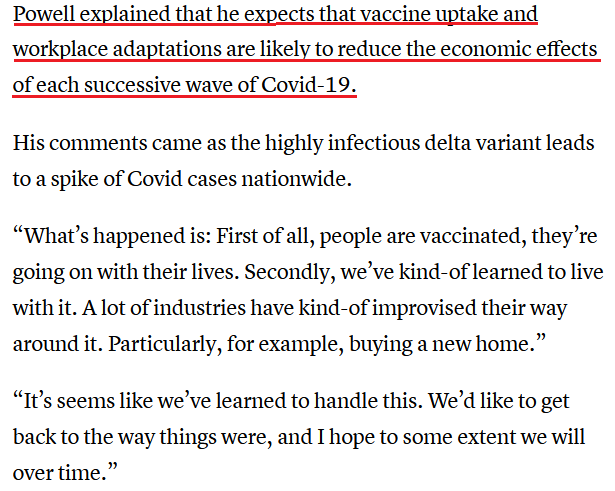 Source: CNBC
What’s more, Powell said the following about inflation during his opening statement:
“Inflation is running well above our 2% objective, and has been for a few months, and is expected to run certainly above our objective for a few months before we believe it’ll move back down toward our objective. The question of whether we’ve met that objective, formally, is really one for the committee to make.”
Could Inflation Overshoot the FED’s Forecasts?
Well, even though the FED increased its headline Personal Consumption Expenditures (PCE) Index forecast from a 2.4% year-over-year (YoY) rise to a 3.4% YoY rise on Jun. 16, another dose of reality could be forthcoming. For example, with the PCE Index data scheduled for release on Jul. 30, the YoY percentage change in the Commodity Producer Price Index (PPI) implies a print of roughly 3.75% to 4.25%.
Please see below:
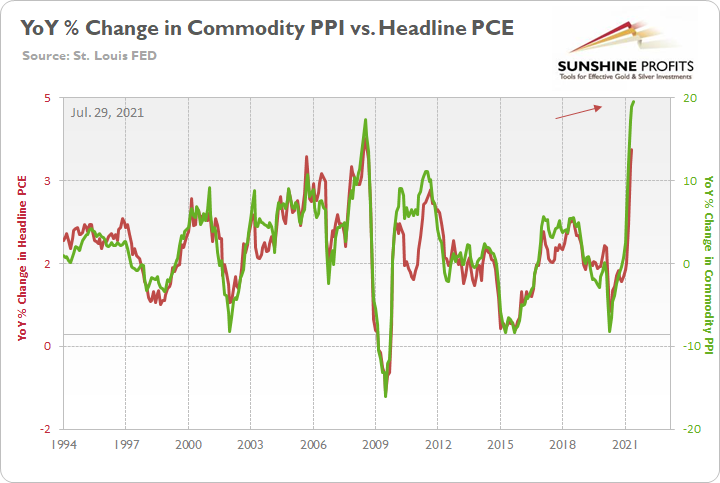
To explain, the green line above tracks the YoY percentage change in the commodity PPI, while the red line above tracks the YoY percentage change in the headline PCE Index. If you analyze the right side of the chart, you can see that a material gap is clearly visible. As a result, inflation is still likely to overshoot the FED’s already drastically upgraded forecast.
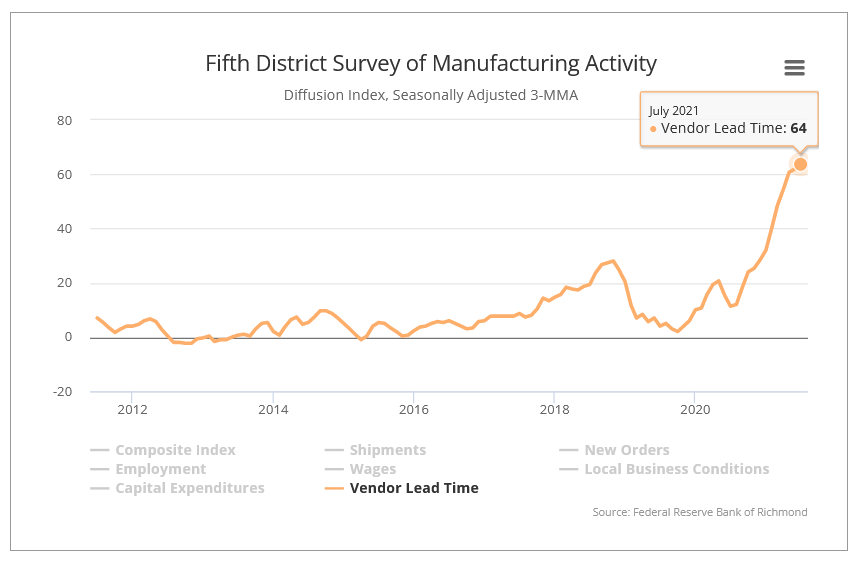
As further evidence, the Richmond FED released its Fifth District Survey of Manufacturing Activity on Jul. 27. And while the composite index rose from 26 in June to 27 in July (an all-time high), “the indexes for inventories of raw materials and of finished goods declined, as both of these indexes hit record lows, and vendor lead times continued to lengthen.” For context, low inventories and rising vendor lead times are extremely inflationary. Not only do they signal that businesses are running low on raw materials (meaning that producers have the pricing power), but shipping delays add upward pressure, as businesses have to compete for what little supply is available.
Please see below:
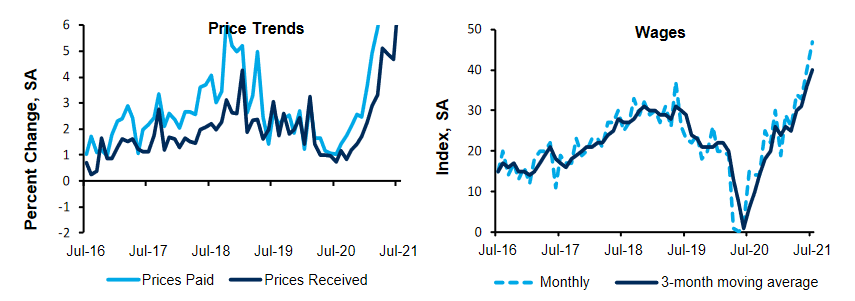
However, even more newsworthy, the Richmond FED’s price paid index, prices received index and its wages index all hit new all-time highs in July.
Please see below:
 Source: Richmond FED
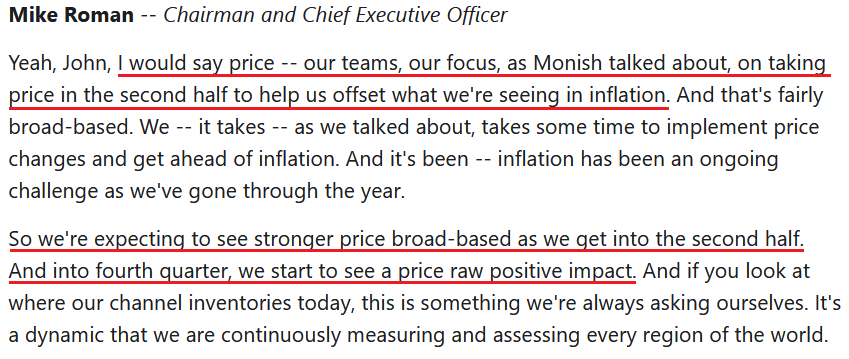
Finally, with 3M the latest company to sound the alarm on inflation, the American conglomerate is knee-deep in the chaos. For context, 3M manufactures products for all kinds of businesses, including those within the automotive, health care and consumer industries.
When asked during the company’s second-quarter earnings call on Jul. 27, “when do you expect commodity inflation to peak?” CFO Monish Patolawala said the following:
“So if you're asking specifically on commodities, I think it's a really hard one to call. For example, I would tell you, when we first gave our guide of $0.30 to $0.50, which has now been guided to $0.65 to $0.80, I would tell you, what we have seen is a broad-based increase in all commodities, whether it is polypropylene, chemical, resins we are seeing in our outsourced manufacturing goods, not just the labor cost but other commodities that go into that also getting passed. And then, logistics cost has continued to be a pretty strong headwind. Where that will peak, I think, in my view, and I may be wrong here, at some point, demand and supply need to start settling itself out.
There's a lot of demand. There's not enough supply based on all the V-shape recovery with the congestion in the ports, etc. And until that stabilizes itself out, I think we're going to continue to see inflation.”
And how is the company responding to the inflationary pressures?
 Source: 3M/The Motley Fool
The Clock Is Ticking…
Piecing it all together, what was Gus Faucher’s, Chief Economist at PNC, takeaway from the FOMC release?
 Source: CNBC
In conclusion, the PMs received a helping hand on Jul. 28, as Powell’s standard response increased investors’ optimism. However, with his words, the price action and the narrative sounding like a broken record, it’s important to remember that the medium-term implications remain intact. With inflation surging and the clock ticking toward the FED’s taper timeline announcement, the PMs are fighting an uphill battle. And because corrective upswings are expected within a medium-term downtrend, the PMs’ price action on Jul. 28 was likely nothing more.
It seems that the markets reacted to the Fed’s comments at their face value, but as the time goes by, the markets are likely to start reading between the lines and note what’s coming. And since the markets are forward-looking, yesterday’s price moves are likely to be reversed and it seems that we might not have to wait too long for that to happen.
In fact, if it was the case that yesterday’s price moves were triggered just by a very emotional reaction to the news, without their analysis, it could be the case that they will be reversed soon, as analysts will dig into the comments and report to investors soon, perhaps as soon as today – just like me, writing this text to you right now.
The implication of the above is that perhaps the price moves and their technical implications shouldn’t be taken at their face value just yet.
Having said that, let’s look at the technicals.
Rally or Fakeout?
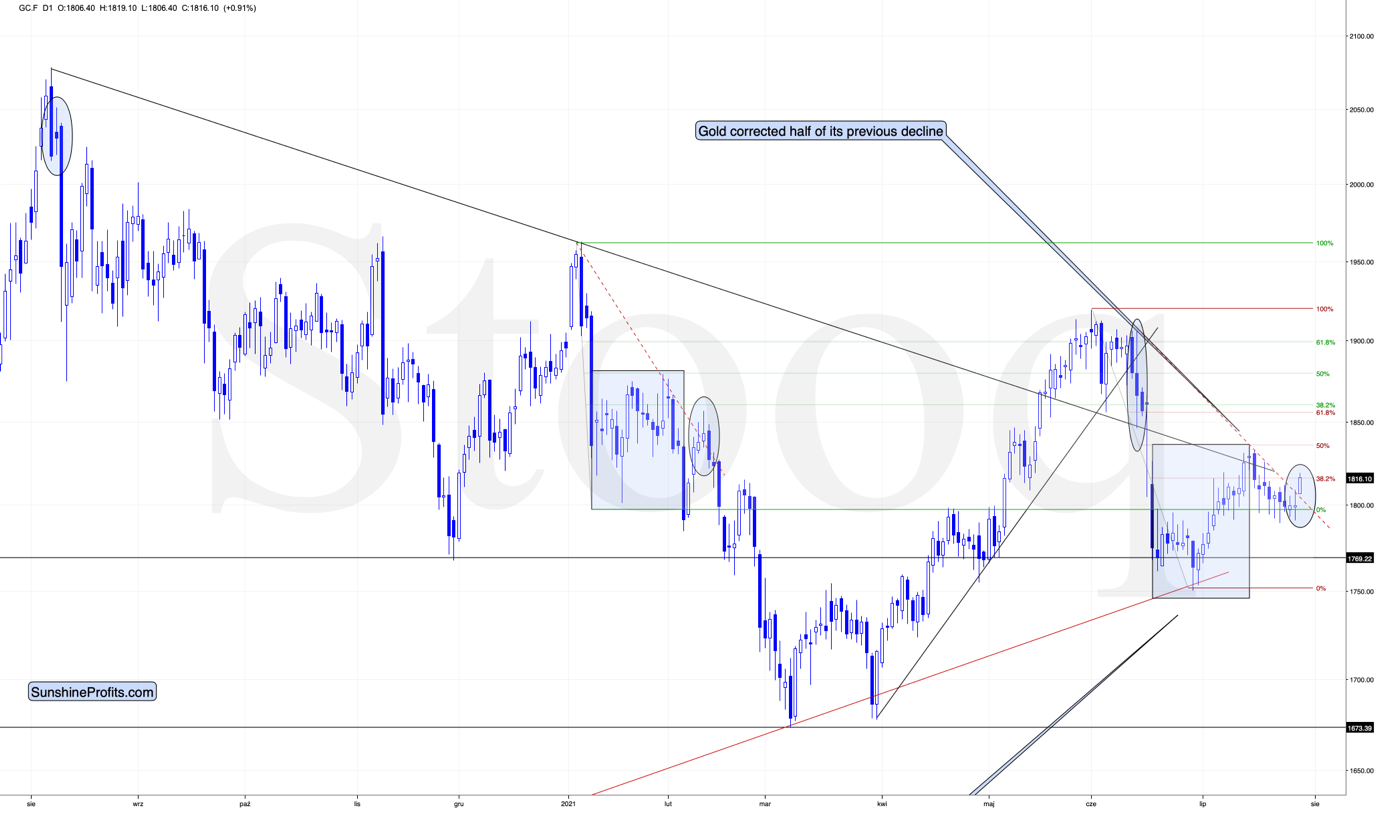
Gold rallied in today’s pre-market trading, and it even moved above its rising short-term resistance line that I marked with a red, dashed line. This seems bullish until you compare it with a very similar price action that took place in mid-February when gold was after a very similar pattern (sharp decline, corrective upswing to the 50% retracement, another move lower, and then another move up before sliding).
It seems that we are in the “then another move up” stage right now. Back in February, gold moved to about 38.2% Fibonacci retracement based on the initial big decline before turning south. Guess what price level gold is trying to breach today – the 38.2% Fibonacci retracement that’s based on the initial big decline.
Therefore, is gold’s rally really bullish right now? Or is it a fakeout just like what we saw in mid-February? The context provided by what happened yesterday suggests that the fakeout scenario is more probable.
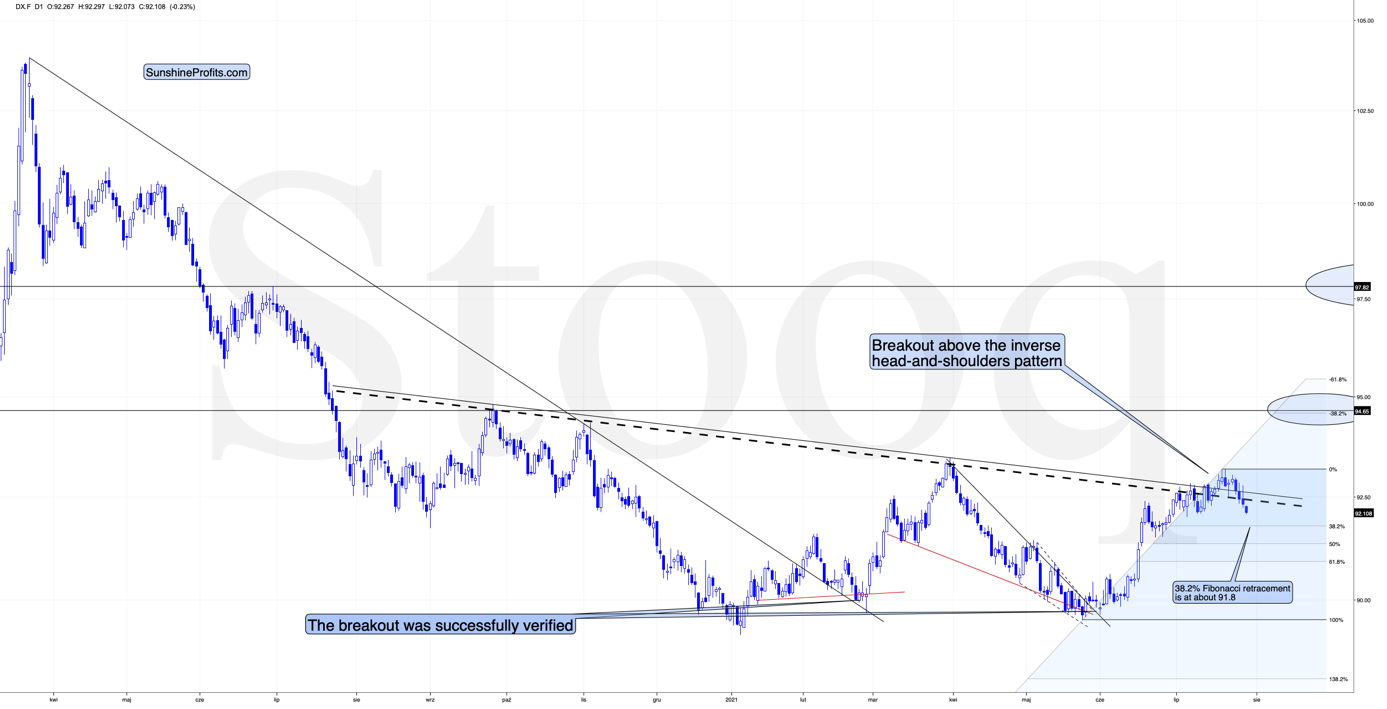
The USD Index invalidated the breakout above its inverse head-and-shoulders pattern, and if I had a long trading position in the USD Index, I would close it based on this development, as it suggests that the USDX might move a bit lower before rallying. I would plan to re-open this position just a little lower, though, as the next support provided by the 38.2% and 50% Fibonacci retracements is quite close. There’s quite a big chance that this move lower will be reversed too, based on the temporary nature of yesterday’s news.
However, as I explained yesterday in the “Letters to the Editor” section, I don’t hold a position in the USD Index but in the mining stocks.
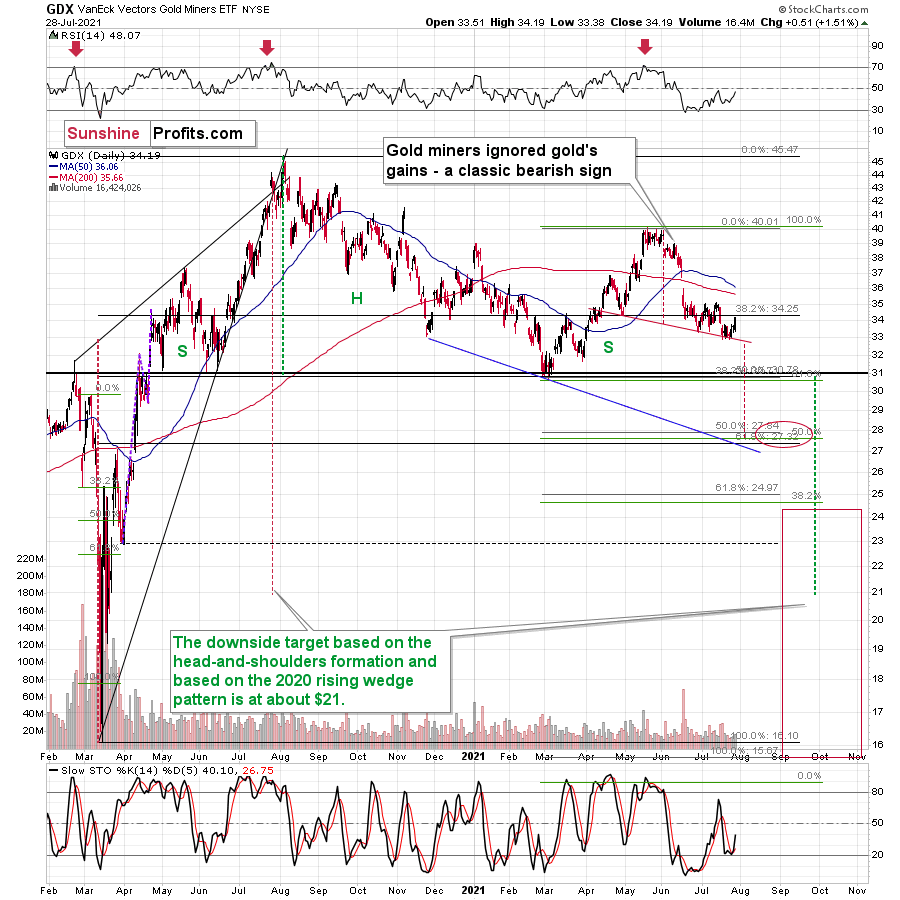
Senior gold miners moved higher yesterday, which didn’t change anything as they remained below their July highs, and the right shoulder of the bearish head and shoulders formation continues to be formed. It might not be perfectly symmetrical, but that in itself doesn’t invalidate the formation.
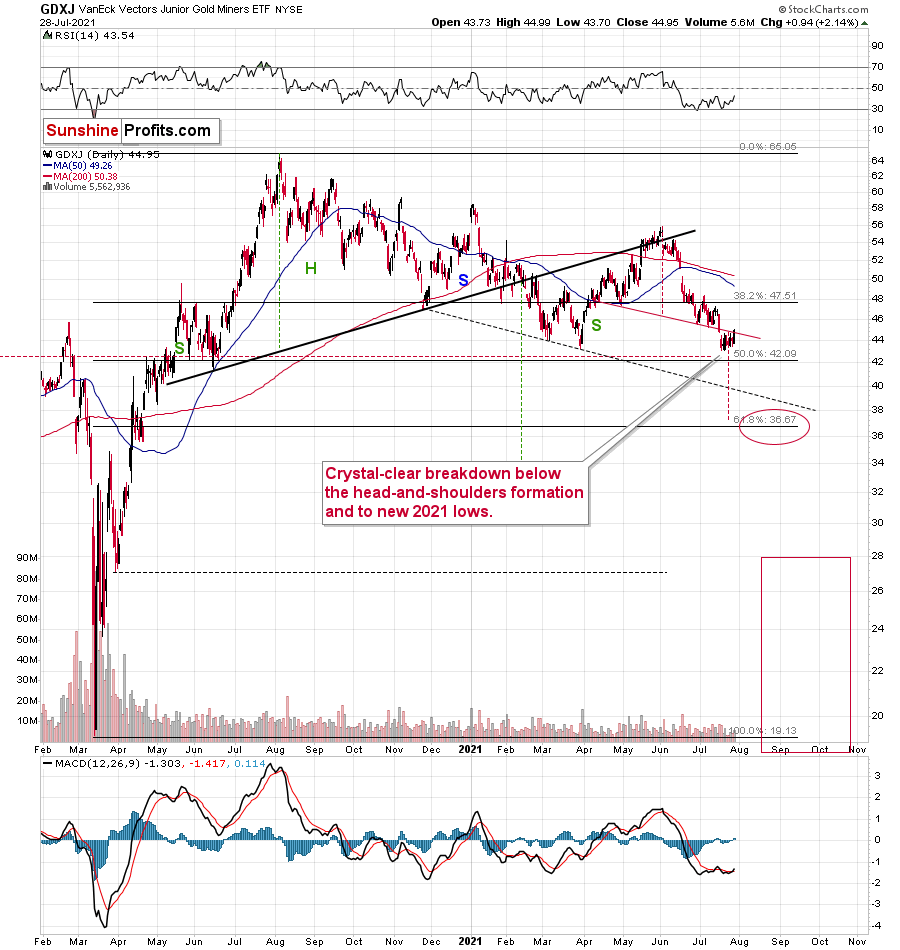
Junior mining stocks invalidated the breakdown below the neck level of their head and shoulders formation, which might make them rally for a day or a few days. However, just as the nature of gold’s rally seems temporary, so is the nature of this tiny upswing in junior miners.
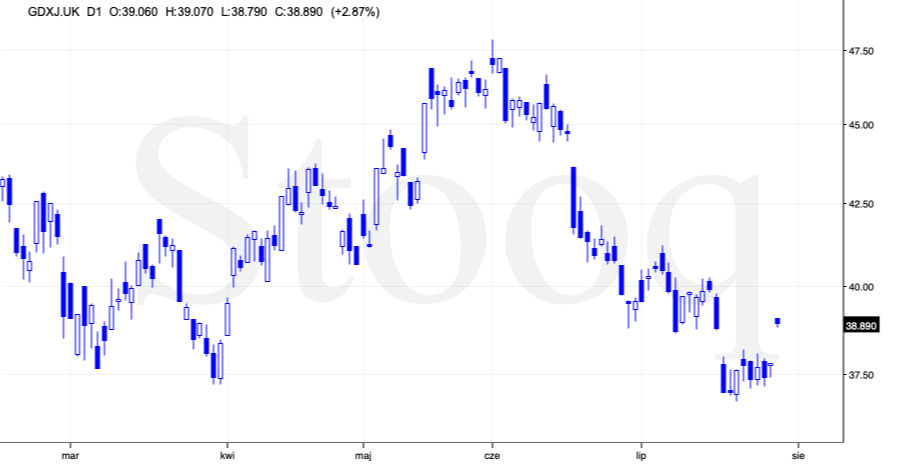
In today’s London trading, the GDXJ is already up significantly (making up for yesterday’s lack of rally, as the exchange was closed during Powell’s speech, and it discounted today’s pre-market rally in gold), but please note that it’s not above its mid-July highs, let alone the early-July highs. Consequently, not that much changed.
If this tiny rally (and perhaps the next few days of small rallies) worries you, please consider the following roadmap.
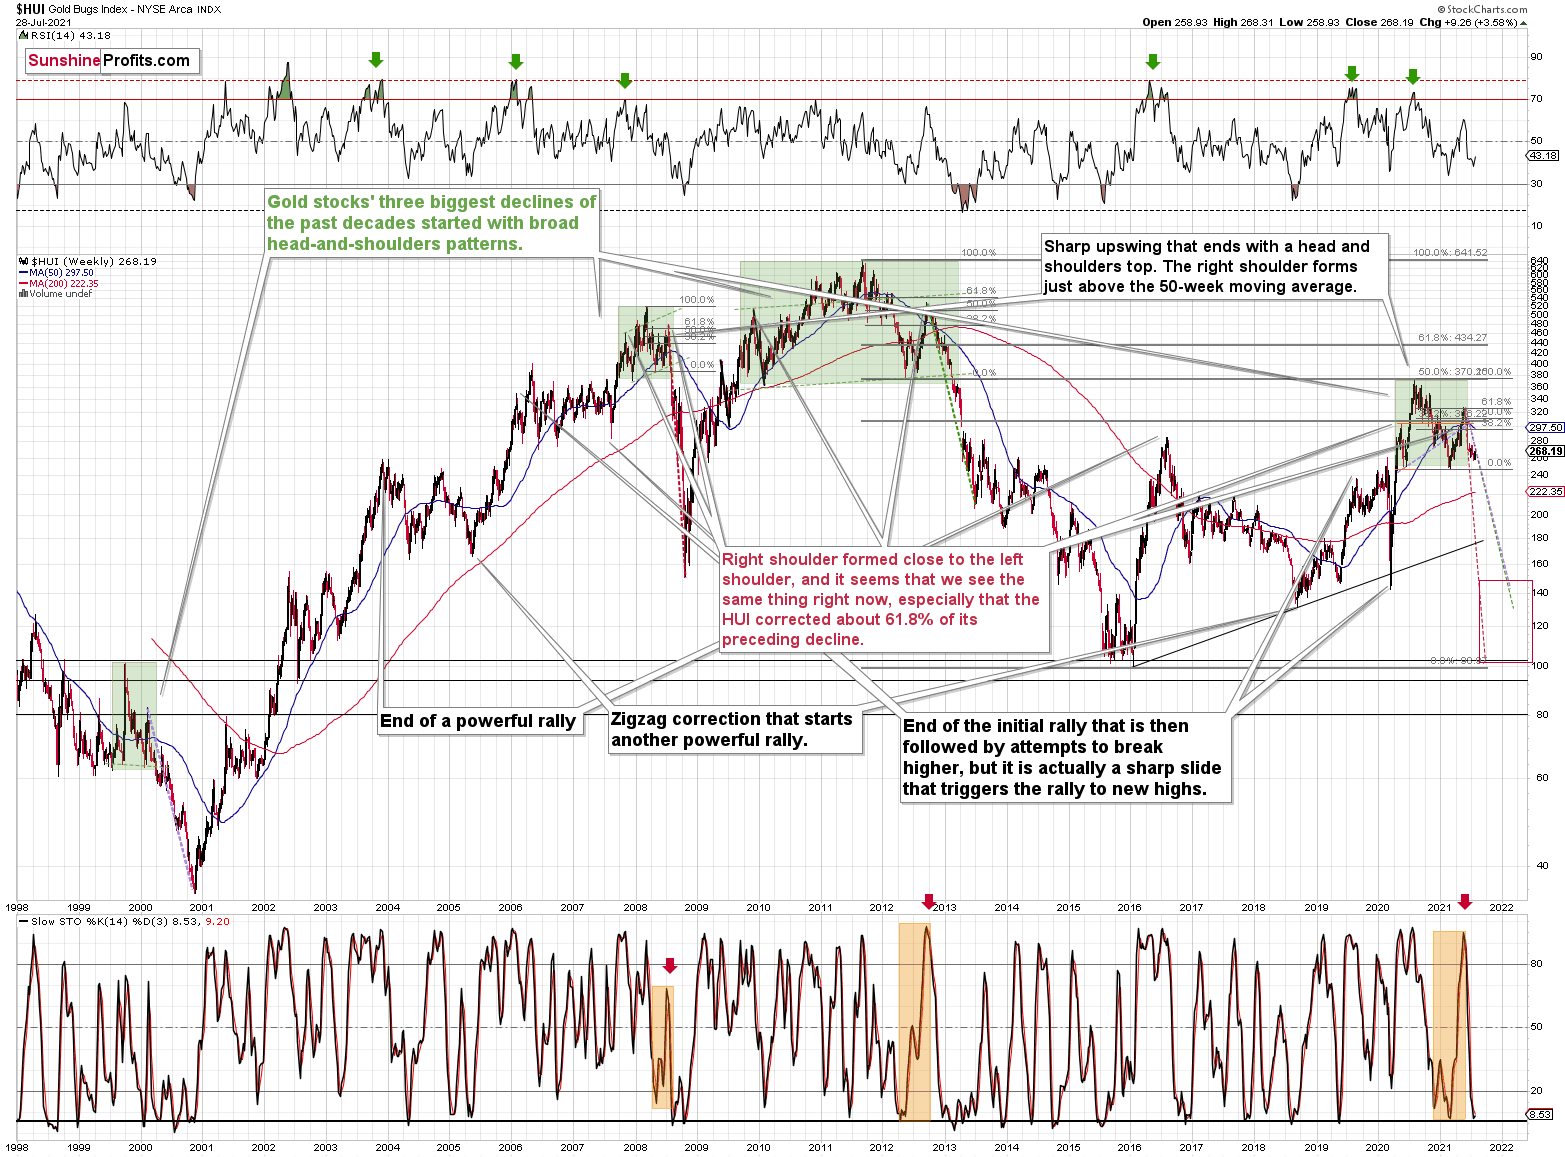
It seems very likely that gold miners are declining similarly to how they declined in 2008 and 2012-2013. In both cases, there were local corrections within the decline. However, if one completely ignored the corrections and kept their short position intact, the profits on the entire slide would have been immense. The current small correction is really just a blip on the radar screen, and the odds are that in a few months nobody will remember about it, as what will happen between now and then (the huge decline) will be so profound that it will displace all those small upswings in one’s memory.
Consequently, it seems to me that the uncertain (it might be even reversed today) rally is not something that really justifies adjusting our short positions in the junior mining stocks. I continue to view them as justified from the risk to reward point of view.
Overview of the Upcoming Part of the Decline
- The biggest corrective upswing in gold might already be over, and it seems that we won’t have to wait long for the current small correction to end either.
- After miners slide in a meaningful and volatile way, but silver doesn’t (and it just declines moderately), I plan to switch from short positions in miners to short positions in silver. At this time, it’s too early to say at what price levels this would take place – perhaps with gold close to $1,600. I plan to exit those short positions when gold shows substantial strength relative to the USD Index, while the latter is still rallying. This might take place with gold close to $1,350 - $1,500 and the entire decline (from above $1,900 to about $1,475) would be likely to take place within 6-20 weeks, and I would expect silver to fall the hardest in the final part of the move. This moment (when gold performs very strongly against the rallying USD and miners are strong relative to gold – after gold has already declined substantially) is likely to be the best entry point for long-term investments, in my view. This might also happen with gold close to $1,475, but it’s too early to say with certainty at this time.
- As a confirmation for the above, I will use the (upcoming or perhaps we have already seen it?) top in the general stock market as the starting point for the three-month countdown. The reason is that after the 1929 top, gold miners declined for about three months after the general stock market started to slide. We also saw some confirmations of this theory based on the analogy to 2008. All in all, the precious metals sector would be likely to bottom about three months after the general stock market tops.
- The above is based on the information available today, and it might change in the following days/weeks.
Please note that the above timing details are relatively broad and “for general overview only” – so that you know more or less what I think and how volatile I think the moves are likely to be – on an approximate basis. These time targets are not binding or clear enough for me to think that they should be used for purchasing options, warrants or similar instruments.
Summary
To summarize, it seems that the bigger corrective upswing in gold might already be over, and that we won’t have to wait for the current small correction to end, either. While the next few days may (!) bring temporarily higher prices, it’s unlikely that they will hold. In particular, just as mining stocks had local corrections that didn’t change the nature of the huge medium-term declines in 2008 and 2012-2013, it’s unlikely that the current local correction changes anything.
It seems that our profits on the short position in the junior mining stocks are going to grow substantially in the following weeks.
After the sell-off (that takes gold to about $1,350 - $1,500), I expect the precious metals to rally significantly. The final part of the decline might take as little as 1-5 weeks, so it's important to stay alert to any changes.
Most importantly, please stay healthy and safe. We made a lot of money last March and this March, and it seems that we’re about to make much more on the upcoming decline, but you have to be healthy to enjoy the results.
As always, we'll keep you - our subscribers - informed.
To summarize:
Trading capital (supplementary part of the portfolio; our opinion): Full speculative short positions (300% of the full position) in mining stocks are justified from the risk to reward point of view with the following binding exit profit-take price levels:
Mining stocks (price levels for the GDXJ ETF): binding profit-take exit price: $37.12; stop-loss: none (the volatility is too big to justify a stop-loss order in case of this particular trade)
Alternatively, if one seeks leverage, we’re providing the binding profit-take levels for the JDST (2x leveraged) and GDXD (3x leveraged – which is not suggested for most traders/investors due to the significant leverage). The binding profit-take level for the JDST: $15.96; stop-loss for the JDST: none (the volatility is too big to justify a SL order in case of this particular trade); binding profit-take level for the GDXD: $37.02; stop-loss for the GDXD: none (the volatility is too big to justify a SL order in case of this particular trade).
For-your-information targets (our opinion; we continue to think that mining stocks are the preferred way of taking advantage of the upcoming price move, but if for whatever reason one wants / has to use silver or gold for this trade, we are providing the details anyway.):
Silver futures upside profit-take exit price: unclear at this time - initially, it might be a good idea to exit, when gold moves to $1,683
Gold futures upside profit-take exit price: $1,683
HGD.TO – alternative (Canadian) inverse 2x leveraged gold stocks ETF – the upside profit-take exit price: $12.88
Long-term capital (core part of the portfolio; our opinion): No positions (in other words: cash
Insurance capital (core part of the portfolio; our opinion): Full position
Whether you already subscribed or not, we encourage you to find out how to make the most of our alerts and read our replies to the most common alert-and-gold-trading-related-questions.
Please note that we describe the situation for the day that the alert is posted in the trading section. In other words, if we are writing about a speculative position, it means that it is up-to-date on the day it was posted. We are also featuring the initial target prices to decide whether keeping a position on a given day is in tune with your approach (some moves are too small for medium-term traders, and some might appear too big for day-traders).
Additionally, you might want to read why our stop-loss orders are usually relatively far from the current price.
Please note that a full position doesn't mean using all of the capital for a given trade. You will find details on our thoughts on gold portfolio structuring in the Key Insights section on our website.
As a reminder - "initial target price" means exactly that - an "initial" one. It's not a price level at which we suggest closing positions. If this becomes the case (like it did in the previous trade), we will refer to these levels as levels of exit orders (exactly as we've done previously). Stop-loss levels, however, are naturally not "initial", but something that, in our opinion, might be entered as an order.
Since it is impossible to synchronize target prices and stop-loss levels for all the ETFs and ETNs with the main markets that we provide these levels for (gold, silver and mining stocks - the GDX ETF), the stop-loss levels and target prices for other ETNs and ETF (among other: UGL, GLL, AGQ, ZSL, NUGT, DUST, JNUG, JDST) are provided as supplementary, and not as "final". This means that if a stop-loss or a target level is reached for any of the "additional instruments" (GLL for instance), but not for the "main instrument" (gold in this case), we will view positions in both gold and GLL as still open and the stop-loss for GLL would have to be moved lower. On the other hand, if gold moves to a stop-loss level but GLL doesn't, then we will view both positions (in gold and GLL) as closed. In other words, since it's not possible to be 100% certain that each related instrument moves to a given level when the underlying instrument does, we can't provide levels that would be binding. The levels that we do provide are our best estimate of the levels that will correspond to the levels in the underlying assets, but it will be the underlying assets that one will need to focus on regarding the signs pointing to closing a given position or keeping it open. We might adjust the levels in the "additional instruments" without adjusting the levels in the "main instruments", which will simply mean that we have improved our estimation of these levels, not that we changed our outlook on the markets. We are already working on a tool that would update these levels daily for the most popular ETFs, ETNs and individual mining stocks.
Our preferred ways to invest in and to trade gold along with the reasoning can be found in the how to buy gold section. Furthermore, our preferred ETFs and ETNs can be found in our Gold & Silver ETF Ranking.
As a reminder, Gold & Silver Trading Alerts are posted before or on each trading day (we usually post them before the opening bell, but we don't promise doing that each day). If there's anything urgent, we will send you an additional small alert before posting the main one.
Thank you.
Przemyslaw Radomski, CFA
Founder, Editor-in-chief

