

Briefly: in our opinion, full (300% of the regular position size) speculative short positions in mining stocks are justified from the risk/reward point of view at the moment of publishing this Alert.
There was only one notable event yesterday, and that was the USD Index’s attempt to invalidate the breakout above its inverse head-and-shoulders pattern – an attempt that was unsuccessful. This means that the breakout proved strong enough to hold the line.
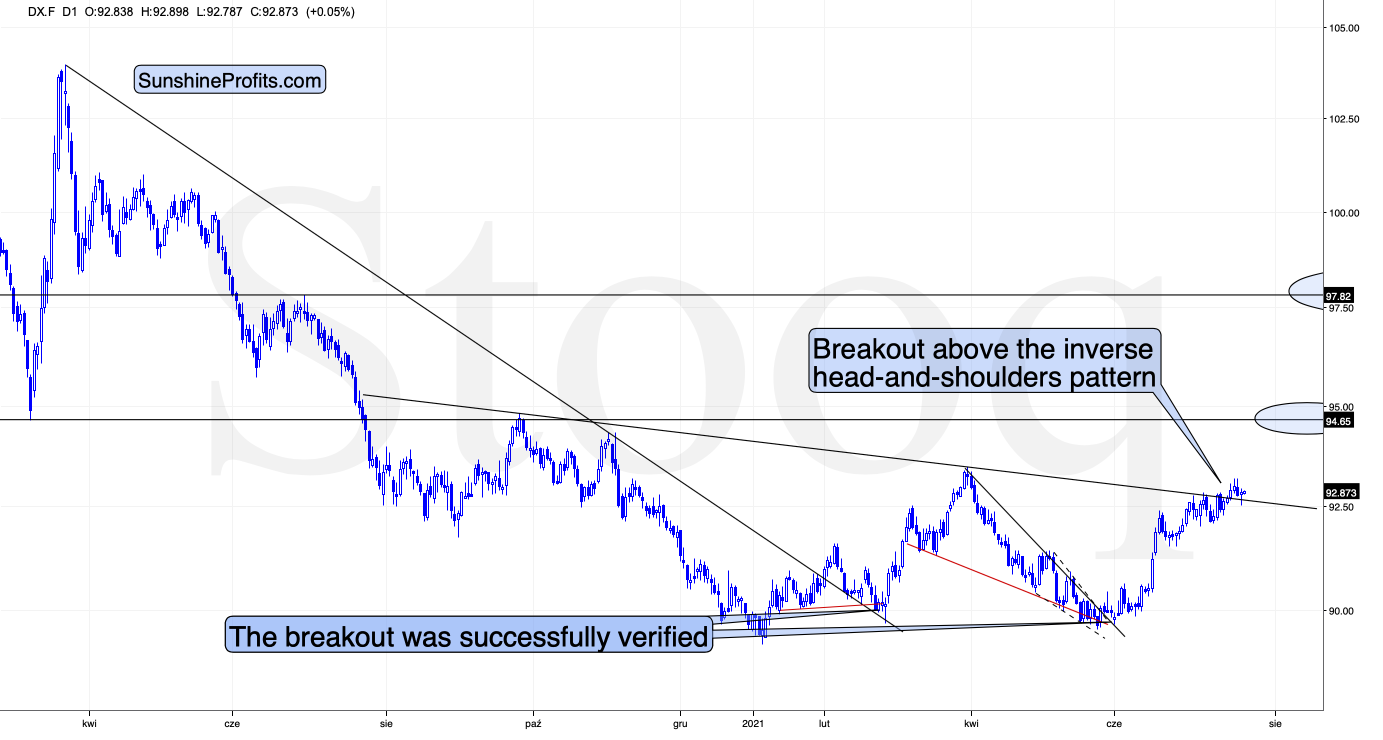
The implications are bullish for the USD Index and bearish for the precious metals sector, as the continuation of the rally in the USD Index (based, i.a., on the above-mentioned breakout) is now even more likely, and because the USD Index tends to move adversely to gold.
Since not much else changed on the technical front yesterday, my other comments from yesterday’s analysis remain up-to-date:
Let’s keep in mind that the USDX’s breakout was not accidental, nor was it based on geopolitical news (the latter tends to trigger temporary moves that are then reversed). Additionally, it was preceded by a consolidation. Consequently, it seems that this breakout is a true one and that it will indeed be followed by much higher USDX values. The previous highs at about 94.5 are the initial upside target, but based on the inverse H&S pattern, the USDX is likely to rally to about 98.
Therefore, what just happened (the confirmed breakout above the formation’s neckline) has really bullish implications for the U.S. currency. And since the latter tends to move in the opposite direction to gold, silver, and mining stocks, it’s also very bearish for them.
That would be enough on its own to make the outlook for the PMs bearish, but we have many more bearish indications, and some of them are truly profound. The most bearish confirmation of the bearish price prediction for gold doesn’t come from the USD Index but from the extreme underperformance of gold stocks relative to gold.
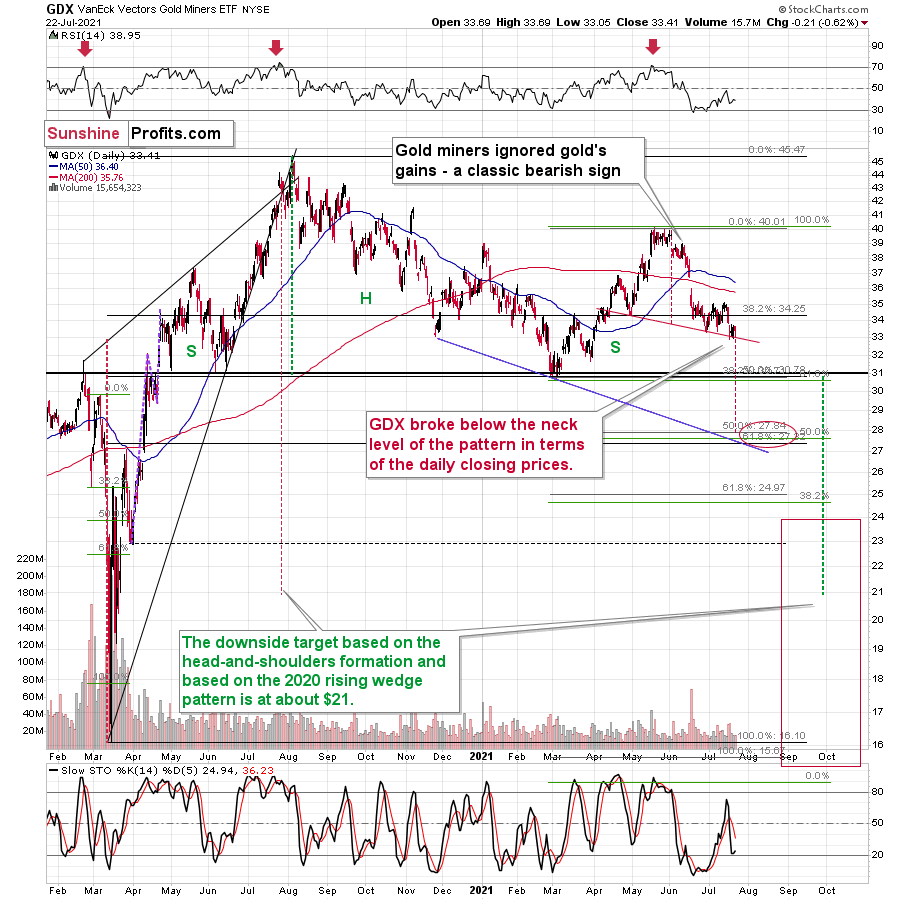
During Wednesday’s session, gold miners (both: seniors and juniors) moved somewhat higher, but it doesn’t seem to be a game changer but rather a correction within an established trend.
Miners take the general stock market’s lead every now and then, and Wednesday was a day when stocks moved higher. Again, nothing uncommon. Yesterday’s (Thursday’s) move back down in stocks confirms the above.
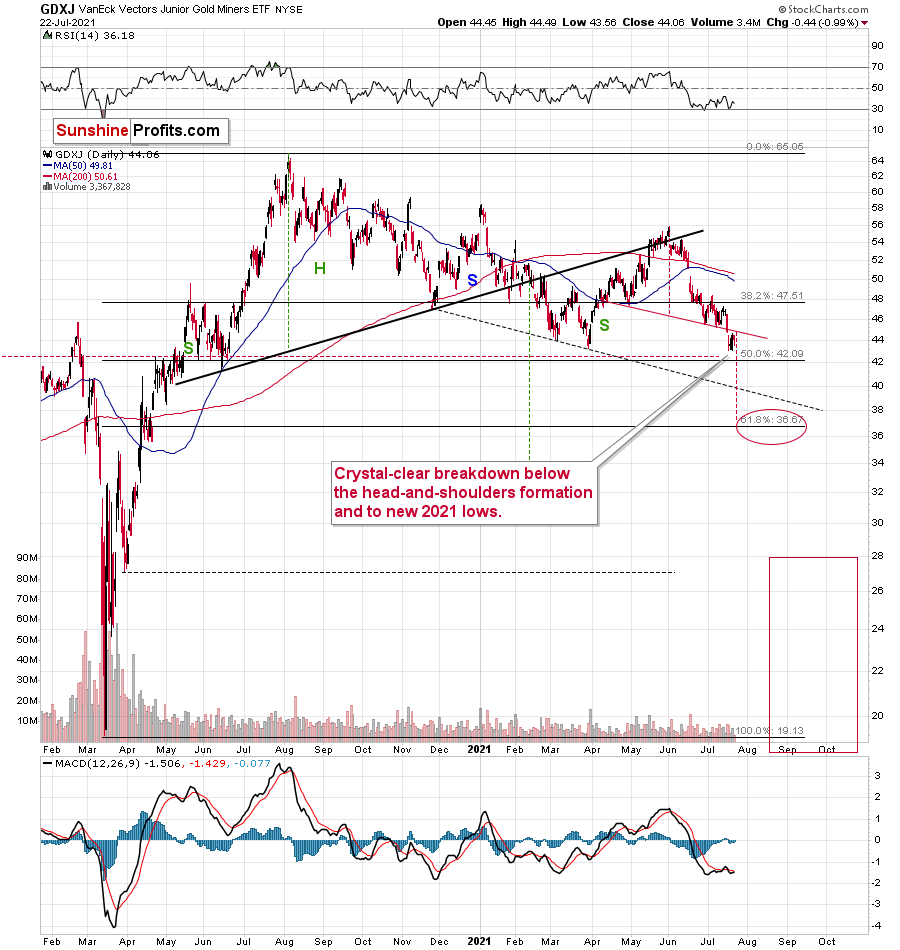
Let’s keep in mind that despite yesterday’s move higher, the proxy for junior mining stocks – the GDXJ ETF – didn’t invalidate its breakdown below the head and shoulders pattern. Conversely, it just moved back to the neck level – likely providing the final verification of the breakdown.
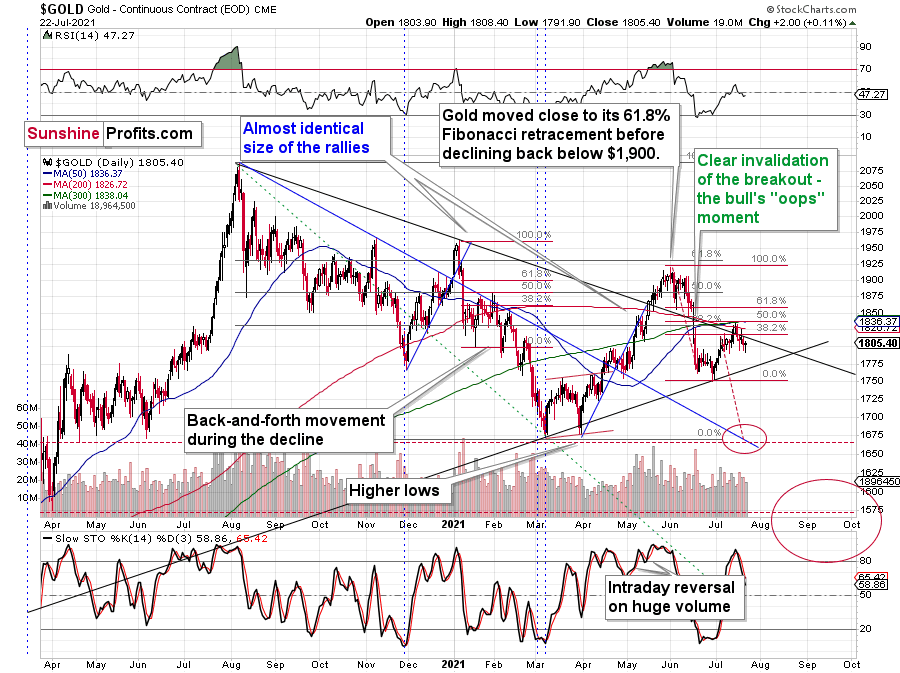
Gold itself moved slightly higher, which didn’t change much. The self-similarity to what happened in 2012 and 2013 (and to some extent in 2008) remains intact and the implications remain very bearish for the following weeks.
Having said that, let’s take a look at the markets from a more fundamental point of view.
The Worst Kept Secret
While investors worried that the European Central Bank (ECB) would turn hawkish as the summer months heat up, I warned on Apr. 27 that the prospect was quite laughable.
I wrote:
There seems to be some confusion about the European Central Bank’s (ECB) – and other major central banks’ – suspension of their 84-day U.S. dollar liquidity operations. For context, the swap facility was created to ensure that U.S. dollars remained abundant during the coronavirus crisis. However, keep in mind that “an important liquidity backstop to ease strains in global funding markets,” is code for avoiding a large spike in the U.S. dollar. The bottom line? The suspension of the facility is not bearish for the greenback, if anything, it’s bullish because it reduces the available supply of U.S. dollars.
If that wasn’t enough, recent whispers of the ECB tapering its bond-buying program are extremely premature. With the European economy still drastically underperforming the U.S., it’s actually more likely that the ECB increases the pace of its bond-buying program.
In addition, I wrote on Jul. 20:
The U.S. Federal Reserve (FED) and the ECB are worlds apart. With the FED likely to reveal its taper timeline in September, inflation differentials highlight the regional dichotomy.
Please see below:
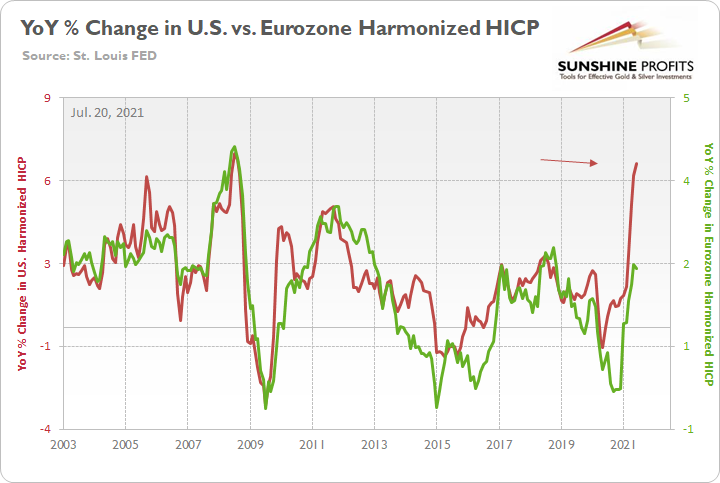
To explain, the green line above tracks the year-over-year (YoY) percentage change in the Eurozone Harmonized Index of Consumer Prices (HICP), while the red line above tracks the YoY percentage change in the U.S. HICP. If you analyze the right side of the chart, it’s not even close. And with the U.S. HICP rising by 6.41% YoY in June and the Eurozone HICP rising by 1.90%, the FED is likely to taper well in advance of the ECB.
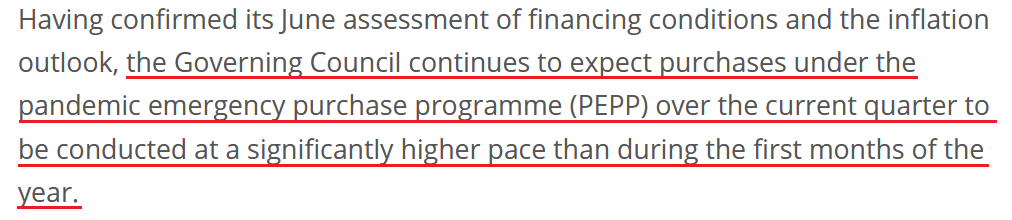
And with the ECB releasing its monetary policy decision on Jul. 22, the Governing Council “revised its forward guidance on interest rates” (spoiler alert, lower for longer) and it doubled down on its “commitment to maintain a persistently accommodative monetary policy stance to meet its inflation target.”
Please see below:
 Source: ECB
On top of that:
“The Governing Council also intends to continue reinvesting, in full, the principal payments from maturing securities purchased under the APP for an extended period of time past the date when it starts raising the key ECB interest rates, and in any case for as long as necessary to maintain favourable liquidity conditions and an ample degree of monetary accommodation.”
Furthermore, ECB President Christine Lagarde removed any doubt during her press conference on Jul. 22:
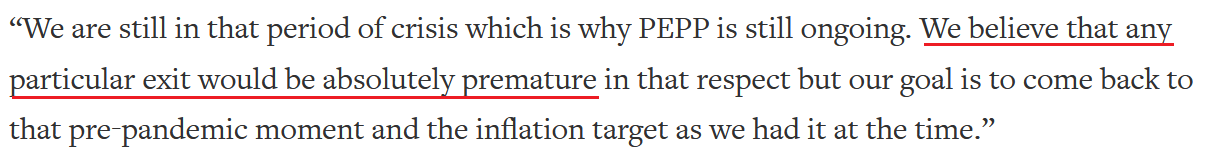 Source: Reuters
She added:
“The forward guidance rests on three key criteria’s if you will:
We see inflation reaching 2% well ahead of the end of our projection or rising, that’s like number one and number two, durably for the rest of the projection horizon. And thirdly, we judge that realized progress in underlying inflation is sufficiently advanced to be consistent with inflation stabilizing at 2% over the medium term …. So, by these three legs, we’re essentially saying, first of all, that we want to see inflation reach 3% well ahead of the end of our projection horizon.”
And why is this quote so important? Well, because Euro area inflation (released on Jul. 16) rose by 1.90% year-over-year (YoY) in June. And if the ECB wants inflation to reach 3% well before it turns hawkish, any talk of a forthcoming taper is much more semblance than substance.
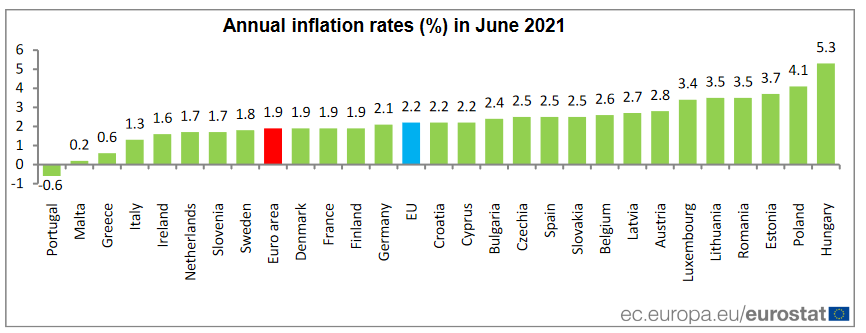
The bottom line? With the U.S. Consumer Price Index (CPI) surging by 5.32% YoY in June and tracking well ahead of the Eurozone, again, the FED and the ECB are worlds apart.
Kansas City FED Has Something to Say
Speaking of inflation, the Kansas City FED released its Tenth District Manufacturing Survey on Jul. 22. And with its prices paid index remaining “near record highs” and its prices received index hitting an all-time high, inflationary momentum in the U.S. remains robust.
Please see below:
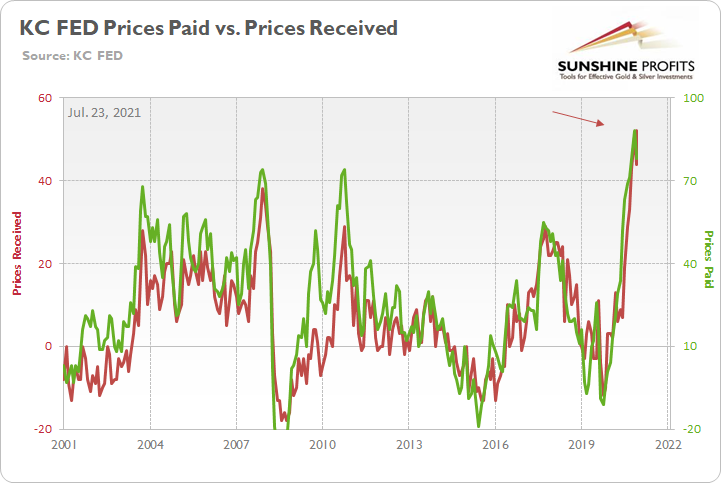
To explain, the green line above tracks the KC FED’s prices paid index, while the red line above tracks the KC FED’s prices received index. If you analyze the right side of the chart, you can see that both remain extremely elevated.
What’s more, while the “month-over-month composite index was 30 in July, up from 27 in June and 26 in May … indexes for shipments, new orders, order backlog, and new orders for exports rose at a faster pace in July, and supplier delivery time increased.” Moreover, while the “future composite index edged down from the record high 37 in June to 33 in July, [it’s] still indicating solid expectations over the next six months.”
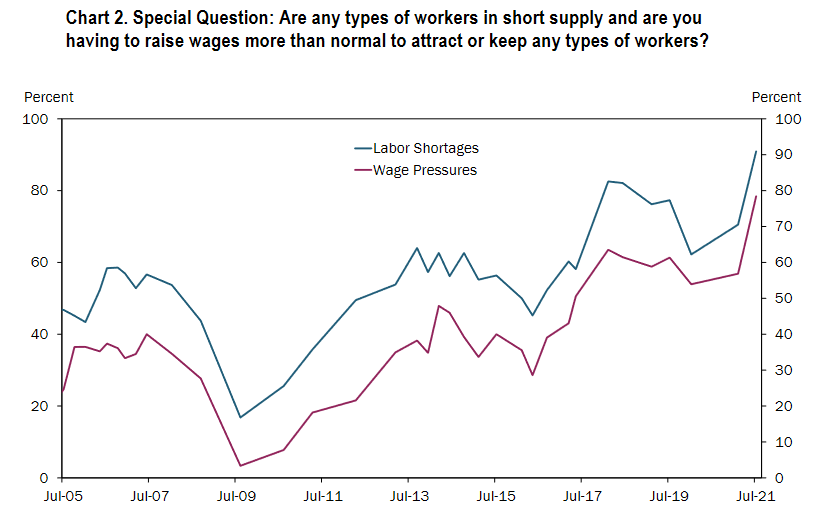
On top of that, “91% of firms reported workers were in short supply, more than any time previously asked in survey history. Wage pressures also surpassed survey records as 78% of firms reported having to raise wages more than normal to attract or keep workers. To attract new talent, 72% of manufacturers reported raising compensation, 60% reported hiring less qualified workers with more on the job training, and another 60% increased advertising for open positions.”
Please see below:
 Source: KC FED
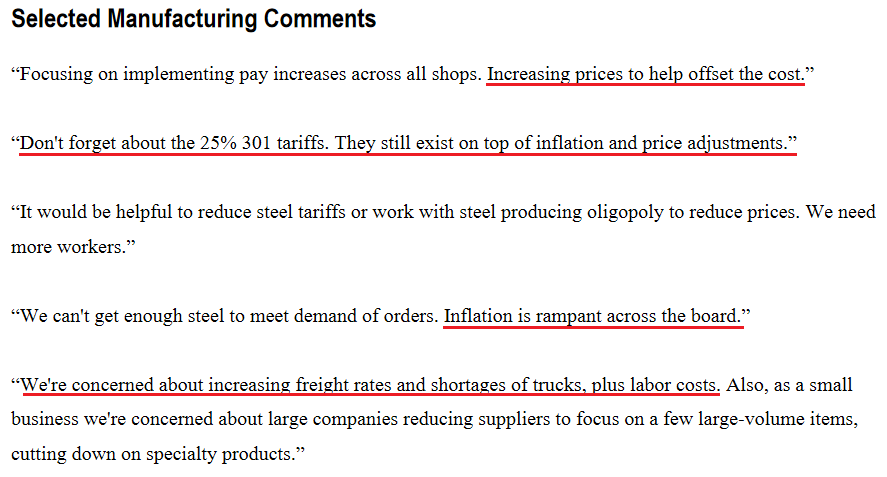
For anecdotal evidence, please have a look at respondents’ opinions about the current economic climate:
 Source: KC FED
Who’s Talking About Inflation? Harley-Davidson?
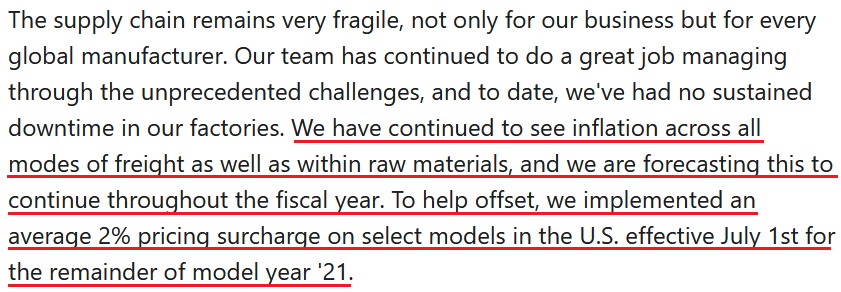
Finally, Harley-Davidson – an American motorcycle manufacturer – is also sounding the alarm on inflation. During its second-quarter earnings call on Jul. 21, CFO Gina Goetter said the following:
“In terms of impact within the quarter and as you think about the margin change, the raw material increase was worth about two points of margin. So it was fairly material. And then you add on top of that all the logistics rate inflation that we're seeing that was roughly another three points of margin. So, those headwinds that are coming at us are roughly five points of margin within the quarter.”
And how is the company responding to the inflationary pressures?
 Source: Harley-Davidson/The Motley Fool
The bottom line? With inflation surging and the FED likely to announce its taper timeline in September, the time-tested relationship of ‘U.S. dollar up, PMs down’ will likely be a major storyline during the Autumn months.
In conclusion, the gold miners continued underperformance of gold is an ominous sign for the PMs’ medium-term outlook. With the former unable to gain any traction even while the U.S. 10-Year real yield languishes, the threat of a FED taper is having a material psychological effect on investors. Moreover, with the ECB turning dovish at a time when the FED is turning hawkish, the EUR/USD’s plight has helped uplift the USD Index (the currency pair accounts for nearly 58% of the USD Index’s movement). As a result, while the PMs’ long-term outlook remains bright, a rising U.S. dollar will likely dampen their performance over the next few months.
Overview of the Upcoming Part of the Decline
- The corrective upswing in gold might already be over, and another huge decline is likely just around the corner. In fact, it seems to be well underway in the case of mining stocks, especially junior miners.
- After miners slide in a meaningful and volatile way, but silver doesn’t (and it just declines moderately), I plan to switch from short positions in miners to short positions in silver. At this time, it’s too early to say at what price levels this would take place – perhaps with gold close to $1,600. I plan to exit those short positions when gold shows substantial strength relative to the USD Index, while the latter is still rallying. This might take place with gold close to $1,350 - $1,500 and the entire decline (from above $1,900 to about $1,475) would be likely to take place within 6-20 weeks, and I would expect silver to fall the hardest in the final part of the move. This moment (when gold performs very strongly against the rallying USD and miners are strong relative to gold – after gold has already declined substantially) is likely to be the best entry point for long-term investments, in my view. This might also happen with gold close to $1,475, but it’s too early to say with certainty at this time.
- As a confirmation for the above, I will use the (upcoming or perhaps we have already seen it?) top in the general stock market as the starting point for the three-month countdown. The reason is that after the 1929 top, gold miners declined for about three months after the general stock market started to slide. We also saw some confirmations of this theory based on the analogy to 2008. All in all, the precious metals sector would be likely to bottom about three months after the general stock market tops.
- The above is based on the information available today, and it might change in the following days/weeks.
Please note that the above timing details are relatively broad and “for general overview only” – so that you know more or less what I think and how volatile I think the moves are likely to be – on an approximate basis. These time targets are not binding or clear enough for me to think that they should be used for purchasing options, warrants or similar instruments.
Summary
To summarize, it seems that gold has already formed its short-term top and – based, i.a., on the completed inverse head-and-shoulders pattern in the USD Index – gold is likely to fall substantially in the following weeks. Gold stocks’ exceptionally weak performance has been indicating that for many weeks, and given juniors’ breakdown to new yearly lows, it seems that the storm has already begun.
It seems that our profits on the short position in the junior mining stocks are going to grow substantially in the following weeks.
After the sell-off (that takes gold to about $1,350 - $1,500), I expect the precious metals to rally significantly. The final part of the decline might take as little as 1-5 weeks, so it's important to stay alert to any changes.
Most importantly, please stay healthy and safe. We made a lot of money last March and this March, and it seems that we’re about to make much more on the upcoming decline, but you have to be healthy to enjoy the results.
As always, we'll keep you - our subscribers - informed.
By the way, we’re currently providing you with the possibility to extend your subscription by a year, two years or even three years with a special 20% discount. This discount can be applied right away, without the need to wait for your next renewal – if you choose to secure your premium access and complete the payment upfront. The boring time in the PMs is definitely over, and the time to pay close attention to the market is here. Naturally, it’s your capital, and the choice is up to you, but it seems that it might be a good idea to secure more premium access now while saving 20% at the same time. Our support team will be happy to assist you in the above-described upgrade at preferential terms – if you’d like to proceed, please contact us.
To summarize:
Trading capital (supplementary part of the portfolio; our opinion): Full speculative short positions (300% of the full position) in mining stocks are justified from the risk to reward point of view with the following binding exit profit-take price levels:
Mining stocks (price levels for the GDXJ ETF): binding profit-take exit price: $37.12; stop-loss: none (the volatility is too big to justify a stop-loss order in case of this particular trade)
Alternatively, if one seeks leverage, we’re providing the binding profit-take levels for the JDST (2x leveraged) and GDXD (3x leveraged – which is not suggested for most traders/investors due to the significant leverage). The binding profit-take level for the JDST: $15.96; stop-loss for the JDST: none (the volatility is too big to justify a SL order in case of this particular trade); binding profit-take level for the GDXD: $37.02; stop-loss for the GDXD: none (the volatility is too big to justify a SL order in case of this particular trade).
For-your-information targets (our opinion; we continue to think that mining stocks are the preferred way of taking advantage of the upcoming price move, but if for whatever reason one wants / has to use silver or gold for this trade, we are providing the details anyway.):
Silver futures upside profit-take exit price: unclear at this time - initially, it might be a good idea to exit, when gold moves to $1,683
Gold futures upside profit-take exit price: $1,683
HGD.TO – alternative (Canadian) inverse 2x leveraged gold stocks ETF – the upside profit-take exit price: $12.88
Long-term capital (core part of the portfolio; our opinion): No positions (in other words: cash
Insurance capital (core part of the portfolio; our opinion): Full position
Whether you already subscribed or not, we encourage you to find out how to make the most of our alerts and read our replies to the most common alert-and-gold-trading-related-questions.
Please note that we describe the situation for the day that the alert is posted in the trading section. In other words, if we are writing about a speculative position, it means that it is up-to-date on the day it was posted. We are also featuring the initial target prices to decide whether keeping a position on a given day is in tune with your approach (some moves are too small for medium-term traders, and some might appear too big for day-traders).
Additionally, you might want to read why our stop-loss orders are usually relatively far from the current price.
Please note that a full position doesn't mean using all of the capital for a given trade. You will find details on our thoughts on gold portfolio structuring in the Key Insights section on our website.
As a reminder - "initial target price" means exactly that - an "initial" one. It's not a price level at which we suggest closing positions. If this becomes the case (like it did in the previous trade), we will refer to these levels as levels of exit orders (exactly as we've done previously). Stop-loss levels, however, are naturally not "initial", but something that, in our opinion, might be entered as an order.
Since it is impossible to synchronize target prices and stop-loss levels for all the ETFs and ETNs with the main markets that we provide these levels for (gold, silver and mining stocks - the GDX ETF), the stop-loss levels and target prices for other ETNs and ETF (among other: UGL, GLL, AGQ, ZSL, NUGT, DUST, JNUG, JDST) are provided as supplementary, and not as "final". This means that if a stop-loss or a target level is reached for any of the "additional instruments" (GLL for instance), but not for the "main instrument" (gold in this case), we will view positions in both gold and GLL as still open and the stop-loss for GLL would have to be moved lower. On the other hand, if gold moves to a stop-loss level but GLL doesn't, then we will view both positions (in gold and GLL) as closed. In other words, since it's not possible to be 100% certain that each related instrument moves to a given level when the underlying instrument does, we can't provide levels that would be binding. The levels that we do provide are our best estimate of the levels that will correspond to the levels in the underlying assets, but it will be the underlying assets that one will need to focus on regarding the signs pointing to closing a given position or keeping it open. We might adjust the levels in the "additional instruments" without adjusting the levels in the "main instruments", which will simply mean that we have improved our estimation of these levels, not that we changed our outlook on the markets. We are already working on a tool that would update these levels daily for the most popular ETFs, ETNs and individual mining stocks.
Our preferred ways to invest in and to trade gold along with the reasoning can be found in the how to buy gold section. Furthermore, our preferred ETFs and ETNs can be found in our Gold & Silver ETF Ranking.
As a reminder, Gold & Silver Trading Alerts are posted before or on each trading day (we usually post them before the opening bell, but we don't promise doing that each day). If there's anything urgent, we will send you an additional small alert before posting the main one.
Thank you.
Przemyslaw Radomski, CFA
Founder, Editor-in-chief

