

Briefly: in our opinion, full (300% of the regular position size) speculative short positions in mining stocks are justified from the risk/reward point of view at the moment of publishing this Alert.
We might see a relatively small corrective upswing in the precious metals sector, but it doesn’t seem certain enough for us to adjust the current (profitable) trading position.
After showing exceptional weakness relative to both gold and the stock market, miners have finally found some very short-term support that could trigger a small rebound. The emphasis is placed on “small”, and on “could”. If the above sentence included the word “temporary” it would get the emphasis as well.
Here’s what happened:
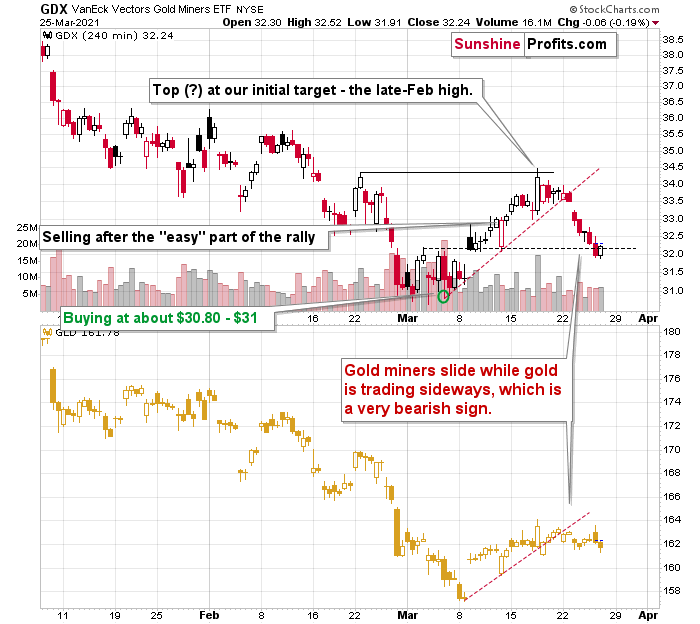
After breaking below the rising red support line and declining quite visibly despite gold’s back-and-forth trading, miners finally reached a support level that could trigger something other than more declines.
I marked this support level with black, dashed line. It’s based on the early-March high, the price gap that we saw shortly thereafter, and on the March 12 intraday low. A triple support level might seem like a very big deal, but let’s keep in mind that all these support levels are of very short-term nature. Consequently, if they are going to trigger a rebound, it’s likely to be of very short-term nature as well.
Moreover, given the weakness that miners have just exhibited toward gold, it’s quite clear that the next really big move lower is already underway.
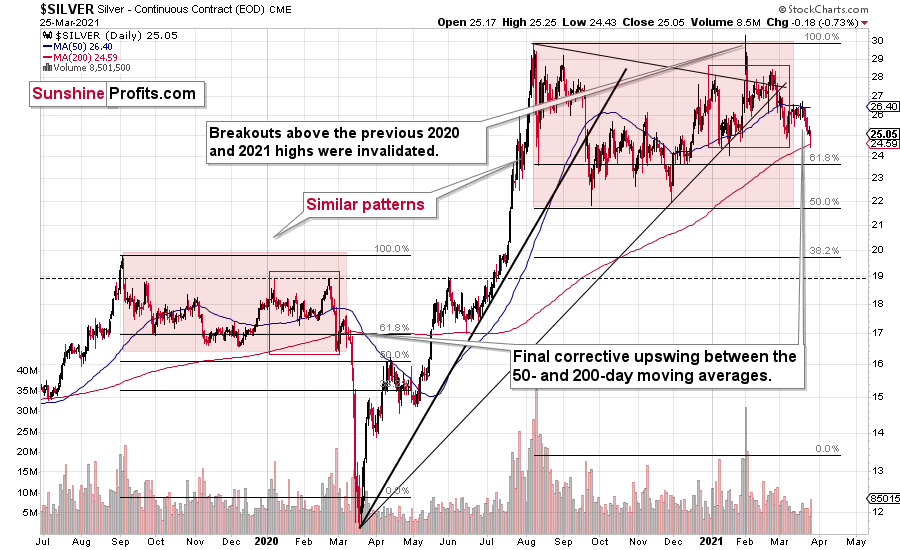
Silver moved lower yesterday, but it also reversed and erased almost its entire daily decline before the end of the session. The volume that accompanied it was not huge in absolute terms, but it was notable when compared to the previous several sessions. Consequently, yesterday’s reversal is at least somewhat important, and it has at least some bullish implications for the short term.
On the other hand, silver appears to continue its self-similar pattern based on the patterns in red-colored areas, and if this continues, then it’s unlikely that we’ll see anything more than a very brief (perhaps a daily move or so) move higher.
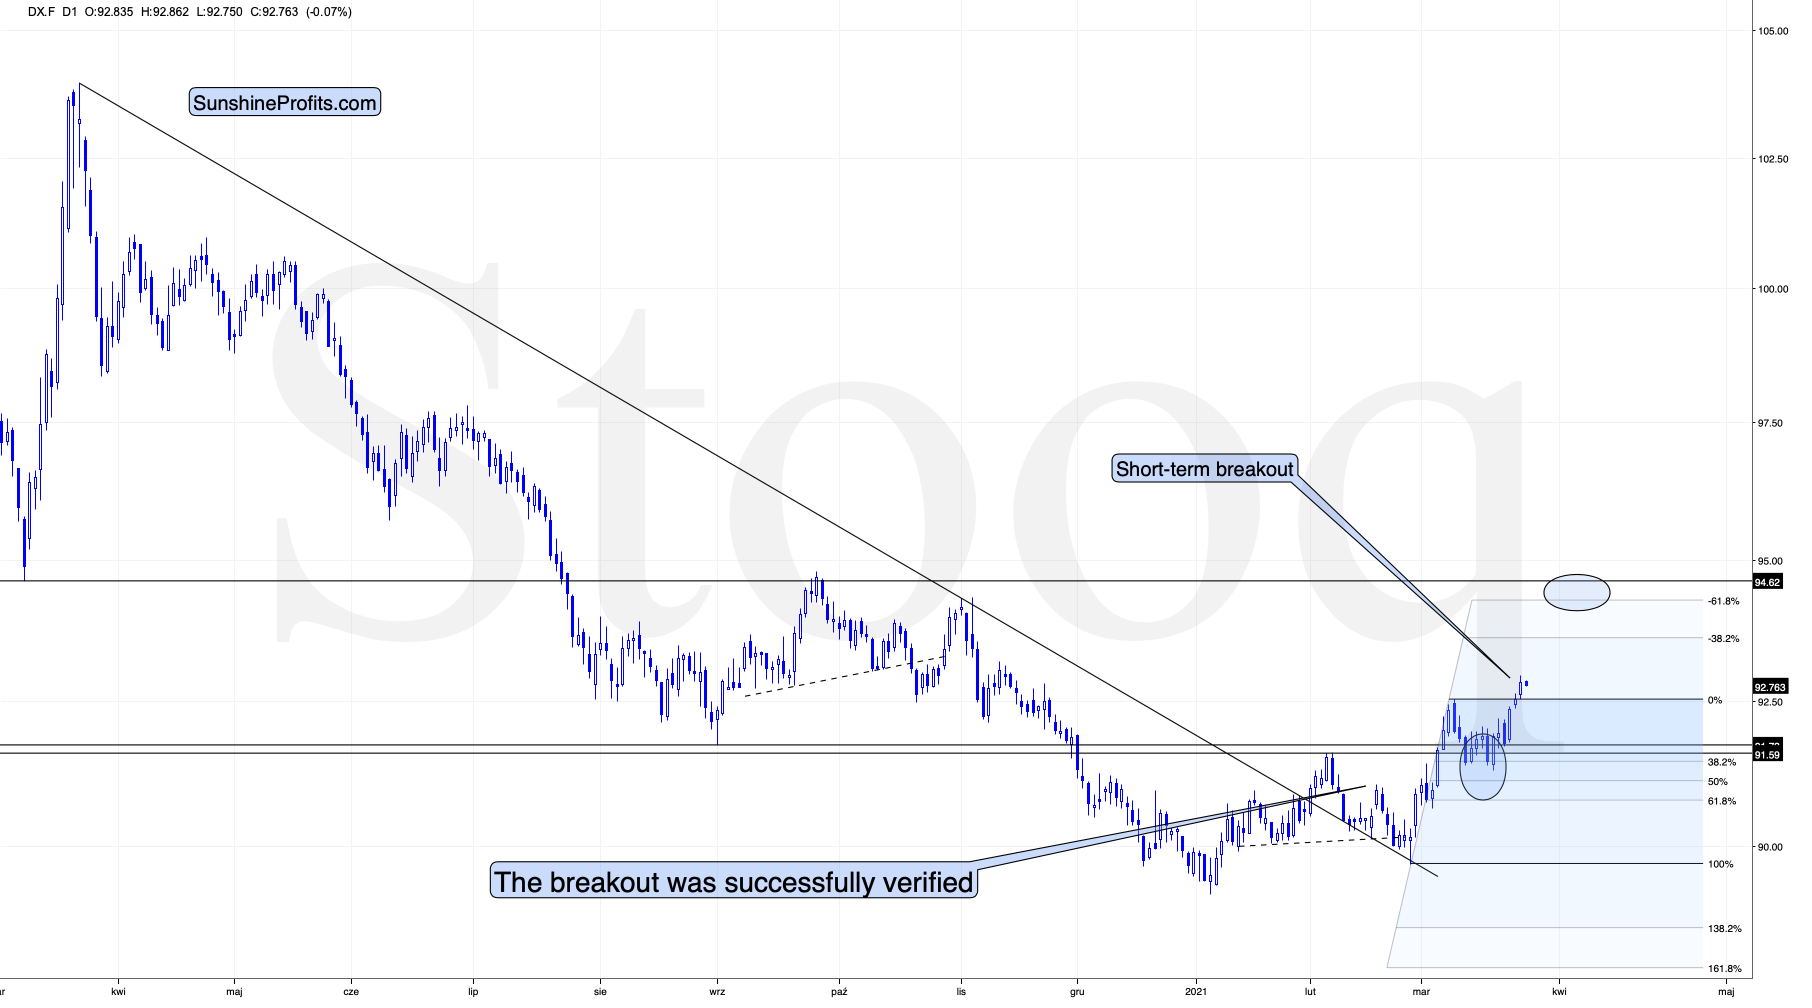
The situation in the USD Index fits the above quite well.
I previously commented on the USD Index chart in the following way:
Right now, traders are likely taking the wait-and-see approach with regard to the USD Index. The latter just moved to its previous yearly highs. It’s already after verification of the breakout above the February highs, so it seems that it’s ready to break higher any day – or hour – now. When that happens, I expect the rally to take the USDX to at least 94, perhaps to 94.5 or 95. The September 2020 high is 94.8, so this level is the most likely upside target for the short term. I don’t think that the rally in the USD Index would end once it reaches the proximity of 95, but that’s when we might see another breather (perhaps after a breakout above this level and perhaps before the breakout, it’s too early to tell at this time).
The situation is developing as I outlined above. The breakout in the USD Index is not yet confirmed, but it seems quite likely that it will be confirmed shortly. I would not be surprised to see a weekly close near the previous yearly highs (the February highs) and then a powerful rally next week. This – if it happens in the above-mentioned way – would be likely to result in a major slide in the PMs next week.
The above remains up-to-date. A weekly close near the previous yearly highs (the February highs) would imply a small move lower from here. Such a move lower would perfectly fit the scenario in which the precious metals sector shows some very temporary strength before sliding lower.
Having said that, let’s take a look at the market from a more fundamental angle.
Piecing Together the Bearish Puzzle
With the PMs eliciting weakness in the face of a rising USD Index, I wrote previously that if a crisis of confidence erupts across U.S. equities, the PMs could move substantially lower. When combining an equity shock with a USD Index resurgence, the yellow metal could bottom at roughly $1,400 (or even ~$1,350).
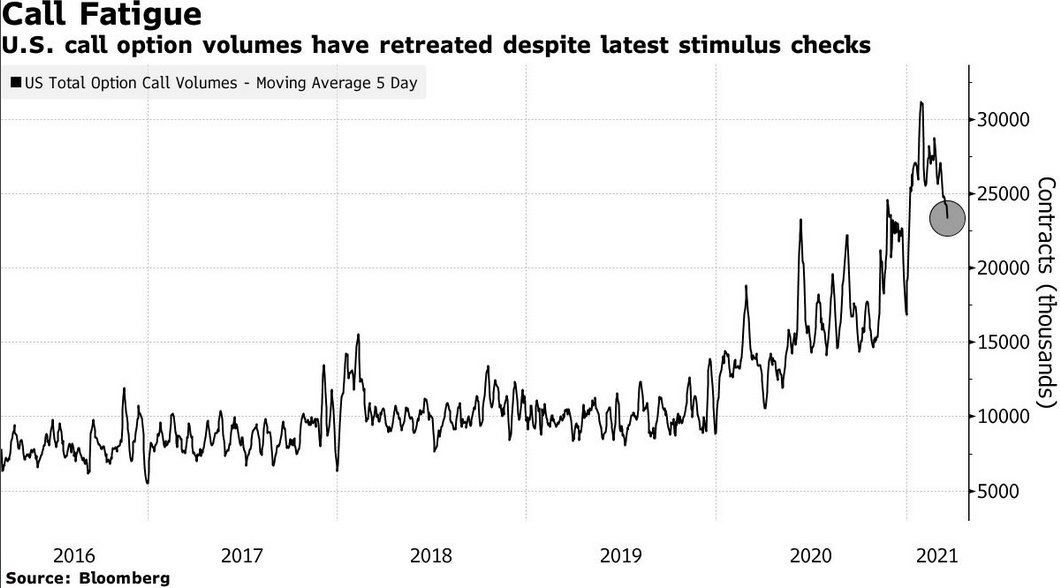
And despite a late-afternoon rally helping to save face on Mar. 25, U.S. equities have displayed heightened volatility over the last week. With stimulus checks already in the price and the whipsawed trade eating away at options’ Theta (time value until expiration), retail traders could soon run out of funds.
If you analyze the right side of the chart below, you can see that retail participation is unlike anything that we’ve seen over the last ~12 years.
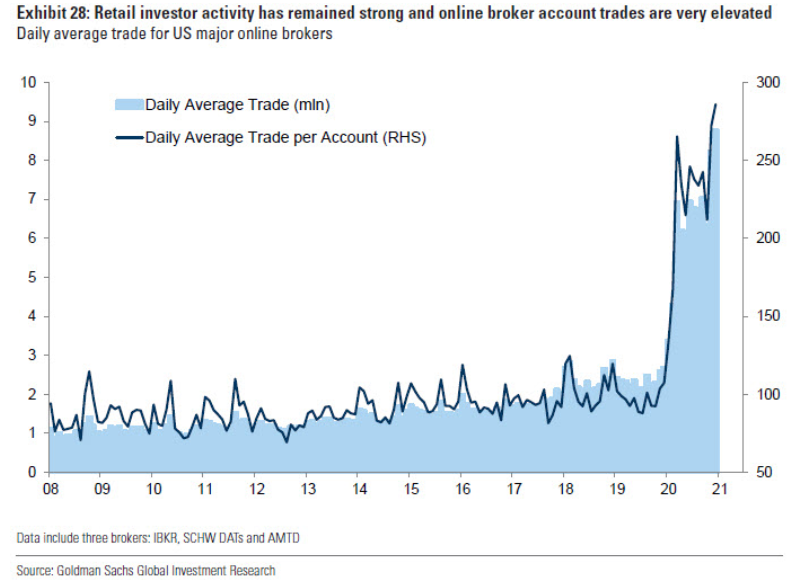
However, with their rallying cries heard loud and clear in the options market, the parabolic rise in retail activity has also coincided with record call option volume. But, as the up-and-down trade causes more and more option contracts to expire worthless, retails’ derivative demand is slowly dissipating.
Please see below:
To explain the significance, I wrote previously:
Option values are determined by ‘The Greeks’ – Delta, Gamma, Theta, Vega and Rho. And Delta and Gamma are important because they determine dealers’ (options sellers like investment banks, hedge funds and prop traders) hedging activity.
When investors buy call options, dealers hedge their exposure by purchasing the underlying asset (which causes the SPX to rise). As the dance continues, it manifests itself into a positive feedback loop where: speculators buy SPX call options … dealers hedge (by purchasing SPX ETF shares or using similar hedges) … the SPX rises … speculators buy more call options.
Rinse, repeat.
However, while the merry-go-round can continue for some time, eventually, when the dynamic reverses, it has the opposite effect. Instead of dealers’ hedging activity leading the stock market higher, the offloading of hedges – which occurs when call buyers stop rolling over their contracts – often leads the stock market lower. As a result, a further decline in call option buys could result in a material number of shares hitting the open market.
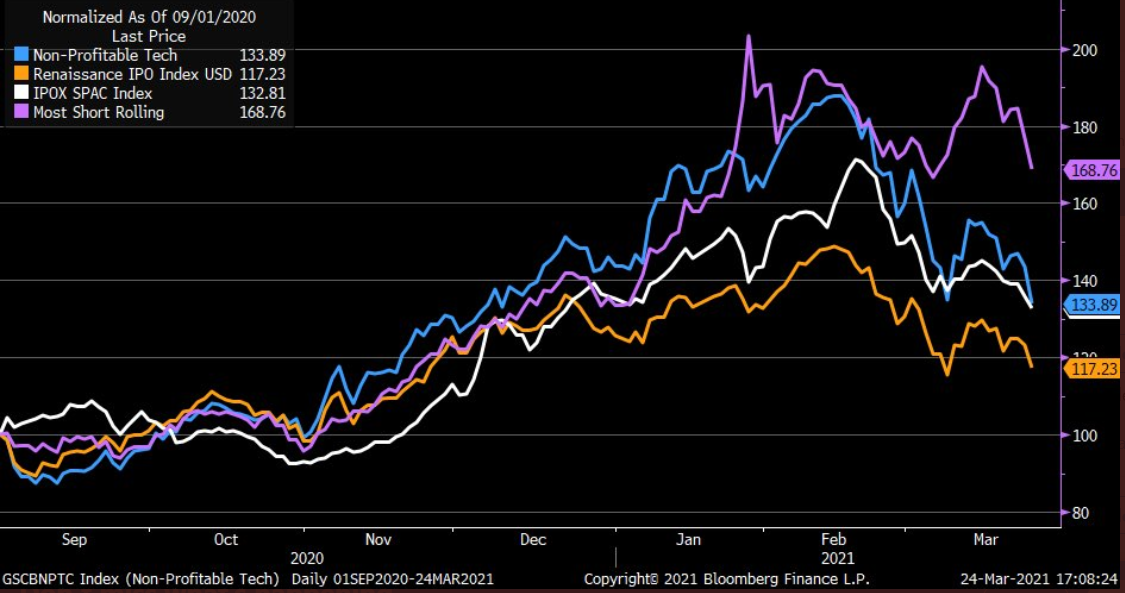
Influencing retails’ behavior, speculative stocks are now bubbling beneath the surface. If you analyze the chart below, you can see that the Renaissance IPO index, the SPAC index, non-profitable tech and a basket of the most-shorted stocks have all broken down.
 Source: Liz Ann Sonders
To that point, I warned on Mar. 22 that Big Tech is slowly letting the air out of the S&P 500’s balloon.
I wrote:
The NASDAQ Composite – which led equities’ rally in 2020 – has become a drastic underperformer. A mile away from new highs, not only has equities’ leadership changed, the NASDAQ Composite could be in the early innings of forming a bearish head and shoulders pattern.
Please see below:
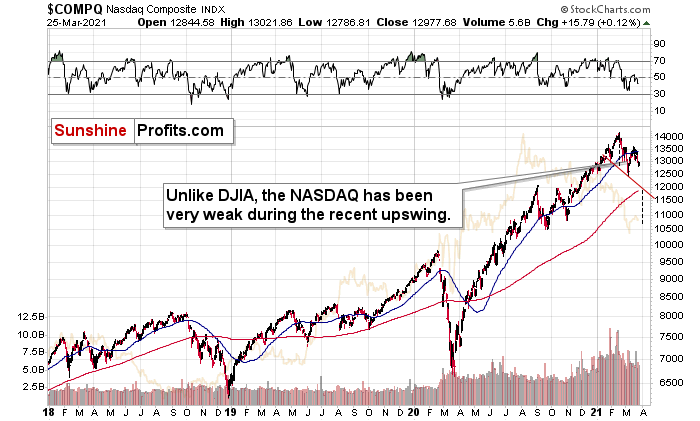
For context, the potential H&S pattern is still relatively immature. But if the NASDAQ Composite breaks below ~12,000 (the neck level), a drawdown to ~10,500 (the mid-2020 lows) could be next in line. Remember, the six largest companies in the NASDAQ Composite – Apple, Microsoft, Amazon, Tesla, Facebook and Alphabet – are also the six largest companies in the S&P 500. Thus, a drawdown of the former will weigh heavily on the latter. Likewise, a potential equity rout is profoundly bearish for the PMs, as silver and the miners will likely be the hardest hit.
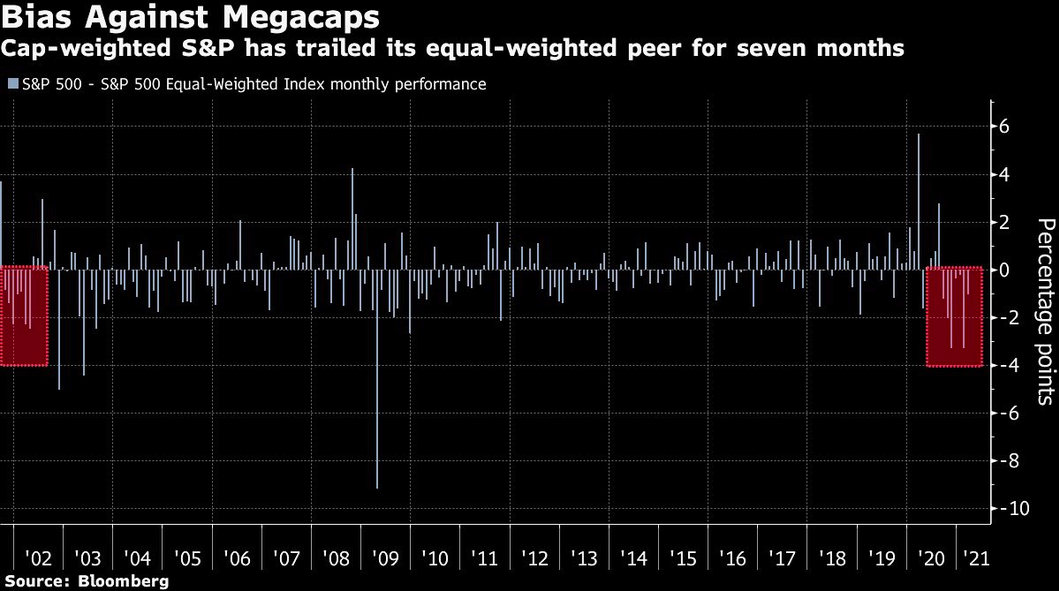
And because where there’s smoke there’s fire, the S&P 500 equal-weight index has outperformed the S&P 500 – a market-cap weighted index where the six names above have the most influence – for seven-straight months. To highlight the significance, it’s the longest streak since the dot-com bust.
Please see below:
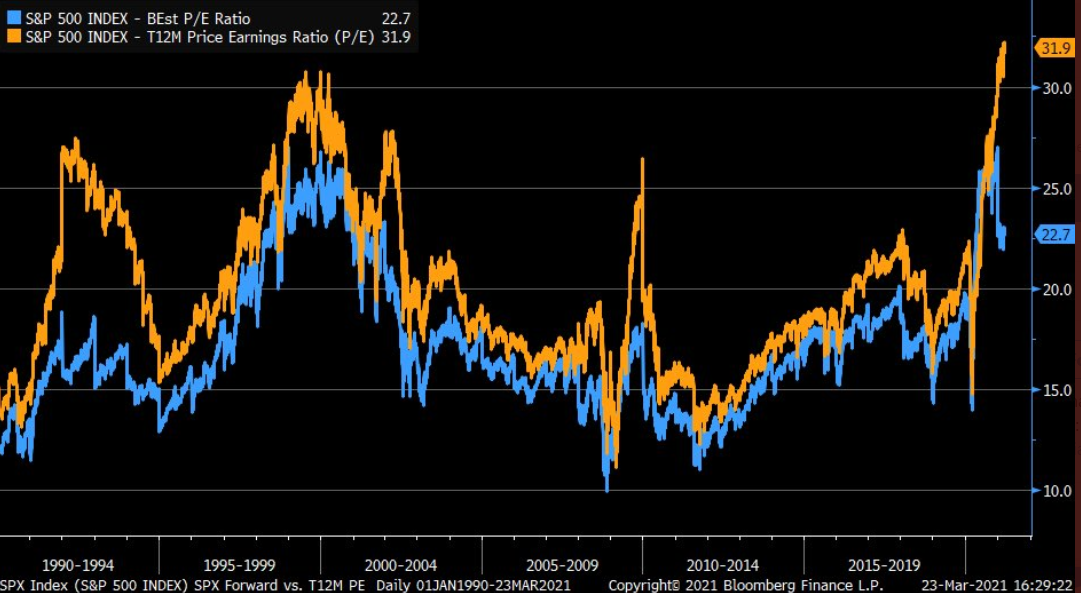
In addition, while the S&P 500’s forward price-to-earnings ratio (P/E) is more than 28% above its five-year average (17.7x) and nearly 44% above its 10-year average (15.8x) (Source: FactSet), the S&P 500’s trailing P/E is by-far the highest on record.
Please see below:
 Source: Liz Ann Sonders
For context, I wrote previously:
Forward P/E estimates compare current stock prices to analysts’ forecasted earnings per share (EPS) over the next 12 months. Conversely, trailing P/E’s compare current stock prices to companies’ actual EPS over the prior 12 months.
Thus, even if we take analysts’ estimates at face value, the S&P 500 would have to decline by more than 22% to reconnect with its five-year average forward P/E. Furthermore, if analysts’ optimistic estimates don’t come to fruition, the S&P 500 would have to decline by more than 32% to reconnect with its five-year average trailing P/E.
If not ... Bank of America suggests that investors should brace for a 2% return (CAGR) over the next 10 years.
Please see below:
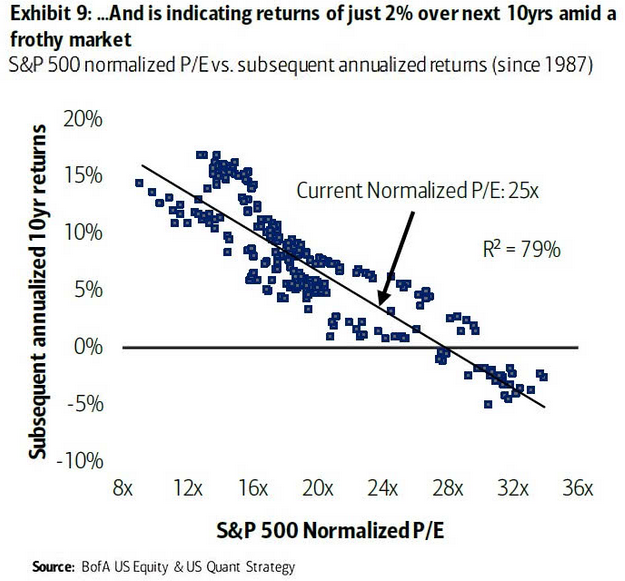
For context, a ‘normalized’ P/E excludes non-recurring items from the denominator (adjusted EPS). And with a current normalized P/E of 25x, even long-term returns are essentially non-existent.
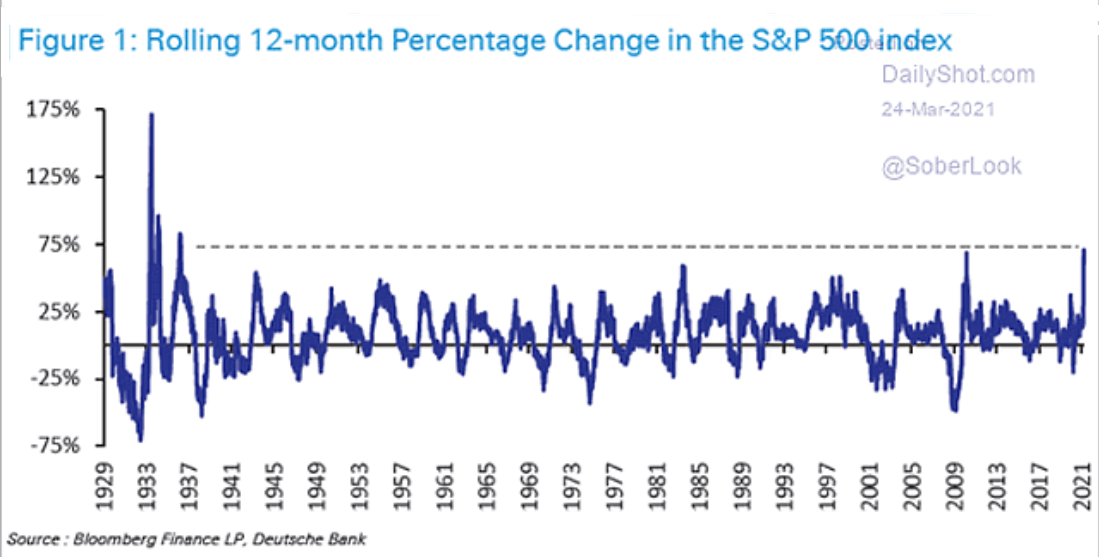
More importantly though, short-and-medium term returns don’t materialize so smoothly. And because the S&P 500 just recorded its highest 12-month percentage change since 1936, notice below how large aberrations are often followed by large reversions?
However, if history is any indication, investors refrain from pricing in risk until it’s too late. Case in point: U.S. high yield bond issuance hit another record in Q1:2021.
Please see below:
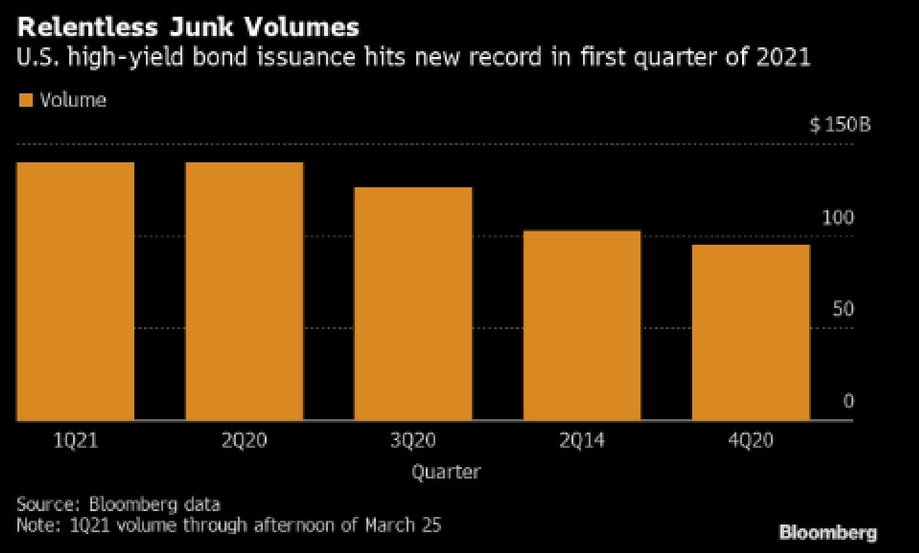
Funny, I warned on Mar. 24 that U.S. high yield credit spreads could be about to sneak up on investors.
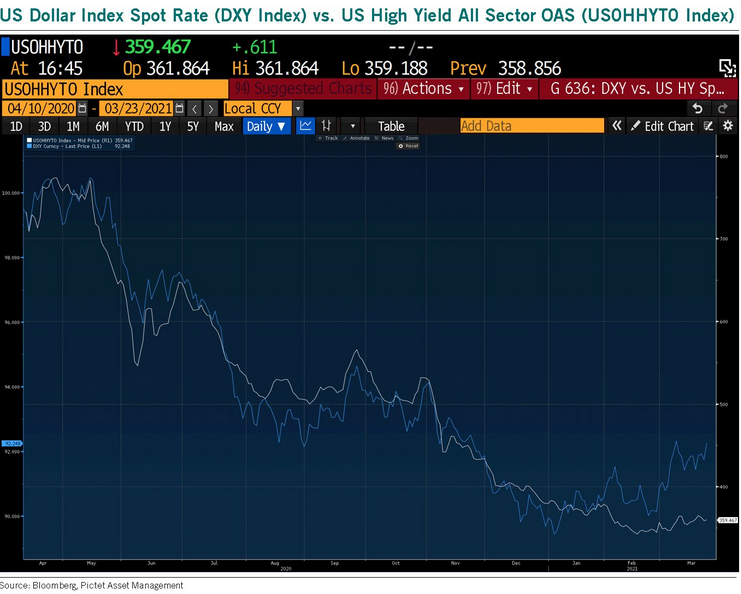
I wrote:
U.S. high yield credit spreads tend to track the performance of the USD Index. On a downward spiral since April 2020, if you analyze the right side of the chart, you can see that the USD Index has already begun to decouple. Thus, if U.S. high yield credit spreads follow, the move will likely raise alarm bells across U.S. equities.
As another short-term variable, pension rebalancing is scheduled to occur by the end of the month. To maintain target weights (say 60/40), pension funds have to sell stocks (after rallies) and buy bonds. And because pension funds are materially overweight stocks – with cash levels also at historic lows – it could result in some near-term selling pressure.
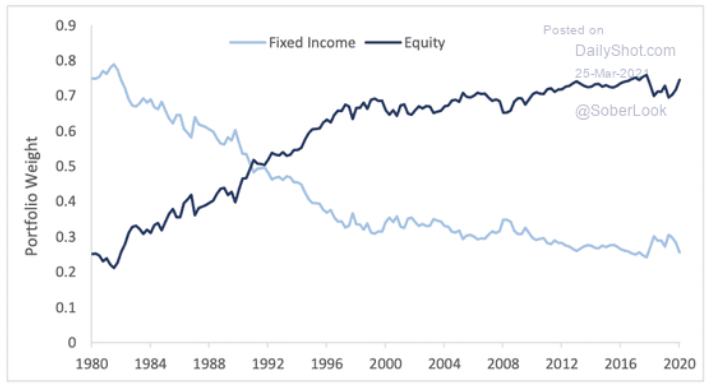 Source: The Daily Shot
In conclusion, the PMs remain destined for devaluation. And if equity weakness enters the equation, it will make the drawdown all the more painful. Moreover, while market participants are fine with looking the other way, large intraday price swings aren’t indicative of a healthy market. In addition, when you combine record valuations with the fact that ‘coronavirus variants’ and ‘mutations’ are increasingly making headlines, investors are perfectly positioned for an environment that’s far from perfect. As a result, the PMs are likely to suffer another meaningful slide before they find a lasting bottom.
Overview of the Upcoming Part of the Decline
- It seems very likely to me that we are already after the initial bottom and the initial correction. If not, then it seems likely to me that the corrective upswing will be completed within a week. It’s more likely that the next big move lower is already underway, though.
- After miners slide once again in a meaningful and volatile way, but silver doesn’t (and it just declines moderately), I plan to switch from short positions in miners to short positions in silver (this could take another 1-2 weeks to materialize). I plan to exit those short positions when gold shows substantial strength relative to the USD Index, while the latter is still rallying. This might take place with gold close to $1,450 - $1,500 and the entire decline (from above $1,700 to about $1,475) would be likely to take place within 1-12 weeks and I would expect silver to fall hardest in the final part of the move. This moment (when gold performs very strongly against the rallying USD and miners are strong relative to gold – after gold has already declined substantially) is likely to be the best entry point for long-term investments in my view. This might happen with gold close to $1,475, but it’s too early to say with certainty at this time. In other words, the entire decline could take between 1 and 12 weeks, while silver declines occuring particularly fast in the final 1-2 weeks.
- If gold declines even below $1,500 (say, to ~$1350 or so), then it could take another 10 weeks or so for it to bottom, but this is not what I view as a very likely outcome.
- As a confirmation for the above, I will use the (upcoming or perhaps we have already seen it?) top in the general stock market as the starting point for the three-month countdown. The reason is that after the 1929 top, gold miners declined for about three months after the general stock market started to slide. We also saw some confirmations of this theory based on the analogy to 2008. All in all, the precious metals sector would be likely to bottom about three months after the general stock market tops . If the mid-February 2020 top was the final medium-term top (based on NASDAQ’s top, then it seems that we might expect the precious metals sector to bottom in mid-May or close to May’s end. If, however, the mid-March 2020 top was the final medium-term top (based on the S&P 500), then we might expect the precious metals sector to bottom in mid-June or close to June’s end.
- The above is based on the information available today and it might change in the following days/weeks.
Letters to the Editor
Q: Dear PR,
You must be tickled pink. How long have you been writing of a dollar re-asserting itself. Well...you have earned the right to be the smuggest man in town – “The cat that got the cream” as my late mother would say. This has caught a lot of people off-guard. And if I am right, there will be a rush to exit the shorts and buy the USD which will put rocket fuel under this move. THIS was the short-squeeze...NOT silver. I imagine DXY will spoil the equity party too and that, along with the bond market, could put a landline under the S&P 500 that would put nails in the miners’ coffin...exactly as you have foretold. I eagerly look forward to your daily missive. Quite apart from profiting, I am learning more from you than I learned during a 38-year career as a London Wealth Manager. The miners are rolling over and gold is still deluded. When gold tips below $1,700 and the GDX falls below £31 (approx. $42.70) it will be like opening a trap-door to our short riches. Silver will have a hissy fit and the WSB (/WallStreetBets) lads will lose their stimulus money. I have taken to watching DXY, the gold & silver futures, GDX, GDJX, SLV and SILJ like a hawk. I have begun to see weakness and when these things are out of whack occasionally. Incidentally, FNV and GOLD (Barrick) have been hammered to death. Would these be on a shopping list when this correction is over? Some of the juniors have fared OK...SO FAR
If we do manage to get into the LOW ZONE of the GDX between $16-$23...that will be like printing our own money.
Thank you for your dedication and expertise.
A: Thank you very much! I’m flattered by your comments, and I’m happy to read that you’re not only making profits, but that you appreciate the insights for their educational value. My purpose (why) is to discover and share knowledge with people so that they can improve their lives – and what you wrote suggests that I’m going in the right direction with my actions – thank you again.
Will FNV and GOLD be on the shopping list? I don’t know. I’ll likely focus on the mining stock ETF at the very bottom to simplify the purchase, but then I might sell it in order to buy a basket of individual miners. I’ll likely choose the miners that will be providing the biggest leverage and exposure to the underlying metals at that time and I’ll use my tools for that: the Golden StockPicker and Silver StockPicker.
I liked your phrase so much that I placed it in bold: It’s not yet about the #silversqueeze, but about the #USDsqueeze at this time. “Opening the trap door or our short riches” is also a very good phrase. I couldn’t have said it better myself. Still, I wouldn’t be me if I didn’t accompany this with a warning – please note that even though the situation looks extremely favorable, it doesn’t mean that it’s 100% certain that things will develop in this way. Every now and then, the unlikely happens in all markets, and one needs to be sure that they are not overinvested or overleveraged in a given trade – meaning they have exactly the exposure that they want (and can afford) to have, not one based on how excited they get about a given price move. Please check out the simulation of one’s portfolio values in the “The KEY Issue – Position Sizes” section of our Beginner’s Guide for details (the advanced traders and investors would likely enjoy reviewing this simulation as well).
Q: I'd like to join the short play (I hope I'm not too late to the party), but I would rather go with a CAD (Canadian) ETF. I found the HGD ETF (Horizons) – what would be the exit price then? Thanks a lot!
A: It’s a tough call due to the currency exchange risk, so I’d pay attention to the price levels in the GDX and I’d exit the position based on the latter. I can’t advise, but I’ll provide you with an approximate target.
If the GDX is to decline by the same percent of its value on each day for the next 30 trading days, and move from $32.24 to $20.2, then it would have to decline by about 1.5463% each day. Doubling this gets us about 3.0926%. If the HGD was to rally for 30 trading days, gaining 3.0926% on each day, starting from 11.43, it would rally to 11.43 x (1+0.030926)^30 = about 28.50.
And no, I don’t think you’re too late to the party – a sizable part of the decline is over, but it’s the biggest part that still seems to be ahead.
Summary
To summarize, the PMs’ medium-term decline is well underway, and based on the recent performance of the USD Index, gold and mining stocks, it seems that the corrective upswing is already over (or about to be over). The next big move lower seems to be already underway or about to start.
In addition, because we’re likely entering the “winter” part of the Kondratiev cycle (just like in 1929 and then the 1930s), the outlook for the precious metals’ sector remains particularly bearish during the very first part of the cycle, when cash is king.
The confirmed breakout in the USD Index is yet another confirmation of the bearish outlook for the precious metals market.
After the sell-off (that takes gold to about $1,450 - $1,500), we expect the precious metals to rally significantly. The final part of the decline might take as little as 1-5 weeks, so it's important to stay alert to any changes.
Most importantly, please stay healthy and safe. We made a lot of money last March and it seems that we’re about to make much more on this March decline, but you have to be healthy to enjoy the results.
As always, we'll keep you - our subscribers - informed.
By the way, we’re currently providing you with a possibility to extend your subscription by a year, two years or even three years with a special 20% discount. This discount can be applied right away, without the need to wait for your next renewal – if you choose to secure your premium access and complete the payment upfront. The boring time in the PMs is definitely over and the time to pay close attention to the market is here. Naturally, it’s your capital, and the choice is up to you, but it seems that it might be a good idea to secure more premium access now, while saving 20% at the same time. Our support team will be happy to assist you in the above-described upgrade at preferential terms – if you’d like to proceed, please contact us.
To summarize:
Trading capital (supplementary part of the portfolio; our opinion): Full speculative short positions (300% of the full position) in mining stocks are justified from the risk to reward point of view with the following binding exit profit-take price levels:
Mining stocks (price levels for the GDXJ ETF): binding profit-take exit price: $24.12; stop-loss: none (the volatility is too big to justify a stop-loss order in case of this particular trade)
Alternatively, if one seeks leverage, we’re providing the binding profit-take levels for the JDST (2x leveraged) and GDXD (3x leveraged – which is not suggested for most traders/investors due to the significant leverage). The binding profit-take level for the JDST: $39.87; stop-loss for the JDST: none (the volatility is too big to justify a SL order in case of this particular trade); binding profit-take level for the GDXD: $94.87; stop-loss for the GDXD: none (the volatility is too big to justify a SL order in case of this particular trade).
For-your-information targets (our opinion; we continue to think that mining stocks are the preferred way of taking advantage of the upcoming price move, but if for whatever reason one wants / has to use silver or gold for this trade, we are providing the details anyway.):
Silver futures upside profit-take exit price: unclear at this time - initially, it might be a good idea to exit, when gold moves to $1,512.
Gold futures upside profit-take exit price: $1,512.
Long-term capital (core part of the portfolio; our opinion): No positions (in other words: cash
Insurance capital (core part of the portfolio; our opinion): Full position
Whether you already subscribed or not, we encourage you to find out how to make the most of our alerts and read our replies to the most common alert-and-gold-trading-related-questions.
Please note that we describe the situation for the day that the alert is posted in the trading section. In other words, if we are writing about a speculative position, it means that it is up-to-date on the day it was posted. We are also featuring the initial target prices to decide whether keeping a position on a given day is in tune with your approach (some moves are too small for medium-term traders, and some might appear too big for day-traders).
Additionally, you might want to read why our stop-loss orders are usually relatively far from the current price.
Please note that a full position doesn't mean using all of the capital for a given trade. You will find details on our thoughts on gold portfolio structuring in the Key Insights section on our website.
As a reminder - "initial target price" means exactly that - an "initial" one. It's not a price level at which we suggest closing positions. If this becomes the case (like it did in the previous trade), we will refer to these levels as levels of exit orders (exactly as we've done previously). Stop-loss levels, however, are naturally not "initial", but something that, in our opinion, might be entered as an order.
Since it is impossible to synchronize target prices and stop-loss levels for all the ETFs and ETNs with the main markets that we provide these levels for (gold, silver and mining stocks - the GDX ETF), the stop-loss levels and target prices for other ETNs and ETF (among other: UGL, GLL, AGQ, ZSL, NUGT, DUST, JNUG, JDST) are provided as supplementary, and not as "final". This means that if a stop-loss or a target level is reached for any of the "additional instruments" (GLL for instance), but not for the "main instrument" (gold in this case), we will view positions in both gold and GLL as still open and the stop-loss for GLL would have to be moved lower. On the other hand, if gold moves to a stop-loss level but GLL doesn't, then we will view both positions (in gold and GLL) as closed. In other words, since it's not possible to be 100% certain that each related instrument moves to a given level when the underlying instrument does, we can't provide levels that would be binding. The levels that we do provide are our best estimate of the levels that will correspond to the levels in the underlying assets, but it will be the underlying assets that one will need to focus on regarding the signs pointing to closing a given position or keeping it open. We might adjust the levels in the "additional instruments" without adjusting the levels in the "main instruments", which will simply mean that we have improved our estimation of these levels, not that we changed our outlook on the markets. We are already working on a tool that would update these levels daily for the most popular ETFs, ETNs and individual mining stocks.
Our preferred ways to invest in and to trade gold along with the reasoning can be found in the how to buy gold section. Furthermore, our preferred ETFs and ETNs can be found in our Gold & Silver ETF Ranking.
As a reminder, Gold & Silver Trading Alerts are posted before or on each trading day (we usually post them before the opening bell, but we don't promise doing that each day). If there's anything urgent, we will send you an additional small alert before posting the main one.
Thank you.
Przemyslaw Radomski, CFA
Founder, Editor-in-chief

