

Briefly: in our opinion, full (300% of the regular position size) speculative short positions in mining stocks are justified from the risk/reward point of view at the moment of publishing this Alert.
Not a single market can move in a straight line without corrections, and the same is true for ratios. Gold miners were finally strong relative to gold yesterday, but let’s keep in mind that one swallow doesn’t make a summer; especially given that key developments were not undone.
In particular, the broad inverse head-and-shoulders pattern in the USD Index was not invalidated.
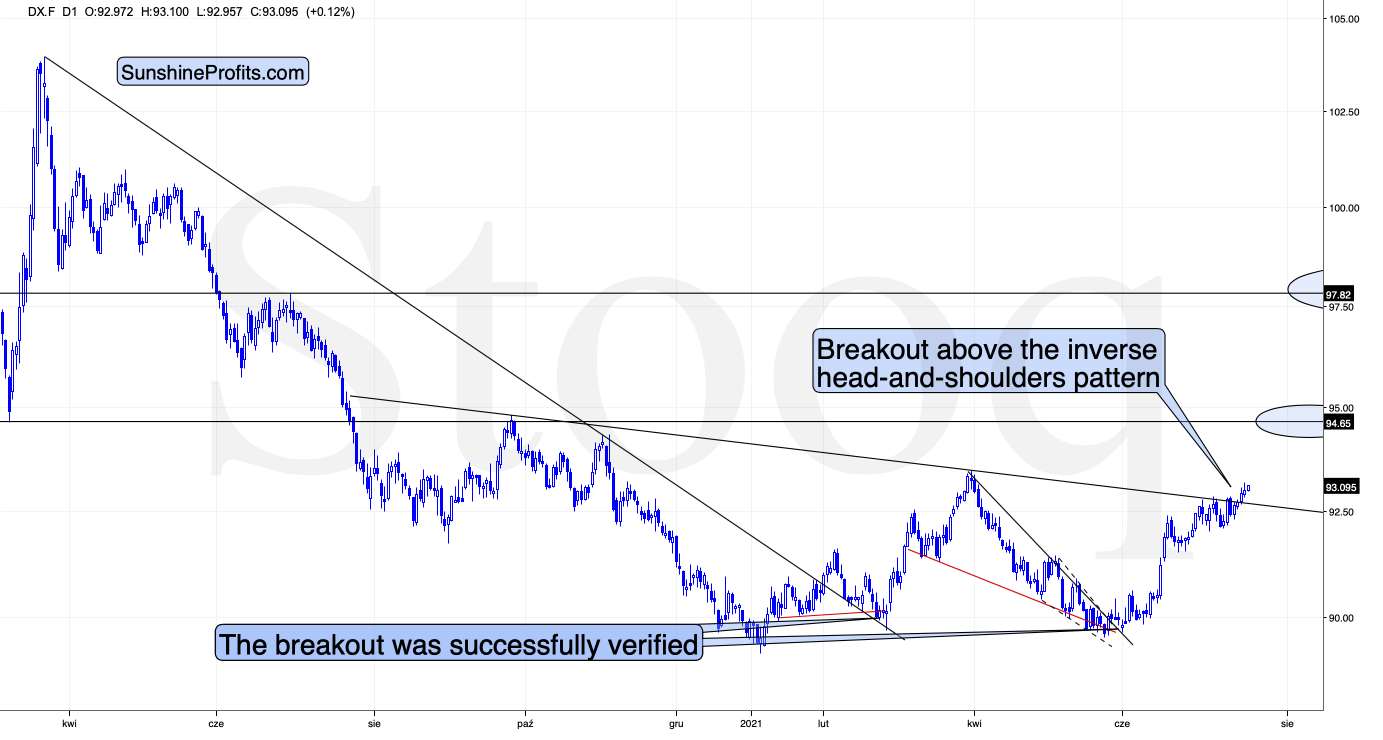
Conversely, it was confirmed because the USD Index just closed above the neck level of the pattern for the third consecutive day. This means that while yesterday’s session might have appeared bearish at first sight, it was actually very bullish for the USDX. Based on the inverse H&S pattern, it’s now likely to move much higher.
Let’s keep in mind that the USDX’s breakout was not accidental, nor was it based on geopolitical news (the latter tends to trigger temporary moves that are then reversed). Additionally, it was preceded by a consolidation. Consequently, it seems that this breakout is a true one and that it will indeed be followed by much higher USDX values. The previous highs at about 94.5 are the initial upside target, but based on the inverse H&S pattern, the USDX is likely to rally to about 98.
Therefore, what just happened (the confirmed breakout above the formation’s neckline) has really bullish implications for the U.S. currency. And since the latter tends to move in the opposite direction to gold, silver, and mining stocks, it’s also very bearish for them.
That would be enough on its own to make the outlook for the PMs bearish, but we have many more bearish indications, and some of them are truly profound. The most bearish confirmation of the bearish price prediction for gold doesn’t come from the USD Index but from the extreme underperformance of gold stocks relative to gold.
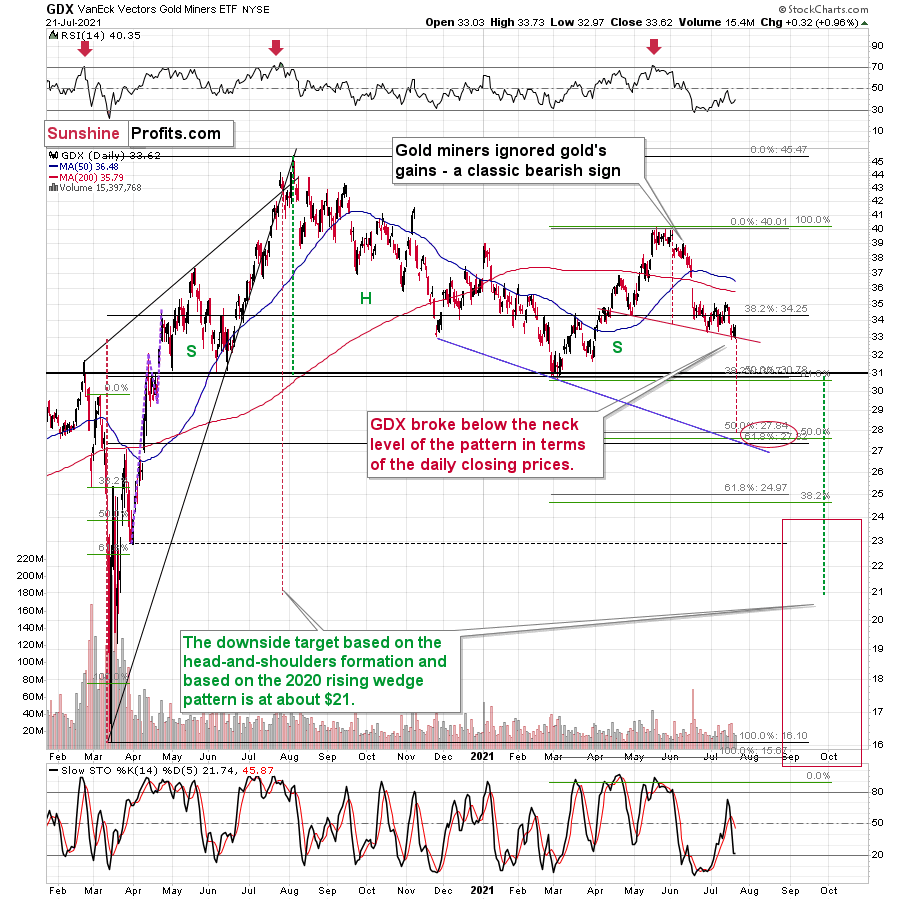
During yesterday’s session, gold miners (both: seniors and juniors) moved somewhat higher, but it doesn’t seem to be a game changer – it’s rather just a correction within an established trend.
Miners take the general stock market’s lead every now and then, and yesterday was the day when stocks moved higher. Again, nothing uncommon.
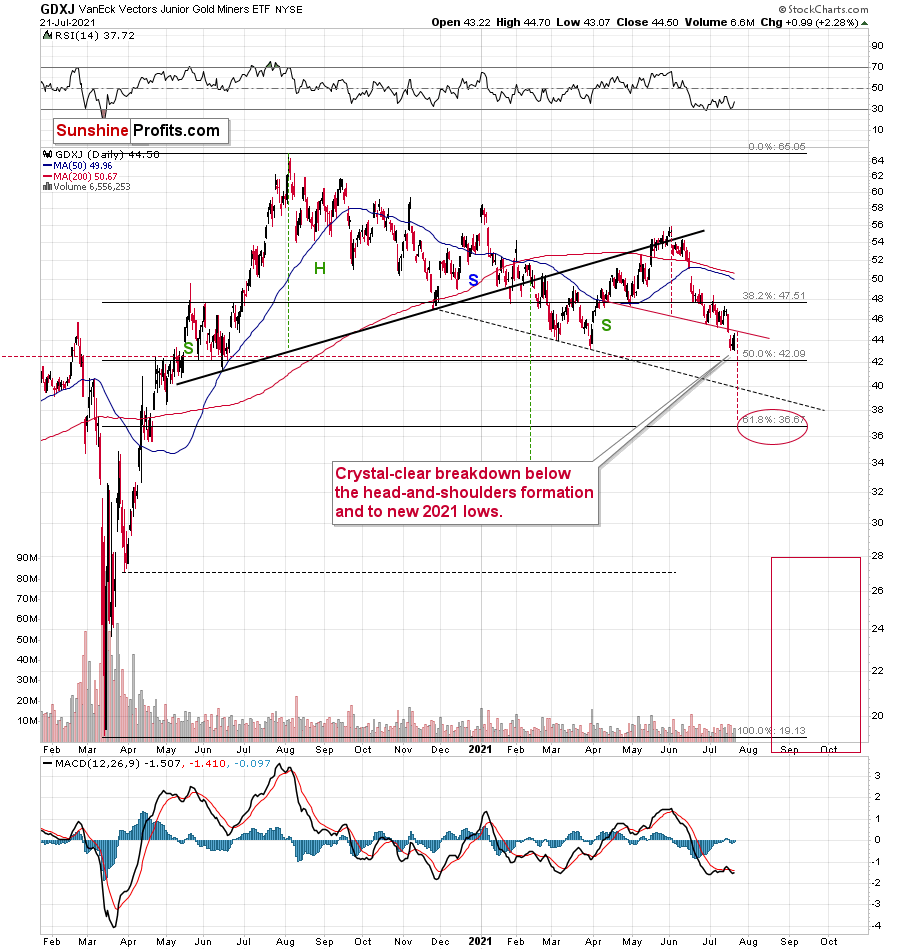
Let’s keep in mind that despite yesterday’s move higher, the proxy for junior mining stocks – the GDXJ ETF – didn’t invalidate its breakdown below the head and shoulders pattern. Conversely, it just moved back to the neck level, likely providing the final verification of the breakdown.
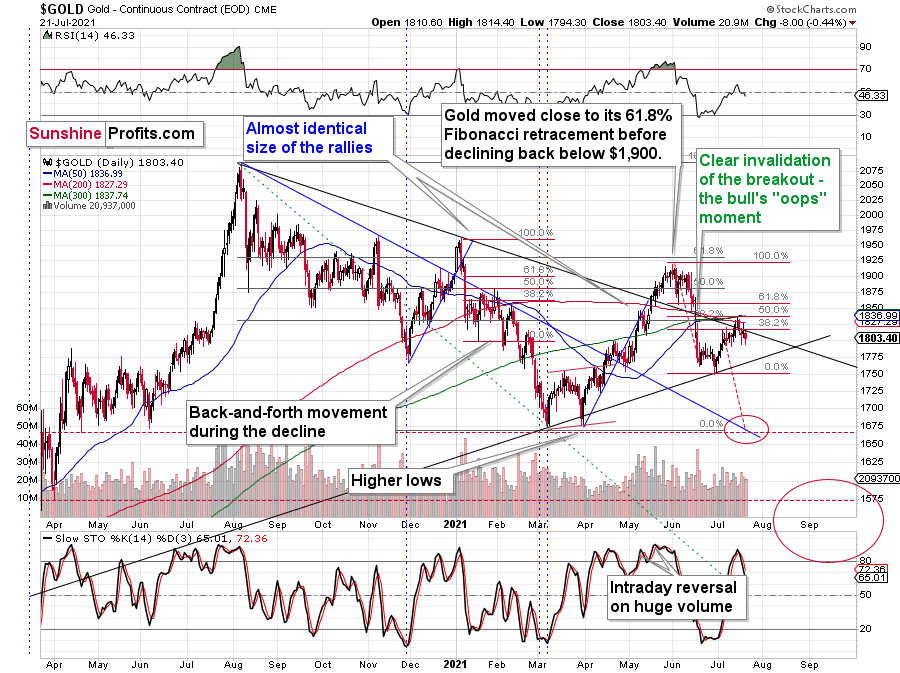
Gold itself moved slightly lower yesterday, which didn’t change much. The self-similarity to what happened in 2012 and 2013 (and to some extent in 2008) remains intact, and the implications remain very bearish for the following weeks.
Having said that, let’s take a look at the markets from a more fundamental point of view.
A Fog of Confusion
With investors’ manic mood swings whipsawing the U.S. yield curve in-and-out of hysteria, gold suffered another dose of reality on Jul. 21. And with inflation surging and the U.S. 10-Year Treasury yield still extremely oversold, the yellow metal could be dodging even more bullets in the coming weeks.
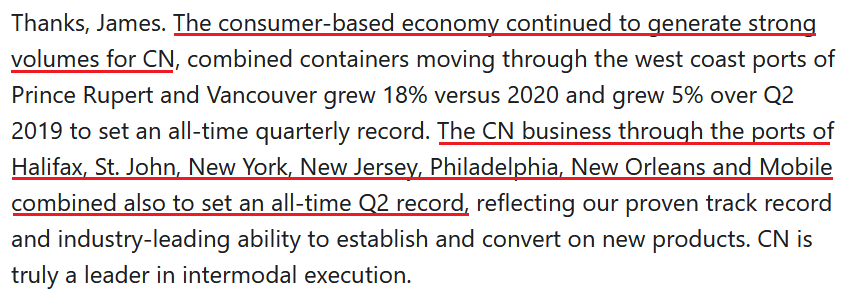
Case in point: while over-positioning, the U.S. Federal Reserve’s (FED) hawkish shift, unprecedented reverse repos (another $886.206 billion sold on Jul. 21) and the Delta variant have rocked investors’ boats, the reality on the ground is much different. To explain, with Canadian National Railway (CN) SVP James Cairns telling analysts on Jul. 20 that “during Q2 we saw the more balanced demand recovery that we expected,” the U.S. 10-Year Treasury yield is still underestimating the strength of the U.S. economic recovery.
For context, CN is a leading North American transportation and logistics company that transports more than C$250 billion worth of goods annually across a rail network of approximately 20,000 route-miles spanning Canada and mid-America.
Please see below:
 Source: CN/The Motley Fool
Moreover, another excerpt from the conference call read:
“Labor and fringe benefit expense was up 28% versus last year. This was mostly driven by increased wages due to a 9% higher average headcount and higher incentive compensation. Fuel expense was up 86% driven by a 76% increase in price and a 14% higher workload, partially offset by another solid fuel efficiency improvement of 2%.”
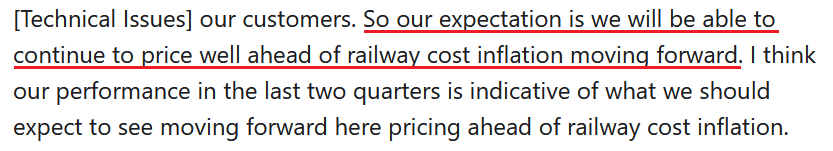
On top of that, with CEO Jean-Jacques Ruest noting that “there is rail inflation [and that] eventually you will see it in the all-inclusive rail index of AAR because there is a bit of a lag in that index,” how is the company responding to the inflationary pressures?
 Source: CN/The Motley Fool
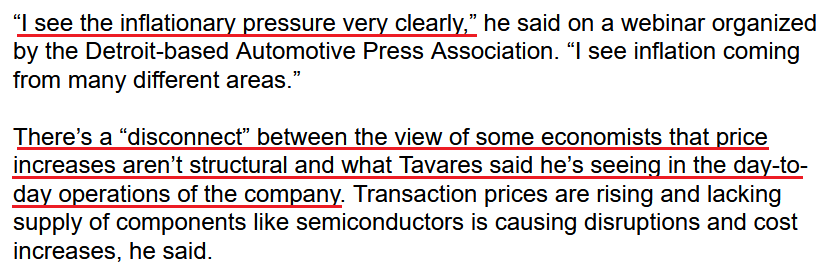
Singing a similar tune, Stellantis NV CEO Carlos Tavares said on Jul. 21 that rising raw material costs and a shortage of semiconductors could uplift inflation well into next year. For context, Stellantis NV is a European automaker that was created following the merger of PSA Group and Fiat Chrysler in 2021.
Please see below:
 Source: Bloomberg
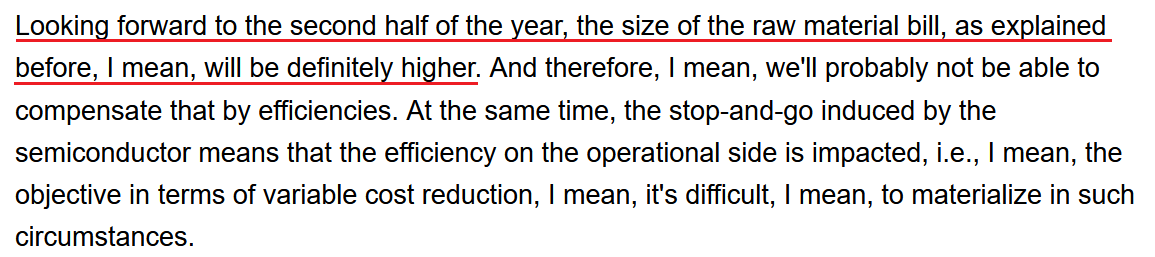
Likewise, Daimler AG Chairman Ola Kallenius said the following during the automaker’s Q2 earnings call on Jul. 21:
“On the raw material, you're right. The headwinds we now see moving forward are stronger than what we assumed so far. We said, I think, at the beginning of the year, we could probably have on the full year 0.5% in terms of cost headwind. I mean, now you could hear us, I mean, saying 1% in the second half. And actually, I mean, we can see that all in all, in cars and vans, as well as in trucks and buses.”
He added:
 Source: Daimler/Seeking Alpha
Inflation and Commodities – Do We Still Fight for Lumber?
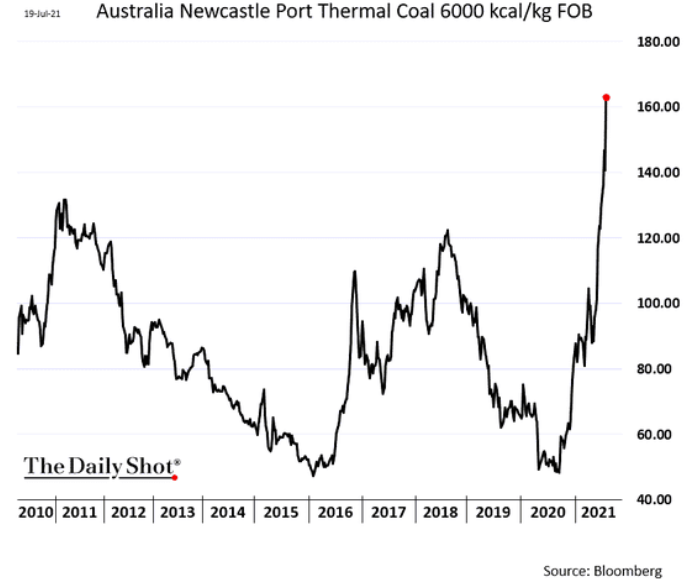
Furthermore, while I’ve been warning for months that inflationary pressures will likely force the FED’s hand in September, cost-push inflation remains alive and well. For example, while crude suffered a freak-out on Jul. 19 and lumber has fallen off a cliff, steel remains in the clouds and coal isn’t far behind.
Please see below:
In addition, with commodity producers still skittish over the wreckage that occurred during the global financial crisis (GFC), the group has been extremely cautious this time around. And with a lack of capital investments severely constraining production, the supply/demand equilibrium remains completely out of whack.
Please see below:
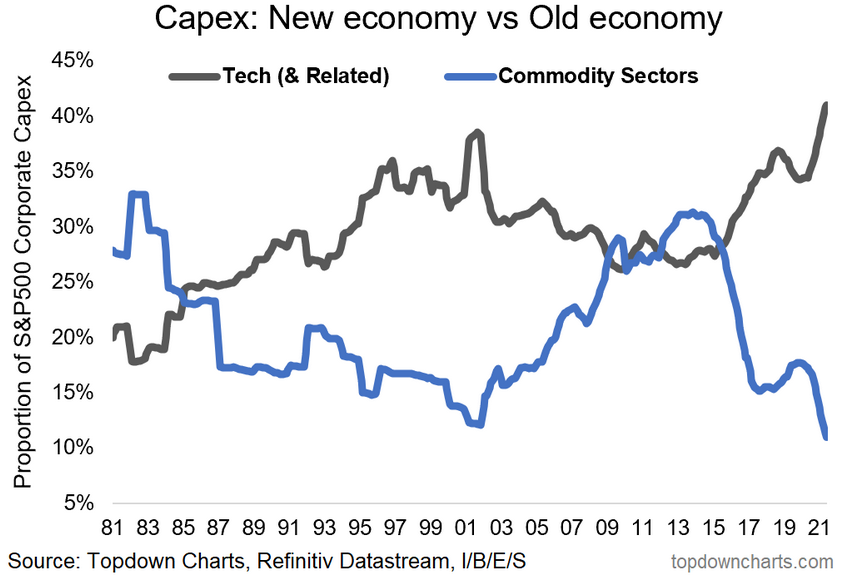
To explain, the black line above tracks capital investments made by technology-related firms in the S&P 500, while the blue line above tracks capital investments made by commodity producers in the S&P 500. If you analyze the right side of the chart, you can see that commodity cap-ex is at a 40-year low. On the flip side, technology-related firms are expanding at a pace that exceeds the dot-com bubble. As a result, not only could a Big Tech tirade upend the PMs, but realigning U.S. interest rates with the economic realities could be just as damaging.
To that point, BHP Group, the world’s largest mining company, released its full-year operational review on Jul. 20. For context, CEO Mike Henry said back in March that “there’s really no point in chasing production. The industry has a good track record of being quite a pro-cyclist, and it has ended in tears quite often.”
And with that, while BHP had 18 major projects in motion a decade ago, only two are in development now: the Mad Dog Phase 2 project in the Gulf of Mexico (24% stake) and its Jansen Potash project in Saskatchewan, Canada. Thus, please have a look at BHP’s forward guidance:
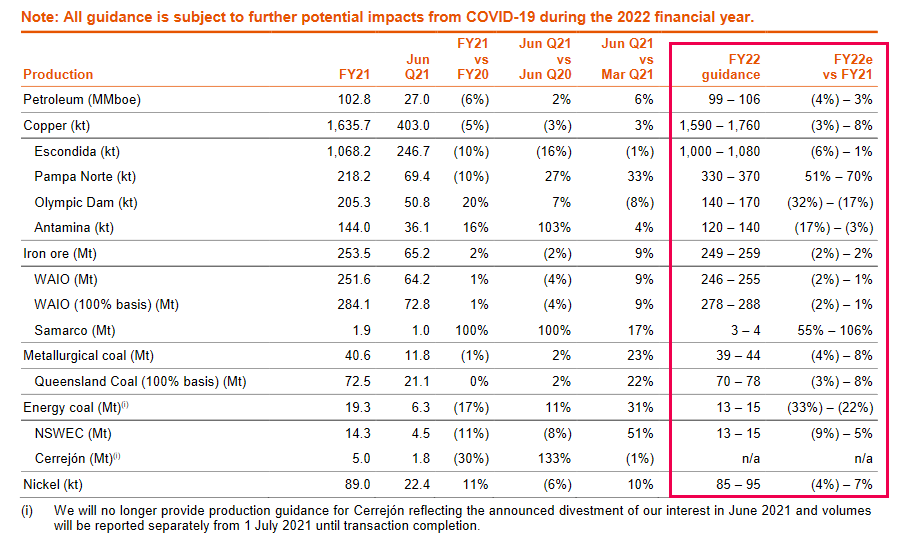 Source: BHP
To explain, if you analyze the red box above, you can see that BHP’s “FY22 guidance” includes lower-to-roughly-flat production. If you turn to the first column from the right, you can see that petroleum, copper, iron ore, coal and nickel could experience negative year-over-year (YoY) production growth (on the low-end) to low/mid-single digits production growth (on the high-end).
The bottom line? While cost-push inflation has been the main driver of the inflationary surge and the bond market is all-in on the FED’s “transitory” narrative, fresh commodities supply is not coming to the FED’s rescue.
10-Year Treasury: Goldman Sachs Doubles Down
Finally, while the U.S. 10-Year Treasury yield continues to weigh the FED’s likely taper (which would slow economic growth and reduce inflation) with the effects of the supply chain disruptions that continue underwriting the inflationary surge, Goldman Sachs has doubled down on its year-end forecast.
Please see below:
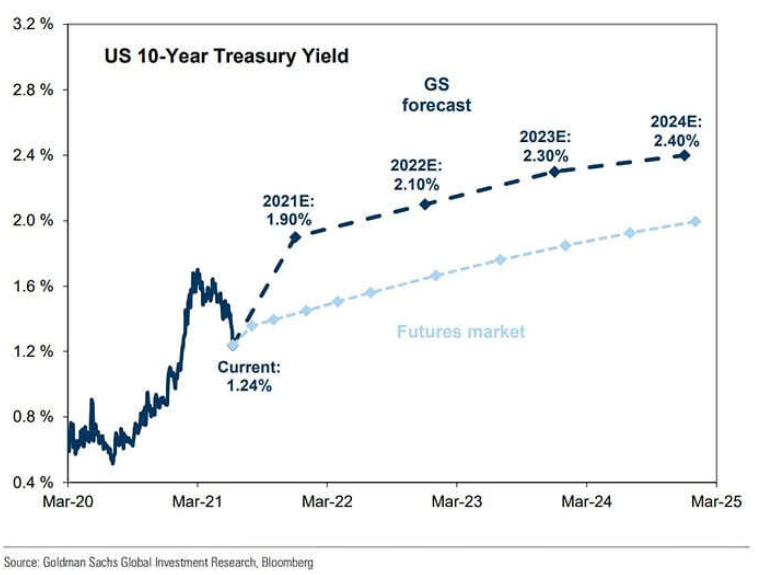
Despite the recent malaise, the U.S. investment bank expects the U.S. 10-Year Treasury yield to end the year at 1.90% (the dark blue line above). Moreover, with the futures market implying a year-end target of roughly 1.40% (the light blue line above), Goldman Sachs still sees upside risk to the consensus expectation.
In conclusion, the PMs remain in no man’s land, as the front-end and the back-end of the U.S. yield curve have the potential to push them over a cliff. Regarding the former, with the FED likely to announce its taper timeline in September, rising short-term interest rates reduce the PMs’ relative appeal. Regarding the latter, if the vaccines prove effective and reduce the impact of the Delta variant (which data shows that they already have), long-term interest rates are massively underestimating the inflationary pressures and the prospective strength of the U.S. economy. Thus, any way you slice it, the medium-term outlook for the PMs remains profoundly bearish (the long-term outlook is bullish, though).
Overview of the Upcoming Part of the Decline
- The corrective upswing in gold might already be over, and another huge decline is likely just around the corner. In fact, it seems to be well underway in the case of mining stocks, especially junior miners.
- After miners slide in a meaningful and volatile way, but silver doesn’t (and it just declines moderately), I plan to switch from short positions in miners to short positions in silver. At this time, it’s too early to say at what price levels this would take place – perhaps with gold close to $1,600. I plan to exit those short positions when gold shows substantial strength relative to the USD Index, while the latter is still rallying. This might take place with gold close to $1,350 - $1,500 and the entire decline (from above $1,900 to about $1,475) would be likely to take place within 6-20 weeks, and I would expect silver to fall the hardest in the final part of the move. This moment (when gold performs very strongly against the rallying USD and miners are strong relative to gold – after gold has already declined substantially) is likely to be the best entry point for long-term investments, in my view. This might also happen with gold close to $1,475, but it’s too early to say with certainty at this time.
- As a confirmation for the above, I will use the (upcoming or perhaps we have already seen it?) top in the general stock market as the starting point for the three-month countdown. The reason is that after the 1929 top, gold miners declined for about three months after the general stock market started to slide. We also saw some confirmations of this theory based on the analogy to 2008. All in all, the precious metals sector would be likely to bottom about three months after the general stock market tops.
- The above is based on the information available today, and it might change in the following days/weeks.
Please note that the above timing details are relatively broad and “for general overview only” – so that you know more or less what I think and how volatile I think the moves are likely to be – on an approximate basis. These time targets are not binding or clear enough for me to think that they should be used for purchasing options, warrants or similar instruments.
Letters to the Editor
Q: Gold RSI 56, GDX RSI 36, DXY RSI 67, GDXJ RSI 30
This combination makes me think that the DXY will come down and gold & miners will go up in the short term. Could gold still go down in the short term, i.e., in a week? Or will it take some time? All my analysis knowledge was given to me by you – I’ve spent more than 4 years with you. Thanks for that. Please suggest.
A: Thank you, I’m very happy to have you aboard all those years – it seems that the most interesting part of the decade is still ahead.
The short-term RSI indications do indeed point to short-term corrections in the markets – the ones in the GDXJ and the USD Index, as they are at / close to being oversold / overbought, respectively. However, it seems to me that what we’re about to see is a medium-term move, not a short-term one. Both the USD Index and the GDXJ ETF have confirmed breakout/breakdown below their inverse/regular head-and-shoulders patterns, respectively, which means that they are now likely to move quite far without a meaningful correction. A comeback to the previously broken lines is natural, and that’s what we saw yesterday. This doesn’t change the previous trends, though. Consequently, I think that keeping the current short positions in the GDXJ intact is justified from the risk to reward point of view.
Summary
To summarize, it seems that gold has already formed its short-term top and – based i.a. on the completed inverse head-and-shoulders pattern in the USD Index – gold is likely to fall substantially in the following weeks. Gold stocks’ exceptionally weak performance has been indicating that for many weeks, and given juniors’ breakdown to new yearly lows, it seems that the storm has already begun.
It seems that our profits on the short position in the junior mining stocks are going to grow substantially in the following weeks.
After the sell-off (that takes gold to about $1,350 - $1,500), I expect the precious metals to rally significantly. The final part of the decline might take as little as 1-5 weeks, so it's important to stay alert to any changes.
Most importantly, please stay healthy and safe. We made a lot of money last March and this March, and it seems that we’re about to make much more on the upcoming decline, but you have to be healthy to enjoy the results.
As always, we'll keep you - our subscribers - informed.
By the way, we’re currently providing you with the possibility to extend your subscription by a year, two years or even three years with a special 20% discount. This discount can be applied right away, without the need to wait for your next renewal – if you choose to secure your premium access and complete the payment upfront. The boring time in the PMs is definitely over, and the time to pay close attention to the market is here. Naturally, it’s your capital, and the choice is up to you, but it seems that it might be a good idea to secure more premium access now while saving 20% at the same time. Our support team will be happy to assist you in the above-described upgrade at preferential terms – if you’d like to proceed, please contact us.
To summarize:
Trading capital (supplementary part of the portfolio; our opinion): Full speculative short positions (300% of the full position) in mining stocks are justified from the risk to reward point of view with the following binding exit profit-take price levels:
Mining stocks (price levels for the GDXJ ETF): binding profit-take exit price: $37.12; stop-loss: none (the volatility is too big to justify a stop-loss order in case of this particular trade)
Alternatively, if one seeks leverage, we’re providing the binding profit-take levels for the JDST (2x leveraged) and GDXD (3x leveraged – which is not suggested for most traders/investors due to the significant leverage). The binding profit-take level for the JDST: $15.96; stop-loss for the JDST: none (the volatility is too big to justify a SL order in case of this particular trade); binding profit-take level for the GDXD: $37.02; stop-loss for the GDXD: none (the volatility is too big to justify a SL order in case of this particular trade).
For-your-information targets (our opinion; we continue to think that mining stocks are the preferred way of taking advantage of the upcoming price move, but if for whatever reason one wants / has to use silver or gold for this trade, we are providing the details anyway.):
Silver futures upside profit-take exit price: unclear at this time - initially, it might be a good idea to exit, when gold moves to $1,683
Gold futures upside profit-take exit price: $1,683
HGD.TO – alternative (Canadian) inverse 2x leveraged gold stocks ETF – the upside profit-take exit price: $12.88
Long-term capital (core part of the portfolio; our opinion): No positions (in other words: cash
Insurance capital (core part of the portfolio; our opinion): Full position
Whether you already subscribed or not, we encourage you to find out how to make the most of our alerts and read our replies to the most common alert-and-gold-trading-related-questions.
Please note that we describe the situation for the day that the alert is posted in the trading section. In other words, if we are writing about a speculative position, it means that it is up-to-date on the day it was posted. We are also featuring the initial target prices to decide whether keeping a position on a given day is in tune with your approach (some moves are too small for medium-term traders, and some might appear too big for day-traders).
Additionally, you might want to read why our stop-loss orders are usually relatively far from the current price.
Please note that a full position doesn't mean using all of the capital for a given trade. You will find details on our thoughts on gold portfolio structuring in the Key Insights section on our website.
As a reminder - "initial target price" means exactly that - an "initial" one. It's not a price level at which we suggest closing positions. If this becomes the case (like it did in the previous trade), we will refer to these levels as levels of exit orders (exactly as we've done previously). Stop-loss levels, however, are naturally not "initial", but something that, in our opinion, might be entered as an order.
Since it is impossible to synchronize target prices and stop-loss levels for all the ETFs and ETNs with the main markets that we provide these levels for (gold, silver and mining stocks - the GDX ETF), the stop-loss levels and target prices for other ETNs and ETF (among other: UGL, GLL, AGQ, ZSL, NUGT, DUST, JNUG, JDST) are provided as supplementary, and not as "final". This means that if a stop-loss or a target level is reached for any of the "additional instruments" (GLL for instance), but not for the "main instrument" (gold in this case), we will view positions in both gold and GLL as still open and the stop-loss for GLL would have to be moved lower. On the other hand, if gold moves to a stop-loss level but GLL doesn't, then we will view both positions (in gold and GLL) as closed. In other words, since it's not possible to be 100% certain that each related instrument moves to a given level when the underlying instrument does, we can't provide levels that would be binding. The levels that we do provide are our best estimate of the levels that will correspond to the levels in the underlying assets, but it will be the underlying assets that one will need to focus on regarding the signs pointing to closing a given position or keeping it open. We might adjust the levels in the "additional instruments" without adjusting the levels in the "main instruments", which will simply mean that we have improved our estimation of these levels, not that we changed our outlook on the markets. We are already working on a tool that would update these levels daily for the most popular ETFs, ETNs and individual mining stocks.
Our preferred ways to invest in and to trade gold along with the reasoning can be found in the how to buy gold section. Furthermore, our preferred ETFs and ETNs can be found in our Gold & Silver ETF Ranking.
As a reminder, Gold & Silver Trading Alerts are posted before or on each trading day (we usually post them before the opening bell, but we don't promise doing that each day). If there's anything urgent, we will send you an additional small alert before posting the main one.
Thank you.
Przemyslaw Radomski, CFA
Founder, Editor-in-chief

