Briefly: in our opinion, full (300% of the regular position size) speculative short positions in mining stocks are justified from the risk/reward point of view at the moment of publishing this Alert. We are adjusting the exit levels for the leveraged ETNs, as they are closer to their targets when they were months ago and such better approximation is now possible.
Gold moved higher yesterday (Feb. 8), and so did silver and miners. At the same time, the USD Index moved lower. Did the above change anything in the outlook? Let’s check.
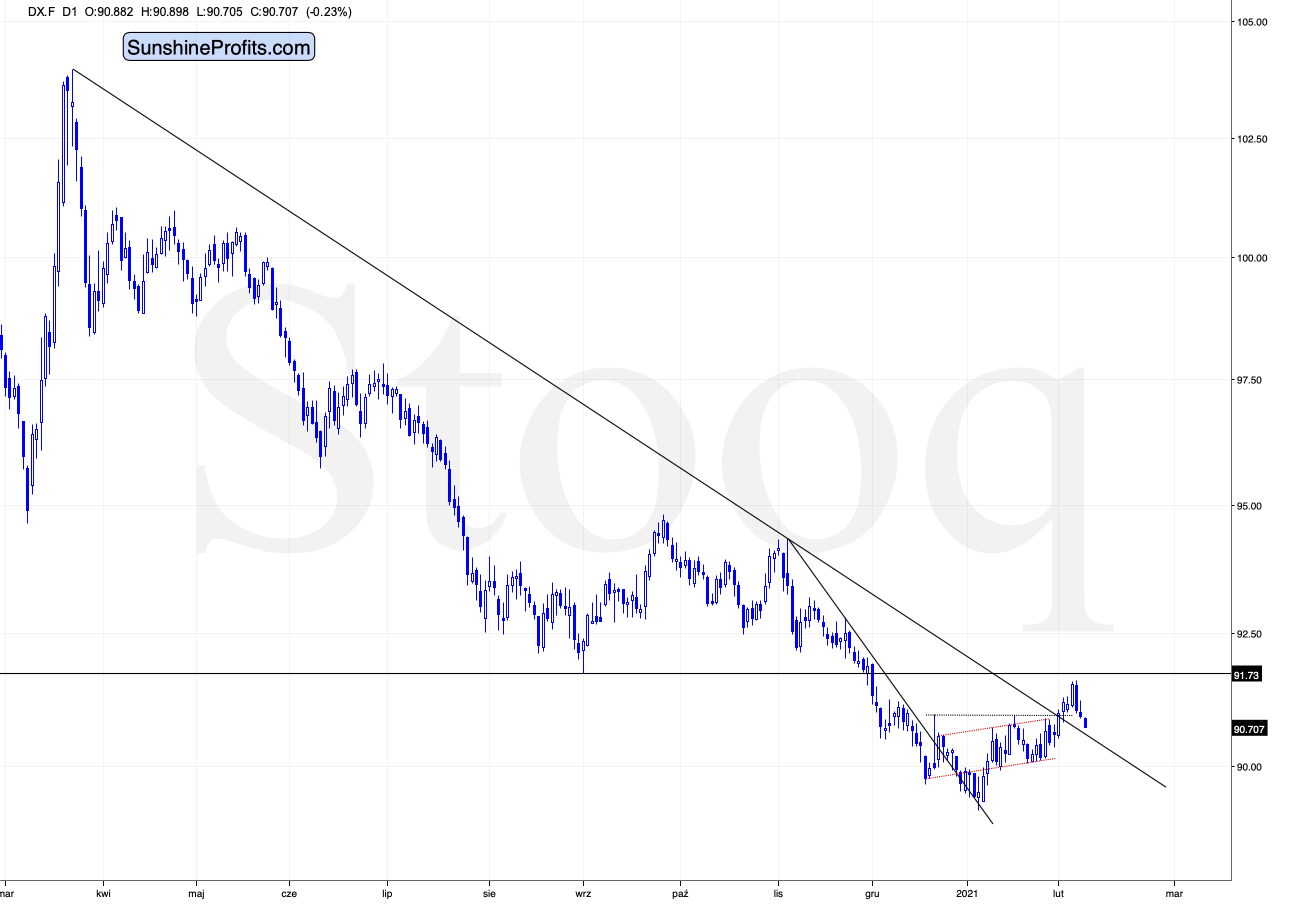
Figure 1 - USD Index
In yesterday’s analysis, I commented on the USD Index’s performance in the following way:
Again, because assets don’t move in a straight line, it’s plausible that the USD Index retests its declining resistance line, while gold retests its rising support line. If this occurs, the USDX is likely to decline to the 90.6 range, while gold will receive a short-term boost. Remember though: the outcome does not change their medium-term trends and the above confirmations signal that the USDX is heading north and gold is heading south.
The part that I put in bold is exactly what is being realized right now. The USDX is correcting after the breakout, likely verifying the previous resistance as support.
Unless the USDX breaks back below the declining medium-term support line in a meaningful way, the bullish implications for the following weeks will remain intact.
So, nothing really changed from this perspective. The USD Index could actually move a bit lower and the overall outlook would not change.
But gold rallied – didn’t it change anything?
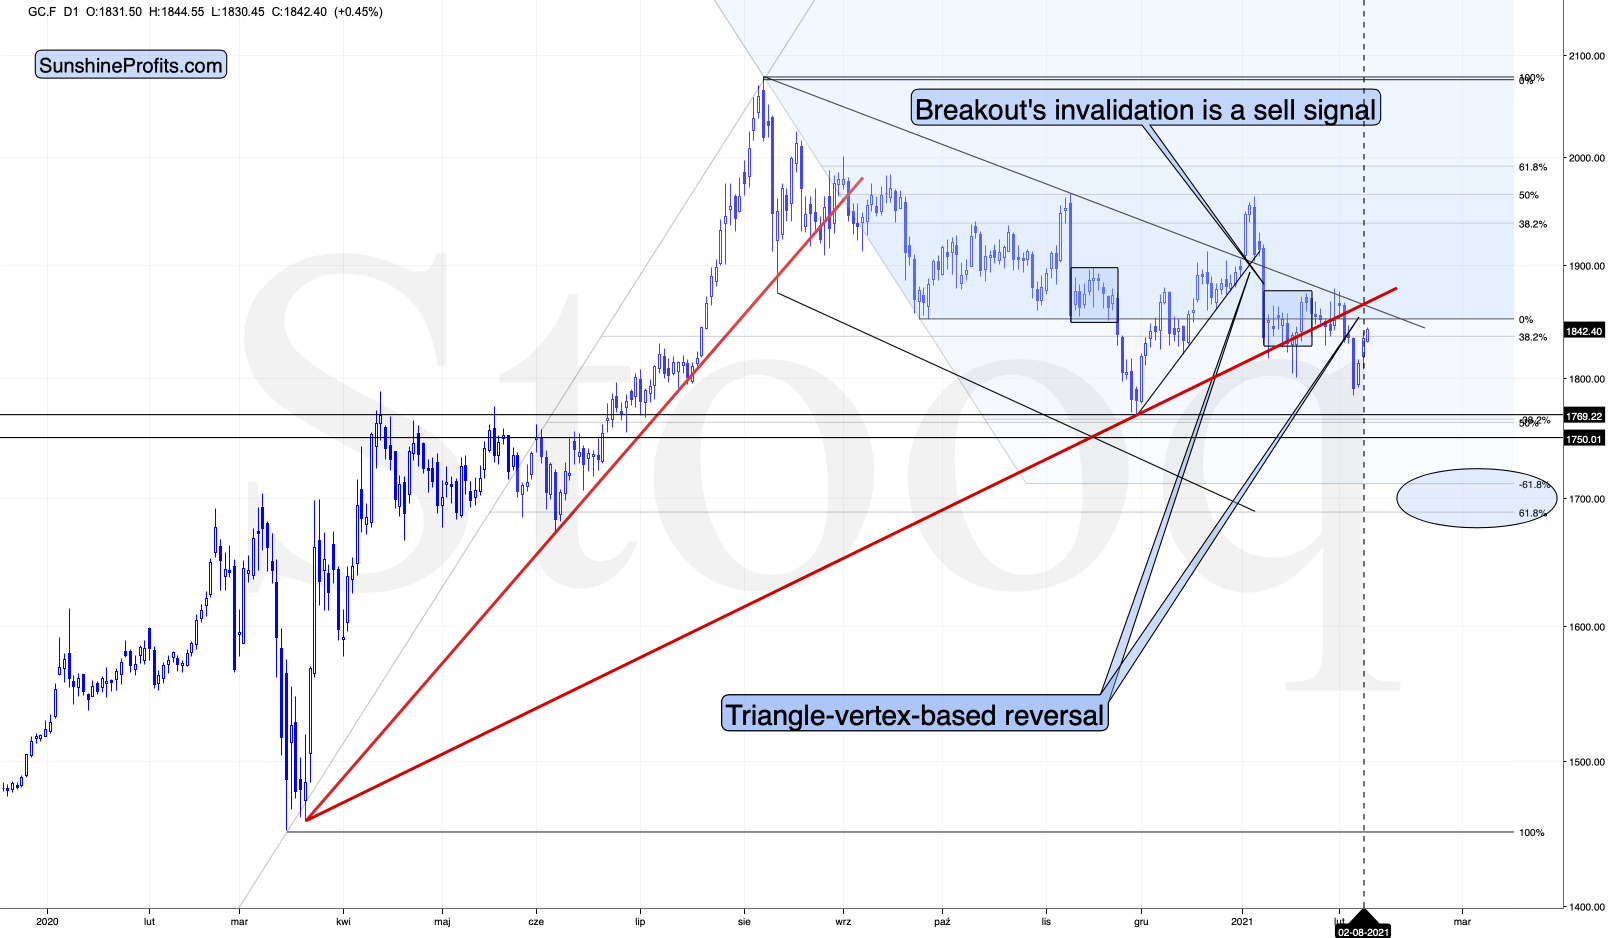
Figure 2 - COMEX Gold Futures
Not really. Once again, let’s quote what I wrote in the previous days (on Feb. 4):
In yesterday’s analysis, I wrote that the yellow metal’s breakdown below the rising red support line was not yet confirmed, but that the situation had already become more bearish. Gold closed below this line for the second day yesterday and given today’s decline, it seems that it’s going to close below it for the third consecutive day. This means that the breakdown is almost confirmed, and the implications are strongly bearish.
Now, given the proximity of the triangle-vertex-based reversal, I wouldn’t rule out a quick comeback and then another downturn within the next several days.
Theoretically, it’s possible that gold slides to $1,700 shortly and reverses there, but we wouldn’t bet the farm on this happening this or the next week. However, it is very likely to take place in February (more likely) or in March (less likely).
That’s exactly what we saw – a quick comeback. Gold is currently approximately at its triangle-vertex-based reversal, which means that it’s likely to reverse and decline any day or hour now.
So, again, nothing changed with regard to the outlook and nothing would likely change if gold moves a little higher from here as well (in analogy to the USD Index moving a little lower). What we’re seeing is either normal during a bigger upswing (post-breakout verification in the USD Index) or its direct consequence that fits other technical signs (gold’s quick comeback).
What about silver, did the white metal change anything?
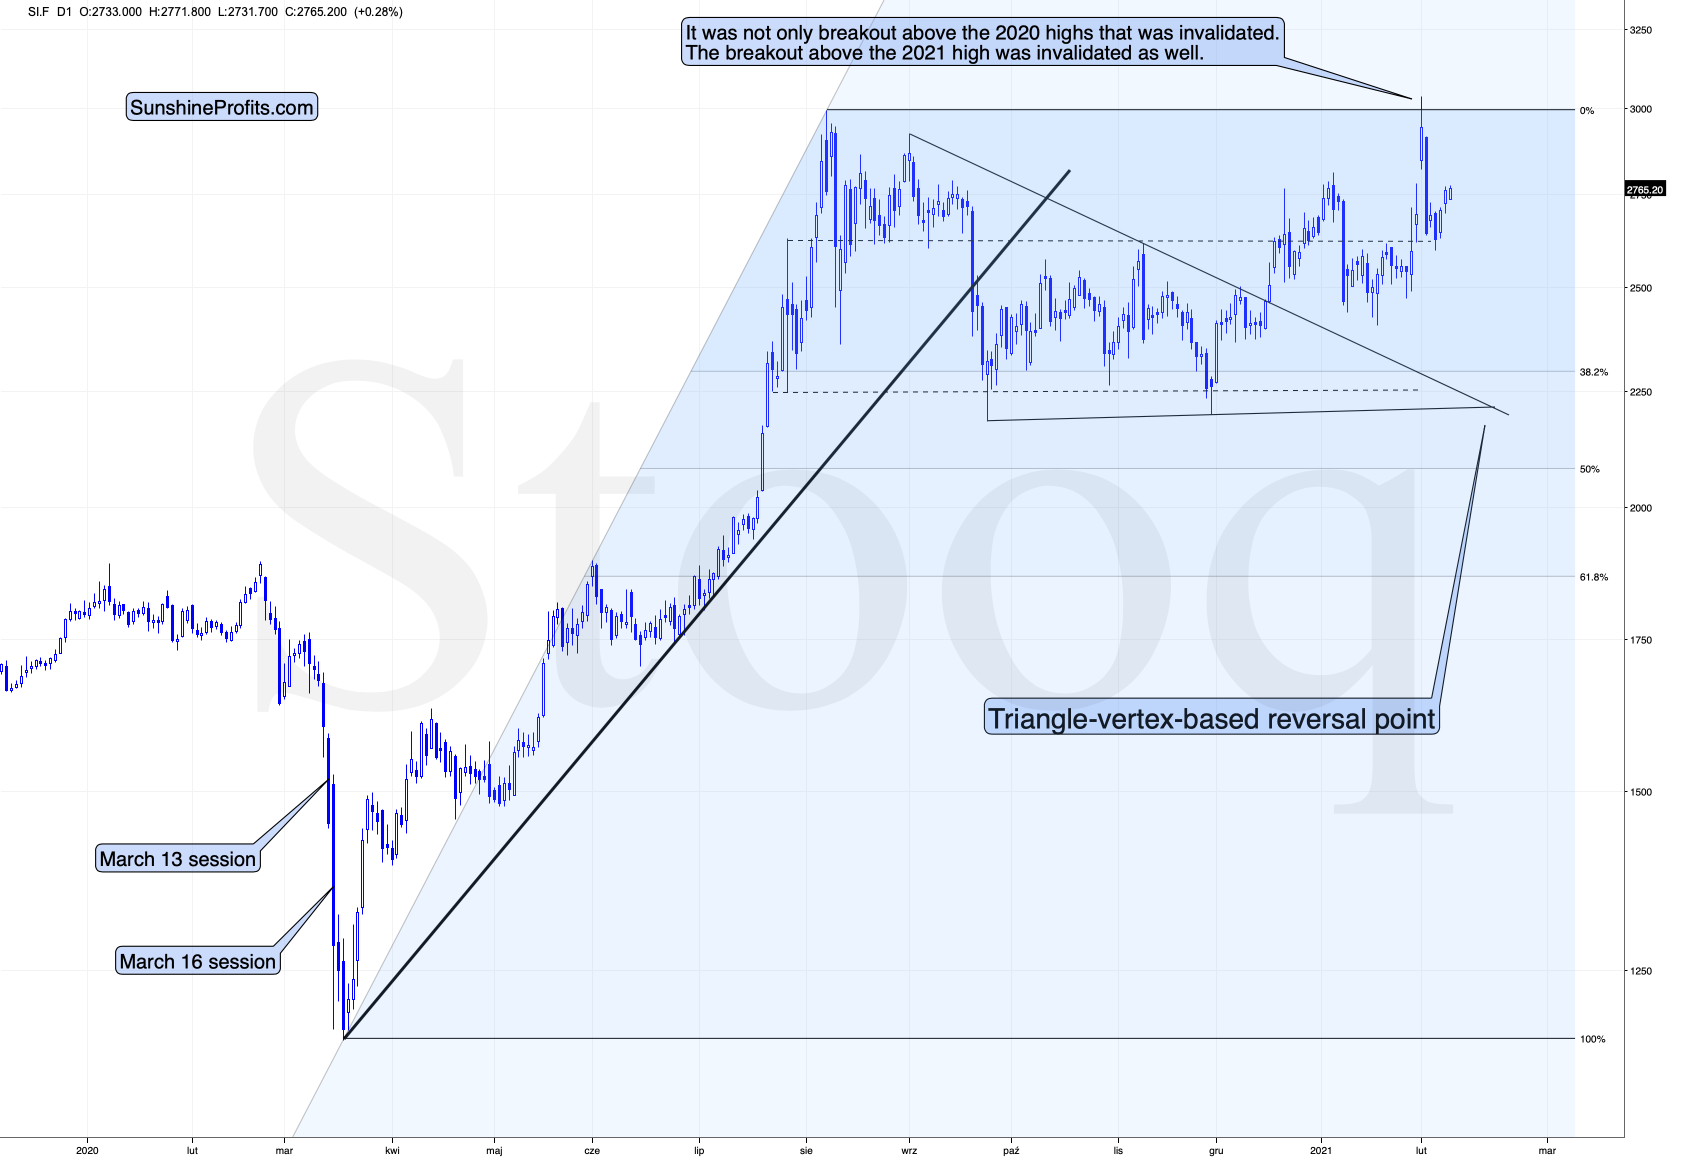
Figure 3 - COMEX Silver Futures
Not really. Just like gold, silver is taking a breather after the increased volatility. This is normal.
And the miners?
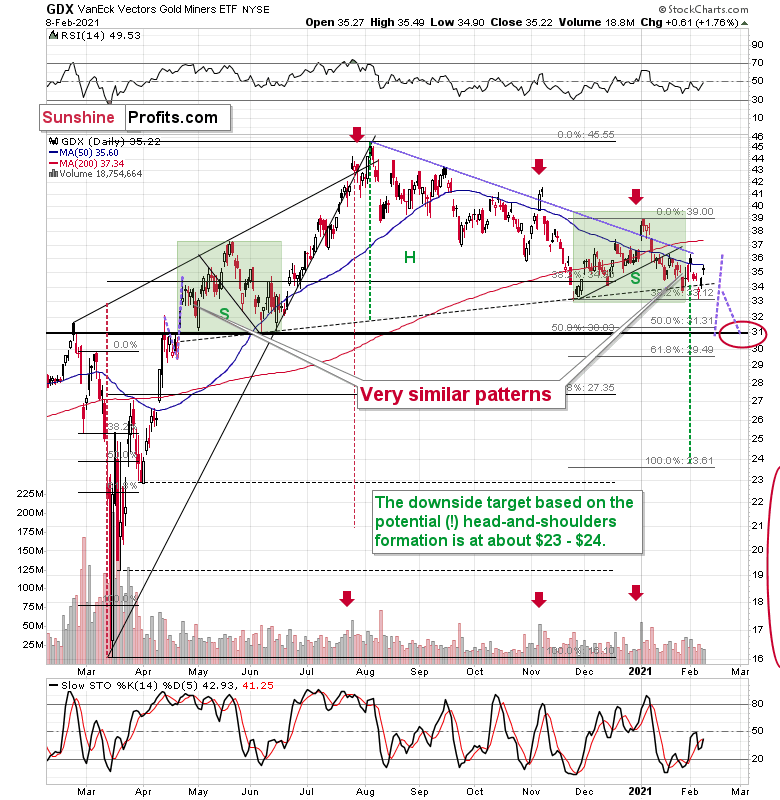
Figure 4 - VanEck Vectors Gold Miners ETF (GDX)
Mining stocks are declining in a relatively regular manner as well. After their early January top, they declined profoundly, and since that time they have also been declining, but at a slower pace. We’ve been seeing lower highs and lower lows in the past month or so, and yesterday’s upswing fits this pattern very well.
Ever since the mid-September breakdown below the 50-day moving average, the GDX ETF was unable to trigger a substantial and lasting move above this MA. The times when the GDX was able to move above it were also the times when the biggest short-term declines started.
So, did anything change yesterday? Not really.
My previous comments on the above chart remain up-to-date:
The most recent move higher only made the similarity of this shoulder portion of the bearish head-and-shoulders pattern to the left shoulder (figure 4 - both marked with green) bigger. This means that when the GDX breaks below the neck level of the pattern in a decisive way, the implications are likely to be extremely bearish for the next several weeks or months.
Due to the uncanny similarity between the two green rectangles, I decided to check what happens if this mirror-similarity continues. I used purple, dashed lines for that. There were two important short-term price swings in April 2020 – one shows the size of the correction and one is a near-vertical move higher.
Copying these price moves (purple lines) to the current situation, we get a scenario in which GDX (mining stocks) moves to about $31 and then comes back up to about $34. This would be in perfect tune with what I wrote previously. After breaking below the head-and-shoulders pattern, gold miners would then be likely to verify this breakdown by moving back up to the neck level of the pattern. Then, we would likely see another powerful slide – perhaps to at least $24.
Let’s take one more look at the related markets.
A Technical Bounce
For weeks, I’ve been warning about the fundamental calamity that’s plaguing the Eurozone economy. From dismal service sector data across France and Italy (Europe’s second and third-largest economies) to Eurozone construction activity recording its sharpest drop since May, the euro, and more specifically, the EUR/USD continues to live on borrowed time.
However, notching its first three-day winning streak since early-January, euro bulls continue to deny economic reality.
A cause for concern?
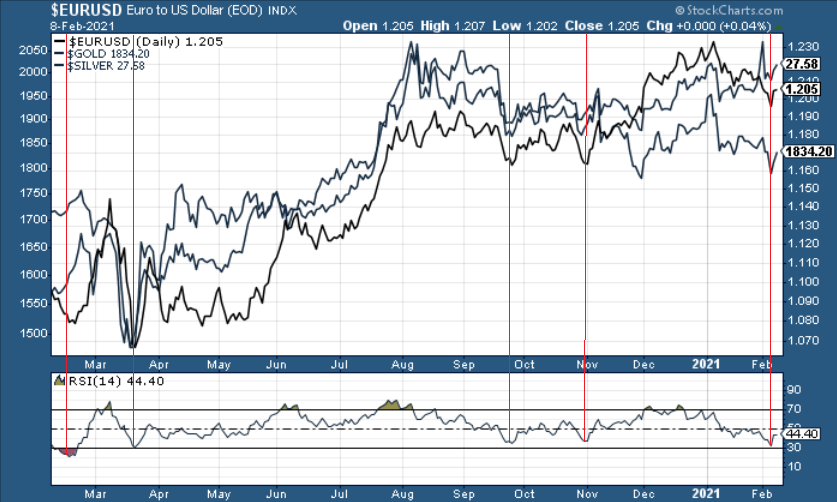
Well, if you analyze the chart below, you can see that the EUR/USD’s recent strength is nothing more than a technical bounce.
Figure 5
To explain, the horizontal lines above depict the price movement of the EUR/USD, gold and silver. And at the bottom, the chart depicts the EUR/USD’s RSI (Relative Strength Index). If you analyze the vertical red lines connecting the two, you can see that an RSI near or below 30 results in a short-term bounce. More importantly though, notice how gold and silver like to tag along?
Regarding the move, the EUR/USD rising off an RSI of 31 is nothing to write home about. The last three times the EUR/USD attempted its most-recent countertrend rallies, they all fizzled out at, or below an RSI of 50 (less than six points from where we are now).
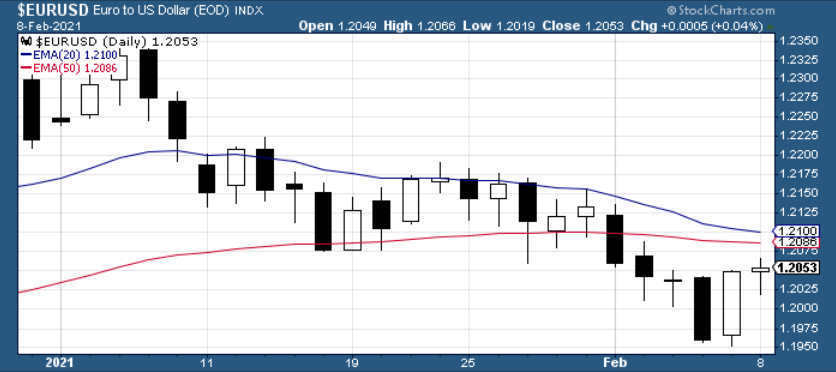
In addition, the EUR/USD is still trading below its 20-day and 50-day moving averages – with the last two attempts to reclaim its 50-day MA (on Feb. 2 and Feb. 8) ending in failure.
Please see below:
Figure 6
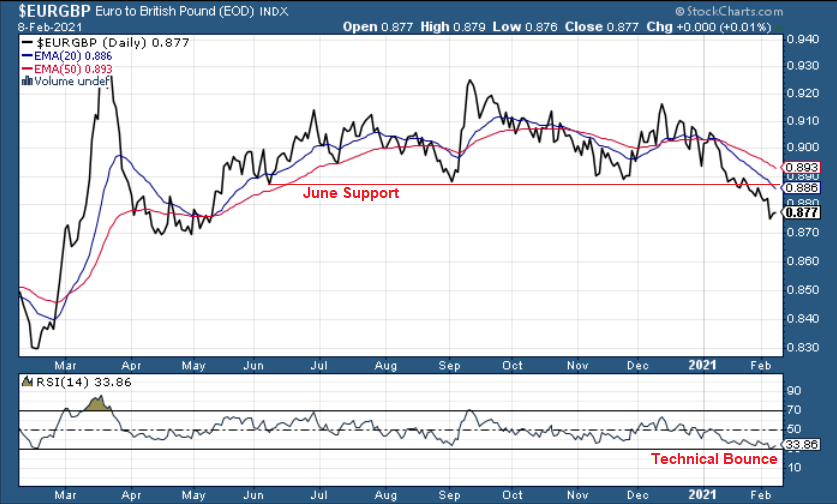
Even more telling, while the EUR/USD has rallied by 0.77% over the three-day period, the EUR/GBP hasn’t shown the same enthusiasm. Up by only 0.23% over that same stretch, the EUR/GBP’s bounce off an RSI of 30 was more of a courtesy rally than anything else. Moreover, the EUR/GBP is still trading well below its initial June support level and has also failed to recapture its 20-day and 50-day MA’s.
Please see below:
Figure 7
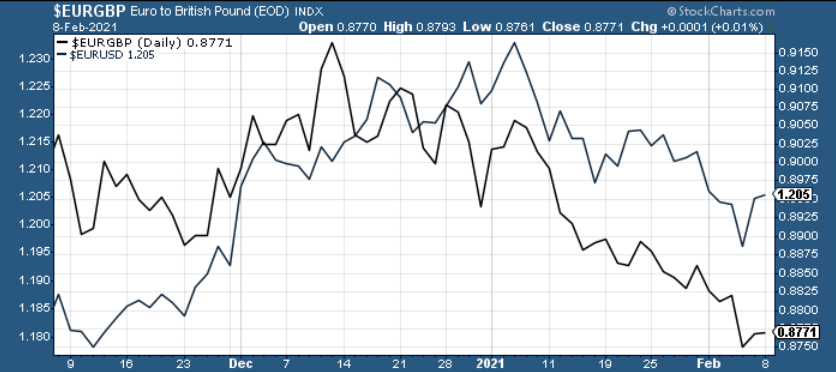
All in all, if the EUR/GBP remains destined for devaluation, the EUR/USD is unlikely to buck the trend. Over the last three months, the two pairs have traded more like two of a kind.
Please see below:
Figure 8
Thus, because a weaker EUR/GBP foretells a weaker EUR/USD, and a weaker EUR/USD foretells weakness in the PMs, the group’s three-day party could get broken up any minute now.
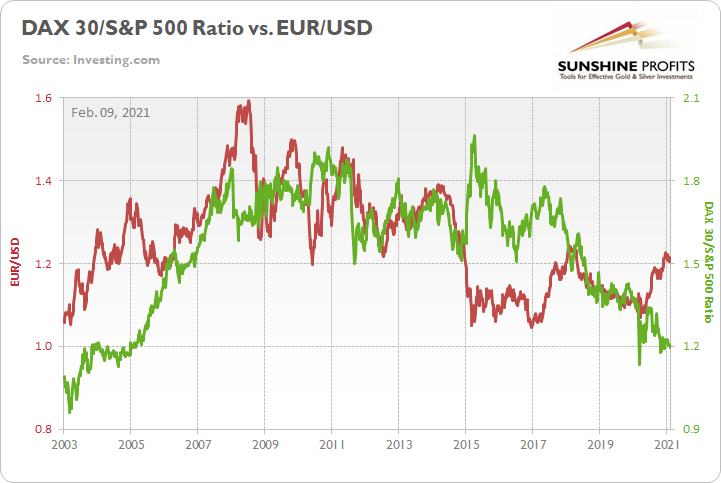
As a second interesting development, the behavior of the S&P 500 and the German DAX are also signaling trouble for the euro. Because Germany is the largest economy in the Eurozone, the DAX 30 is a good proxy for Europe’s economic strength (from a stock market perspective). Similarly, consolidating the 500 largest companies in the United States, the S&P 500 is the best equity market proxy of U.S. economic strength.
But highlighting their importance, the performance of these two indices often go hand in hand with the performance of their respective currencies. In a nutshell: the outperformance of the S&P 500 often coincides with a stronger U.S. dollar.
Please see below:
Figure 9
To explain the chart above, the green line depicts the performance of the DAX 30/S&P 500 ratio over the last ~18 years, while the red line depicts the performance of the EUR/USD. When the green line is rising, it means that the DAX 30 is outperforming the S&P 500. Conversely, when the green line is falling, it means that the S&P 500 is outperforming the DAX 30. If we overlook the divergence from 2015 to 2018, ~15 years of historical data shows that the ratio tends to predict the future direction of the EUR/USD.
And if you think about it, the logic makes perfect sense: with the European Central Bank (ECB) currently outprinting the U.S. Federal Reserve (FED), the U.S. economy isn’t benefiting from relative excess liquidity. Moreover, with negative interest rates in the Eurozone, the U.S. also isn’t benefiting from relatively lower borrowing costs.
As a result, the S&P 500’s outperformance of the DAX 30 (why the green line is falling on the right side of the chart) can be chalked up to relative economic strength. In reality, both regions’ economies are tracking well below potential. However, currencies (and often equities) trade on a relative basis. Thus, a less-bad U.S. economy is deserving of a lower DAX 30/S&P 500 ratio and a lower EUR/USD.
Case in point: the DAX 30/S&P 500 ratio rallied by 2.6% from Dec. 6 to Dec. 13 – peaking roughly two weeks before the EUR/USD. And since then, the ratio has declined by 2.3%, while the EUR/USD has declined by 1.7%. As a result, it’s no coincidence that the Eurozone’s fundamental demise has coincided with a move lower for both.
In conclusion, the EUR/USD remains ripe for the picking and the recent three-day rally shouldn’t shake anyone’s confidence. Markets don’t move in a straight line and countertrend rallies are expected along the way. However, because the PMs have a strong correlation with the EUR/USD, it’s important to heed the warnings. However, once the medium-term trends are complete, the PMs will bear fruit once again.
Letters to the Editor
Q: I’m a long-time subscriber, am a little long in the tooth, and hold a long DUST ETF position. For a long time you have suggested a DUST target exit price of $28.73.
1. How do you figure this exit price?
2. How does it relate to an initial $1,703 gold exit (or later $1,500. decline), GDXJ $42.72, and GDX $32.02 targets?
3. Time frame within above?
A: I calculated this price based on the target for the GDX. When I originally calculated it, I assumed that miners will move to this level by moving by the same percent each day (DUST multiplies daily price moves of the mining stocks). Then, I’m moving the cent parts of the target so that they maximize the odds of the trade being realized and the stop-loss not being hit. These calculations need to be adjusted every now and then (due to ETN costs and time decay), especially when it seems that the target is about to be reached. I updated the target today (to $23.89 in DUST) and I plan to adjust it once again when GDX confirms the breakdown below neck level.
In general, I expect the current set of prices (GDX at about $31 - $32 and GDXJ at about $42 - $43) in the “trading” part of the summary to correspond to gold at about $1,700. When gold moves below $1,700 (say, to $1,500), I expect the GDX to move below $31, perhaps to $24 or so, or even lower.
I expect the above-mentioned move (to $1,700 in gold) to take place over the next 1-7 weeks. I wouldn’t say that this is carved in stone, so any option transactions based on those forecasts will remain risky. You will find the same information regarding timing and updates regarding it, in the “Overview of the Upcoming Part of the Decline” section in the Gold & Silver Trading Alerts.
Q: Thank you for the great analysis on precious metals. One thing is bothering me right now. In August / October 2017, the dollar index created an inverted head and shoulders pattern that broke through, confirmed, and then turned downward around half of its range and made a lower final low of 88. This looks similar to the current pattern. If the movements rhyme, is there a risk it could be the same this time too? Do you think that the foundations will prevail? Well, did yesterday’s job claims start this move down?
A: Thank you for the compliment, I’m very happy to read that you enjoy my analyses.
Indeed, the inverse head-and-shoulders formation in mid-2017 was invalidated and then we saw another move lower. If the current formation is invalidated as clearly as the mid-2017 formation was invalidated, we could indeed see another move lower in the USDX. However, I don’t view this outlook as likely. The declining medium-term resistance line (which turned to a support line) was broken and this is what makes the current situation much more similar to what we saw in early 2018 than to what we saw in mid-2017.
One could even argue that what we had seen between August and October 2017 was similar to what we saw between late July 2020 and mid-September 2020. The formation was not as clear but both patterns were still similar. They were followed by a sharp upswing that then failed to hold.
Moreover, seeing a pattern or breakout being invalidated once, doesn’t mean that it becomes useless. Breakouts and breakdowns are still important developments to keep in mind, even if every now and then they fail to trigger the moves that they were “supposed to” trigger.
All in all, I don’t think there are bearish implications of the similarity in the shape of the recent price patterns that we saw recently and that we saw in mid-2017.
Q: Looking at your report, gold will drop until it hits $1700, but it rose yesterday. Is it temporarily increasing? If Biden’s policy (quantitative easing) is accepted in the senate, would it lead to inflation so that the price of gold increases in the near future? Please advise me of your thinking.
A: As I explained in the previous Gold & Silver Trading Alerts, and also in today’s issue, the current move higher in gold (and the current move lower in the USD Index) is perfectly normal and fits the previously explained narrative. A daily move is rarely meaningful – what matters is if the underlying factors and the trend that they caused changed. This didn’t happen.
The inflationary nature of stimulus is well known to the market, so it’s likely already included “in the price” – markets have already reacted to it. Besides, please note that the printing presses are much hotter in the Eurozone right now, so the euro is likely to weaken compared to the U.S. dollar, which in turn means that the USD Index would be likely to move higher. This would likely put downward pressure on gold – at least initially.
Q: If I understood you correctly, you believe that we are already in or about to enter the winter season based on The Kondratiev Cycle, which is characterized by: fall of inflation, severe deflation pressure, credit crunch - no credit, rates falling, and cash and bonds being the winners. I do agree that fundamentals are screaming asset BUBBLE right now. All the warning signs are in place!
However, we are also in uncharted territory and at the end of the Long Debt Cycle. It seems that the Fed has reached a stage where they have to continue with QE and yield curve control, governments will continue to support the economy with more fiscal stimulus (MMT). We also know that once lockdowns are lifted, the velocity of the money will increase. I would argue that we will then experience a secular shift from disinflation to inflation. (probably stagnation). Higher inflation will eventually lead to debt restructuring, deleveraging and currency devaluation, significantly reducing government and private debt. Since central banks will have to control the bond yield from going too high (economic repression), the speed of inflation will outpace the increase in saving as the interest rate will artificially stay low (terrible for cash and bonds)
1. I would like to understand how the events mentioned above fall into the Winter season characteristics.
2. I would like to know when you expect to see the deep market correction you are talking about, the size of correction you anticipate and how long each season lasts.
Your answer is much appreciated and anticipated.
A: You’re making a very compelling argument about the possible nature of the future developments in the world. I’d say that the situation theoretically could develop exactly as you have outlined it. Yet, I don’t think this is the most likely outcome. I have the following comments to the points that you made:
- We know that once lockdowns are lifted, the velocity of money will increase, however… At the same time, people will use their capital for more normal activities, instead of using them for speculation (which they likely call “investing”, but it’s essentially the former). This means that they might start to withdraw their capital from stocks, cryptos, and other asset classes. And since there are many investors/speculators out there using leverage, the impact on the markets might be quite visible (we’ve been featuring charts confirming that in the previous analyses). The bubbles might start to burst.
- Remember when the silver price collapsed right after the SLV ETF was launched, even though everyone and their brother was expecting silver to skyrocket based on this major (truly positive) development for the silver market? Just like it was obvious (and true) that a new silver investment vehicle would make it much easier for people to invest in silver, it is obvious for people that when restrictions are lifted, the economy will get a major boost, the skies are going to be blue without a single cloud and so on. You already see my point – the expectations of this happening might have already pushed stocks to the current (ridiculous on many levels) valuations. As the market buys rumors and sells facts, stocks might actually fall when things get back to normal.
- If - due to the above - stocks do indeed fall, and people suddenly stop feeling so wealthy and optimistic about the economy’s revival, they might actually be hesitating to make as many purchases as it is currently assumed. This would make the “revival” problematic. This means that inflation might not pick up that much, or at all.
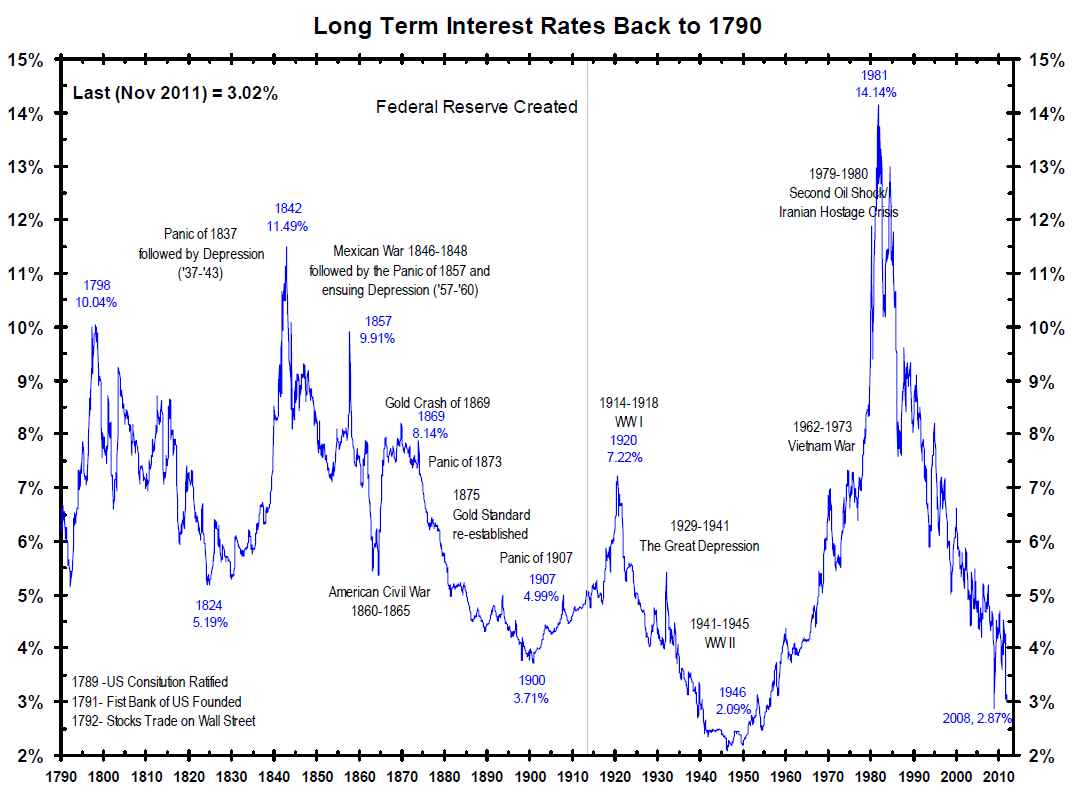
- Bond yields and governments… That’s why I like the very long-term charts.
Figure 10
The economic and political circumstances changed over the years, but the rates never stayed extremely low for very long. Is the current situation the first time in hundreds of years when governments have too much debt and are trying to get rid of it using low interest rates?
The longest previous record took about a decade, about 80 years ago.
That was precisely when the Powers that Be tried to keep the rates low. They succeeded for some time, but what followed next was the biggest rally in rates in centuries.
Is this time really different? I doubt that.
The length of the following cycles is relatively unclear, although I do expect the winter to be relatively long (perhaps more than a decade), as there’s much “unwinding” needed. When does it all start (when will stocks top) is the least clear of all issues. The markets are red-hot and even though valuations are already ridiculous, they could become even more ridiculous before we see THE top. Based on several charts that we featured in the recent analyses it seems to me that we will see this top “soon”. Perhaps in this quarter. In all cases, I don’t see this medium-term rally in stocks lasting until the end of the year, without a massive decline.
How big of a decline am I expecting to see? I’m not an expert in making stock market forecasts (I specialize in the precious metals market, including mining stocks), so please bear this in mind. Having said that, I can say that I’m expecting a real carnage on the stock market in the following years. Between 1929 and 1932, the Dow Jones Industrials fell from above 350 to below 50. I wouldn’t even rule out something similar. Dow is trading at about 31000 right now and a decline analogous to the above-mentioned one, would take it below 5000. Is it certain that stocks would decline as low? Absolutely not. But do I think that it’s likely that stocks will decline below their 2020 low before this upcoming decline is all over? Yes, that’s what I view as likely.
I would prefer to be wrong on the above, because the social consequences of stocks declining as low as that would be devastating.
Again, I think that the precious metals market would be affected by the above only in the first part of the decline – just like what we saw – on a smaller scale – in 2008 and – on an even smaller scale – in the first half of 2020.
Overview of the Upcoming Part of the Decline
- I expect the initial bottom to form with gold falling to roughly $1,700, and I expect the GDX ETF to decline to about $31 - $32 at that time. I then plan to exit the short positions in the miners and I will consider long positions in the miners at that time – in order to benefit from the likely rebound.
I expect the above-mentioned decline to take another 1 – 7 weeks to materialize and I expect the rebound to take place during 1-3 weeks.
- After the rebound (perhaps to $33 - $34 in the GDX), I plan to get back in with the short position in the mining stocks.
- Then, after miners slide once again in a meaningful and volatile way, but silver doesn’t (and it just declines moderately), I plan to switch from short positions in miners to short positions in silver (this could take another 1-4 weeks to materialize). I plan to exit those short positions when gold shows substantial strength relative to the USD Index, while the latter is still rallying. This might take place with gold close to $1,500 and the entire decline (from above $1,700 to about $1,500) would be likely to take place within 1-10 weeks and I would expect silver to fall hardest in the final part of the move. This moment (when gold performs very strongly against the rallying USD and miners are strong relative to gold – after gold has already declined substantially) is likely to be the best entry point for long-term investments in my view. This might happen with gold close to $1,500, but it’s too early to say with certainty at this time.
Consequently, the entire decline could take between 3 and 20 weeks, while the initial part of the decline (to $1,700 in gold) is likely to take between 1 and 7 weeks.
If gold declines even below $1,500 (say, to ~$1250 or so), then it could take another 10 weeks or so for it to bottom, but this is not what I view as a very likely outcome.
The above is based on the information available today and it might change in the following days/weeks.
Summary
To summarize, the PMs short-term downswing has likely just begun, as miners broke below the neck level of their almost-yearly head-and-shoulders formation. We saw a small invalidation, but we don’t trust its bullish implications – we just saw something similar that failed to ignite a lasting rally and the USD’s decline seems to be a normal, post-breakout pullback.
In addition, because we’re likely entering the “winter” part of the Kondratiev cycle, the outlook for the precious metals’ sector remains particularly bearish during the very first part of the cycle, when cash is king.
Silver’s strength seems bullish at first sight, but taking a closer look at this move, and comparing it with previous cases (when silver got so much attention) and with miners’ weakness, provides us with bearish implications for the medium term.
The confirmed breakout in the USD Index is yet another confirmation of the bearish outlook for the precious metals market.
Naturally, everyone's trading is their responsibility. But in our opinion, if there ever was a time to either enter a short position in the miners or increase its size if it was not already sizable, it's now. We made money on the March decline, and on the March rebound, with another massive slide already underway.
After the sell-off (that takes gold to about $1,500), we expect the precious metals to rally significantly. The final part of the decline might take as little as 1-5 weeks, so it's important to stay alert to any changes.
Most importantly, please stay healthy and safe. We made a lot of money on the March decline and the subsequent rebound (its initial part) price moves (and we'll likely earn much more in the following weeks and months), but you have to be healthy to enjoy the results.
As always, we'll keep you - our subscribers - informed.
To summarize:
Trading capital (supplementary part of the portfolio; our opinion): Full speculative short positions (300% of the full position) in mining stocks is justified from the risk to reward point of view with the following binding exit profit-take price levels:
Senior mining stocks (price levels for the GDX ETF): binding profit-take exit price: $32.02; stop-loss: none (the volatility is too big to justify a SL order in case of this particular trade); binding profit-take level for the DUST ETF: $23.89; stop-loss for the DUST ETF: none (the volatility is too big to justify a SL order in case of this particular trade)
Junior mining stocks (price levels for the GDXJ ETF): binding profit-take exit price: $42.72; stop-loss: none (the volatility is too big to justify a SL order in case of this particular trade); binding profit-take level for the JDST ETF: $14.19; stop-loss for the JDST ETF: none (the volatility is too big to justify a SL order in case of this particular trade)
For-your-information targets (our opinion; we continue to think that mining stocks are the preferred way of taking advantage of the upcoming price move, but if for whatever reason one wants / has to use silver or gold for this trade, we are providing the details anyway. In our view, silver has greater potential than gold does):
Silver futures downside profit-take exit price: unclear at this time - initially, it might be a good idea to exit, when gold moves to $1,703.
Gold futures downside profit-take exit price: $1,703
Long-term capital (core part of the portfolio; our opinion): No positions (in other words: cash
Insurance capital (core part of the portfolio; our opinion): Full position
Whether you already subscribed or not, we encourage you to find out how to make the most of our alerts and read our replies to the most common alert-and-gold-trading-related-questions.
Please note that we describe the situation for the day that the alert is posted in the trading section. In other words, if we are writing about a speculative position, it means that it is up-to-date on the day it was posted. We are also featuring the initial target prices to decide whether keeping a position on a given day is in tune with your approach (some moves are too small for medium-term traders, and some might appear too big for day-traders).
Additionally, you might want to read why our stop-loss orders are usually relatively far from the current price.
Please note that a full position doesn't mean using all of the capital for a given trade. You will find details on our thoughts on gold portfolio structuring in the Key Insights section on our website.
As a reminder - "initial target price" means exactly that - an "initial" one. It's not a price level at which we suggest closing positions. If this becomes the case (like it did in the previous trade), we will refer to these levels as levels of exit orders (exactly as we've done previously). Stop-loss levels, however, are naturally not "initial", but something that, in our opinion, might be entered as an order.
Since it is impossible to synchronize target prices and stop-loss levels for all the ETFs and ETNs with the main markets that we provide these levels for (gold, silver and mining stocks - the GDX ETF), the stop-loss levels and target prices for other ETNs and ETF (among other: UGL, GLL, AGQ, ZSL, NUGT, DUST, JNUG, JDST) are provided as supplementary, and not as "final". This means that if a stop-loss or a target level is reached for any of the "additional instruments" (GLL for instance), but not for the "main instrument" (gold in this case), we will view positions in both gold and GLL as still open and the stop-loss for GLL would have to be moved lower. On the other hand, if gold moves to a stop-loss level but GLL doesn't, then we will view both positions (in gold and GLL) as closed. In other words, since it's not possible to be 100% certain that each related instrument moves to a given level when the underlying instrument does, we can't provide levels that would be binding. The levels that we do provide are our best estimate of the levels that will correspond to the levels in the underlying assets, but it will be the underlying assets that one will need to focus on regarding the signs pointing to closing a given position or keeping it open. We might adjust the levels in the "additional instruments" without adjusting the levels in the "main instruments", which will simply mean that we have improved our estimation of these levels, not that we changed our outlook on the markets. We are already working on a tool that would update these levels daily for the most popular ETFs, ETNs and individual mining stocks.
Our preferred ways to invest in and to trade gold along with the reasoning can be found in the how to buy gold section. Furthermore, our preferred ETFs and ETNs can be found in our Gold & Silver ETF Ranking.
As a reminder, Gold & Silver Trading Alerts are posted before or on each trading day (we usually post them before the opening bell, but we don't promise doing that each day). If there's anything urgent, we will send you an additional small alert before posting the main one.
Thank you.
Przemyslaw Radomski, CFA
Founder, Editor-in-chief


