

Briefly: in our opinion, full (300% of the regular position size) speculative short positions in mining stocks are justified from the risk/reward point of view at the moment of publishing this Alert.
In yesterday's analysis, we featured the extremely overbought indication that's visible in the Gold Miners Bullish Percent Index. It's truly remarkable that we've seen this maximum reading this time, while the HUI Index is still close to 300.
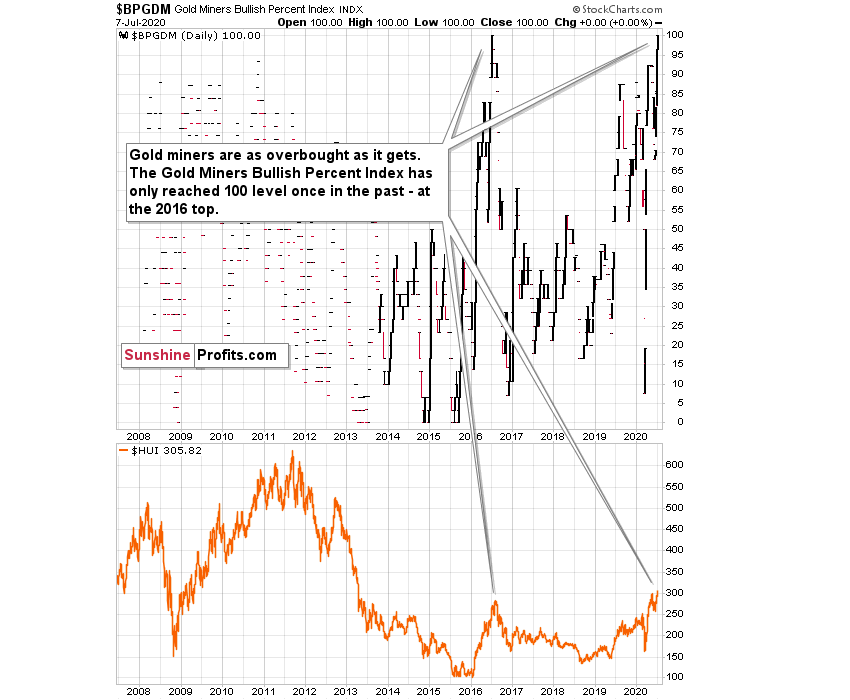
It shows that the time for the rally is practically up. Yesterday, miners moved even higher, which might appear to invalidate this point, but it absolutely isn't the case. The situation in the mining stocks continues to be extremely overbought from the short-term point of view, and a day of higher prices doesn't change anything. In fact, the extremely overbought indication doesn't tell us that the market has to decline right now - it tells us that it's very likely to decline now or shortly.
Do you remember about the symmetry in mining stocks with regard to the May - June decline and the June upswing? On Monday, we described it in the following way:
Remember when we wrote that the situation right now is similar to what happened in March, but this time it takes longer for everything to develop due to the change in market's perception of risk? To make a long story short, the March panic was because the entire world was dealing with the unknown, which exacerbated the fear. Right now, the situation is worse, and it goes worse almost on a daily basis, but people are not as afraid. The economic implications don't appear so dire either. And it's definitely nothing unknown - we more or less know what to expect.
This means that we're likely to see a repeat of what we saw in March, we're likely to see it in "slow motion", at least for some time. Please note that even slow-motion mode of the mid-March plunge would still be very volatile.
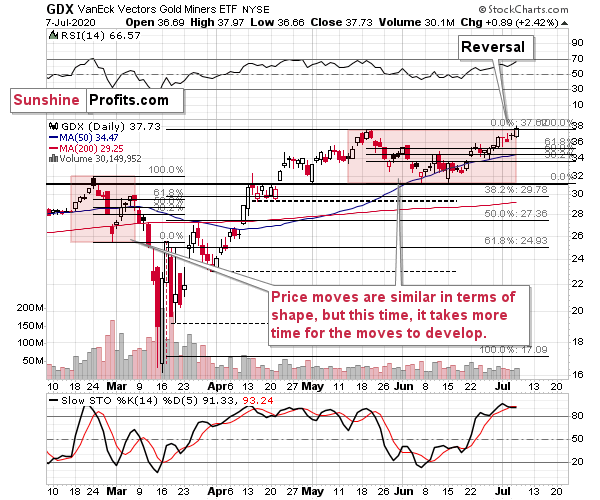
The areas that we marked with red rectangles are similar in terms of shape, but the current one is about 4x longer. The previous pattern was characterized by a decline and a correction that took more or less the same time to complete. If we're about to see something similar also this time, then we can expect the top to be formed this week.
If the March decline took 5 trading days and the price moves are taking 4x as long this time, then perhaps we would see a monthly decline to the final lows instead of a weekly one. This would serve as a perfect "handle" for the massive, long-term "cup and handle" pattern in gold.
It seems that the top in the miners might have been formed yesterday. Alternatively, it might be formed today. Yesterday, gold miners broke slightly above the May highs, but the breakout was quite small and definitely isn't confirmed. The Stochastic indicator remained on the sell signal, but this is not that important in light of the 2 fake signals in April and one fake signal in May. Still, the RSI is very close to 70, which is yet another indication of the likely reversal.
As far as gold is concerned, it's showing a subtle sign that it's ready to once again invalidate the breakout above the $1,800 level and the November 2011 high.
On Monday, we wrote the following:
The resistance line, above which gold tried to break and the rising support line based on the March and June lows cross more or less in the first days of July. The triangle-vertex-based reversals have pointed to many important tops and bottoms in the recent weeks and months.
We previously wrote that the above-mentioned reversal might correspond to a bottom in gold, but as of today, it's clear that if any reversal is to take place, it's going to be a top, not a bottom, as gold's most recent short-term move has been up.
Thursday's top took place very close to the reversal, but at the same time it was not reached precisely. We then saw one more pop-up closer to the vertex.
This could mean that the top is already in, however, if the USD Index is to decline here, gold might be forced to move higher, nonetheless. We wouldn't rule out an attempt to move to or above the most recent high, but we doubt that gold futures would move above $1,820 even on a very temporary basis.
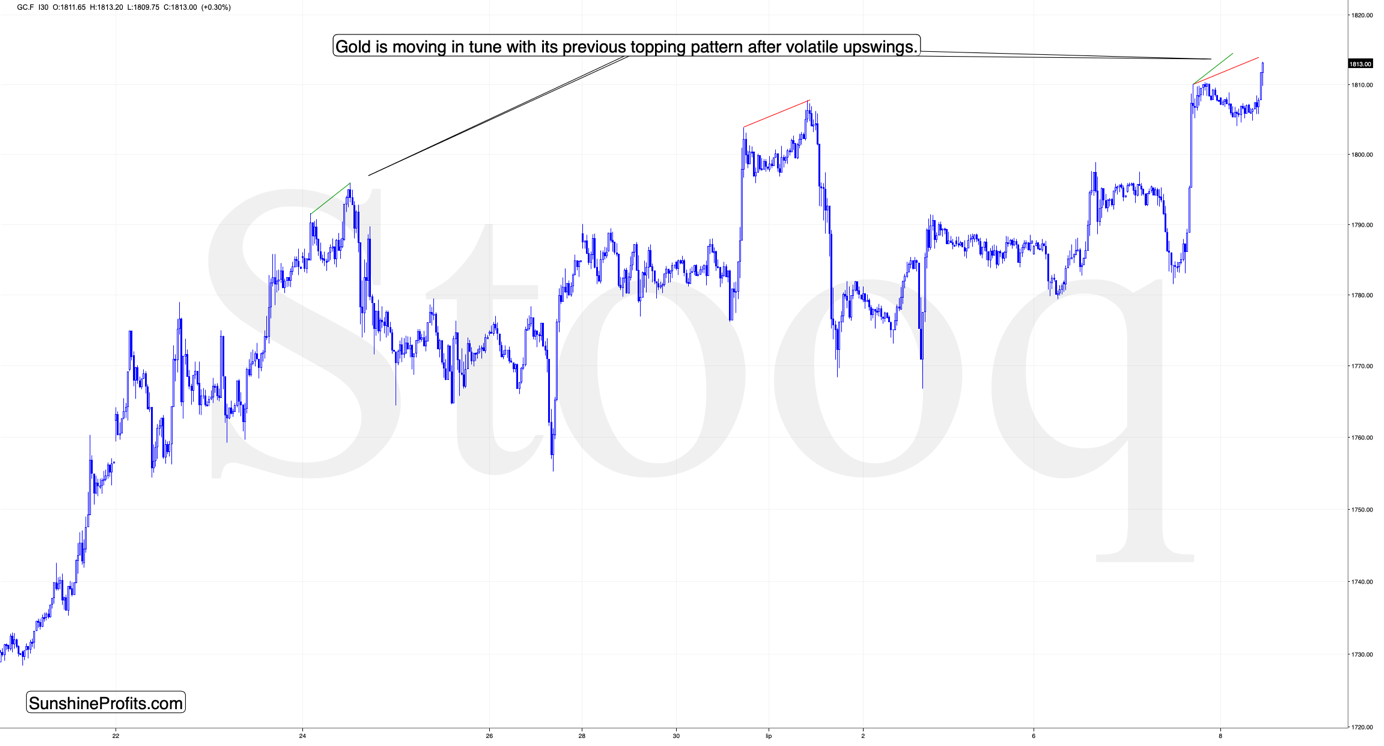
Gold is indeed making an attempt to move higher, and - as we wrote previously - we think that this attempt will not be successful. This is especially the case given gold's specific intraday price pattern in which it tops. After a sharp intraday rally (the above chart features 30-minute candlesticks), gold tops, corrects, and then makes an attempt to move slightly higher in the following hours. We marked the recent cases with green and red, and we copied them to the current situation. If gold repeats its recent topping patterns, its likely to top at about $1,815 or so. At the moment of writing these words, gold futures are trading at $1,813.75, which means that this level was practically reached.
This means that gold is likely to reverse any hour now - perhaps before the markets open in the U.S.. This means that miners are likely to invalidate their tiny breakout, thus flashing a major sell signal.
The above perfectly fits the long-term reversal signs from gold and the USD Index, and the bearish narrative for the next 1-6 weeks for the precious metals sector.
Summary
Summing up, the extreme overbought reading from the Gold Miners Bullish Percent Index is a perfectly bearish confirmation for points that we made previously about gold and the USD Index.
Naturally, everyone's trading is their responsibility, but in our opinion, if there ever was a time to either enter a short position in the miners or to increase its size if it wasn't already sizable, it's now. We made money on the March decline and on the March rebound, and it seems that another massive slide is about to start. When everyone is on one side of the boat, it's a good idea to be on the other side, and the Gold Miners Bullish Percent Index literally indicates that this is the case with mining stocks.
After the sell-off (that takes gold below $1,400), we expect the precious metals to rally significantly. The final decline might take as little as 1-6 weeks, so it's important to stay alert to any changes.
Most importantly - stay healthy and safe. We made a lot of money on the March decline and the subsequent rebound (its initial part) price moves (and we'll likely make much more in the following weeks and months), but you have to be healthy to really enjoy the results.
As always, we'll keep you - our subscribers - informed.
To summarize:
Trading capital (supplementary part of the portfolio; our opinion): Full speculative short positions (300% of the full position) in mining stocks is justified from the risk to reward point of view with the following binding exit profit-take price levels:
Senior mining stocks (price levels for the GDX ETF): binding profit-take exit price: $10.32; stop-loss: none (the volatility is too big to justify a SL order in case of this particular trade); binding profit-take level for the DUST ETF: $231.75; stop-loss for the DUST ETF: none (the volatility is too big to justify a SL order in case of this particular trade)
Junior mining stocks (price levels for the GDXJ ETF): binding profit-take exit price: $9.57; stop-loss: none (the volatility is too big to justify a SL order in case of this particular trade); binding profit-take level for the JDST ETF: $284.25; stop-loss for the JDST ETF: none (the volatility is too big to justify a SL order in case of this particular trade)
For-your-information targets (our opinion; we continue to think that mining stocks are the preferred way of taking advantage of the upcoming price move, but if for whatever reason one wants / has to use silver or gold for this trade, we are providing the details anyway. In our view, silver has greater potential than gold does):
Silver futures downside profit-take exit price: $8.58 (the downside potential for silver is significant, but likely not as big as the one in the mining stocks)
Gold futures downside profit-take exit price: $1,382 (the target for gold is least clear; it might drop to even $1,170 or so; the downside potential for gold is significant, but likely not as big as the one in the mining stocks or silver)
Long-term capital (core part of the portfolio; our opinion): No positions (in other words: cash
Insurance capital (core part of the portfolio; our opinion): Full position
Whether you already subscribed or not, we encourage you to find out how to make the most of our alerts and read our replies to the most common alert-and-gold-trading-related-questions.
Please note that the in the trading section we describe the situation for the day that the alert is posted. In other words, it we are writing about a speculative position, it means that it is up-to-date on the day it was posted. We are also featuring the initial target prices, so that you can decide whether keeping a position on a given day is something that is in tune with your approach (some moves are too small for medium-term traders and some might appear too big for day-traders).
Plus, you might want to read why our stop-loss orders are usually relatively far from the current price.
Please note that a full position doesn't mean using all of the capital for a given trade. You will find details on our thoughts on gold portfolio structuring in the Key Insights section on our website.
As a reminder - "initial target price" means exactly that - an "initial" one, it's not a price level at which we suggest closing positions. If this becomes the case (like it did in the previous trade) we will refer to these levels as levels of exit orders (exactly as we've done previously). Stop-loss levels, however, are naturally not "initial", but something that, in our opinion, might be entered as an order.
Since it is impossible to synchronize target prices and stop-loss levels for all the ETFs and ETNs with the main markets that we provide these levels for (gold, silver and mining stocks - the GDX ETF), the stop-loss levels and target prices for other ETNs and ETF (among other: UGLD, DGLD, USLV, DSLV, NUGT, DUST, JNUG, JDST) are provided as supplementary, and not as "final". This means that if a stop-loss or a target level is reached for any of the "additional instruments" (DGLD for instance), but not for the "main instrument" (gold in this case), we will view positions in both gold and DGLD as still open and the stop-loss for DGLD would have to be moved lower. On the other hand, if gold moves to a stop-loss level but DGLD doesn't, then we will view both positions (in gold and DGLD) as closed. In other words, since it's not possible to be 100% certain that each related instrument moves to a given level when the underlying instrument does, we can't provide levels that would be binding. The levels that we do provide are our best estimate of the levels that will correspond to the levels in the underlying assets, but it will be the underlying assets that one will need to focus on regarding the signs pointing to closing a given position or keeping it open. We might adjust the levels in the "additional instruments" without adjusting the levels in the "main instruments", which will simply mean that we have improved our estimation of these levels, not that we changed our outlook on the markets. We are already working on a tool that would update these levels on a daily basis for the most popular ETFs, ETNs and individual mining stocks.
Our preferred ways to invest in and to trade gold along with the reasoning can be found in the how to buy gold section. Additionally, our preferred ETFs and ETNs can be found in our Gold & Silver ETF Ranking.
As a reminder, Gold & Silver Trading Alerts are posted before or on each trading day (we usually post them before the opening bell, but we don't promise doing that each day). If there's anything urgent, we will send you an additional small alert before posting the main one.
Thank you.
Sincerely,
Przemyslaw Radomski, CFA
Editor-in-chief, Gold & Silver Fund Manager

