

Briefly: in our opinion, full (300% of the regular position size) speculative short positions in mining stocks are justified from the risk/reward point of view at the moment of publishing this Alert.
We just saw another gargantuan sign pointing to precious metals' very likely turnaround. And once again, most investors are either not aware of it, or are choosing to ignore it (gold can only go up, right?). The signal came from the Gold Miners Bullish Percent Index. It's been months... or perhaps even years since we covered this index and the reason is simple. It was not providing any major indications, and it was plain boring.
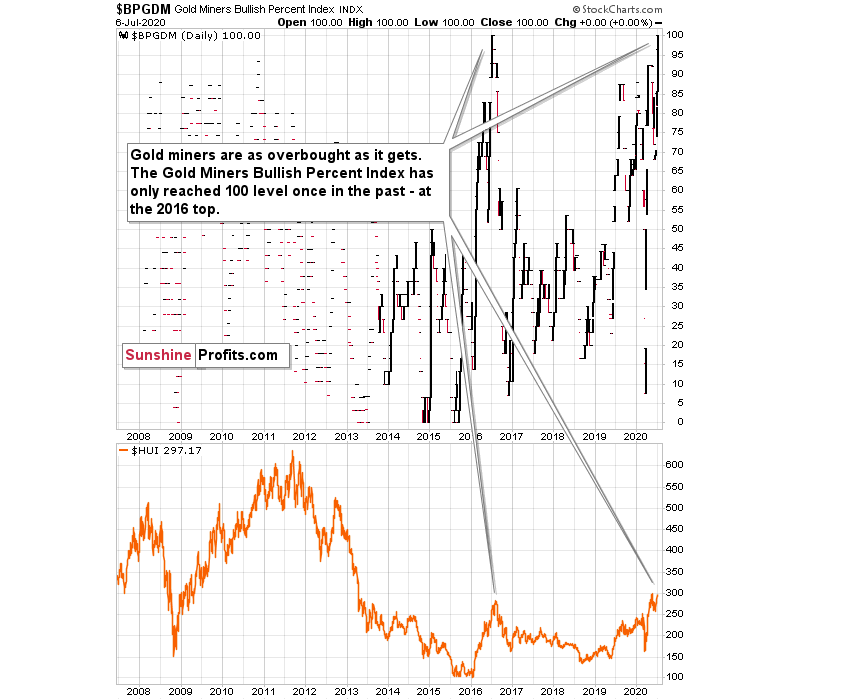
The index rose from the abyss of boredom to an exciting pedestal as it moved to the 100 level - the highest level that it can achieve. Why is this important? Let's recall what this index means:
The Gold Miners Bullish Percent Index ($BPGDM) is a gauge of overbought and oversold conditions for the gold mining sector. It is a breadth indicator based on the number of stocks with Point & Figure buy signals (a Point & Figure chart emphasizes strong moves while ignoring small ones) within this index.
The index can take value between 0 and 100, 0 meaning extremely oversold conditions and 100 meaning extremely overbought conditions. There were only a few times when the index moved to 0 and there was only one time when it moved to 100 (before the current situation).
Practically in all previous cases, the signals were very meaningful. The first time the index moved to 0, was when gold stocks hit the rock bottom in 2008. The next time was in 2013, when the gold miners were already after a huge decline, and while it didn't mark the final bottom, it did mean that the biggest part of the move was already over and that the bottom is going to be in shortly. Then, we saw two more times when the index moved to 0: in late 2014 and in mid-2015. On both occasions, gold miners formed major bottoms.
The only previous case when the index moved to 100, was at the 2016 top, when the index was topping close to the current price levels.
And... That's it. There were no more extreme signals since this index was introduced in 2008.
With only 5 extreme cases in the past and a near-100% efficiency in timing the major turning points, the fact that the Gold Miners Bullish Percent Index just hit the 100 level is a screaming sell signal for the precious metals sector.
It perfectly fits the tendency for the USD Index to start huge rallies close to the middle of the year, and gold's long-term turning point.
In yesterday's gold trading analysis, we emphasized the following major facts:
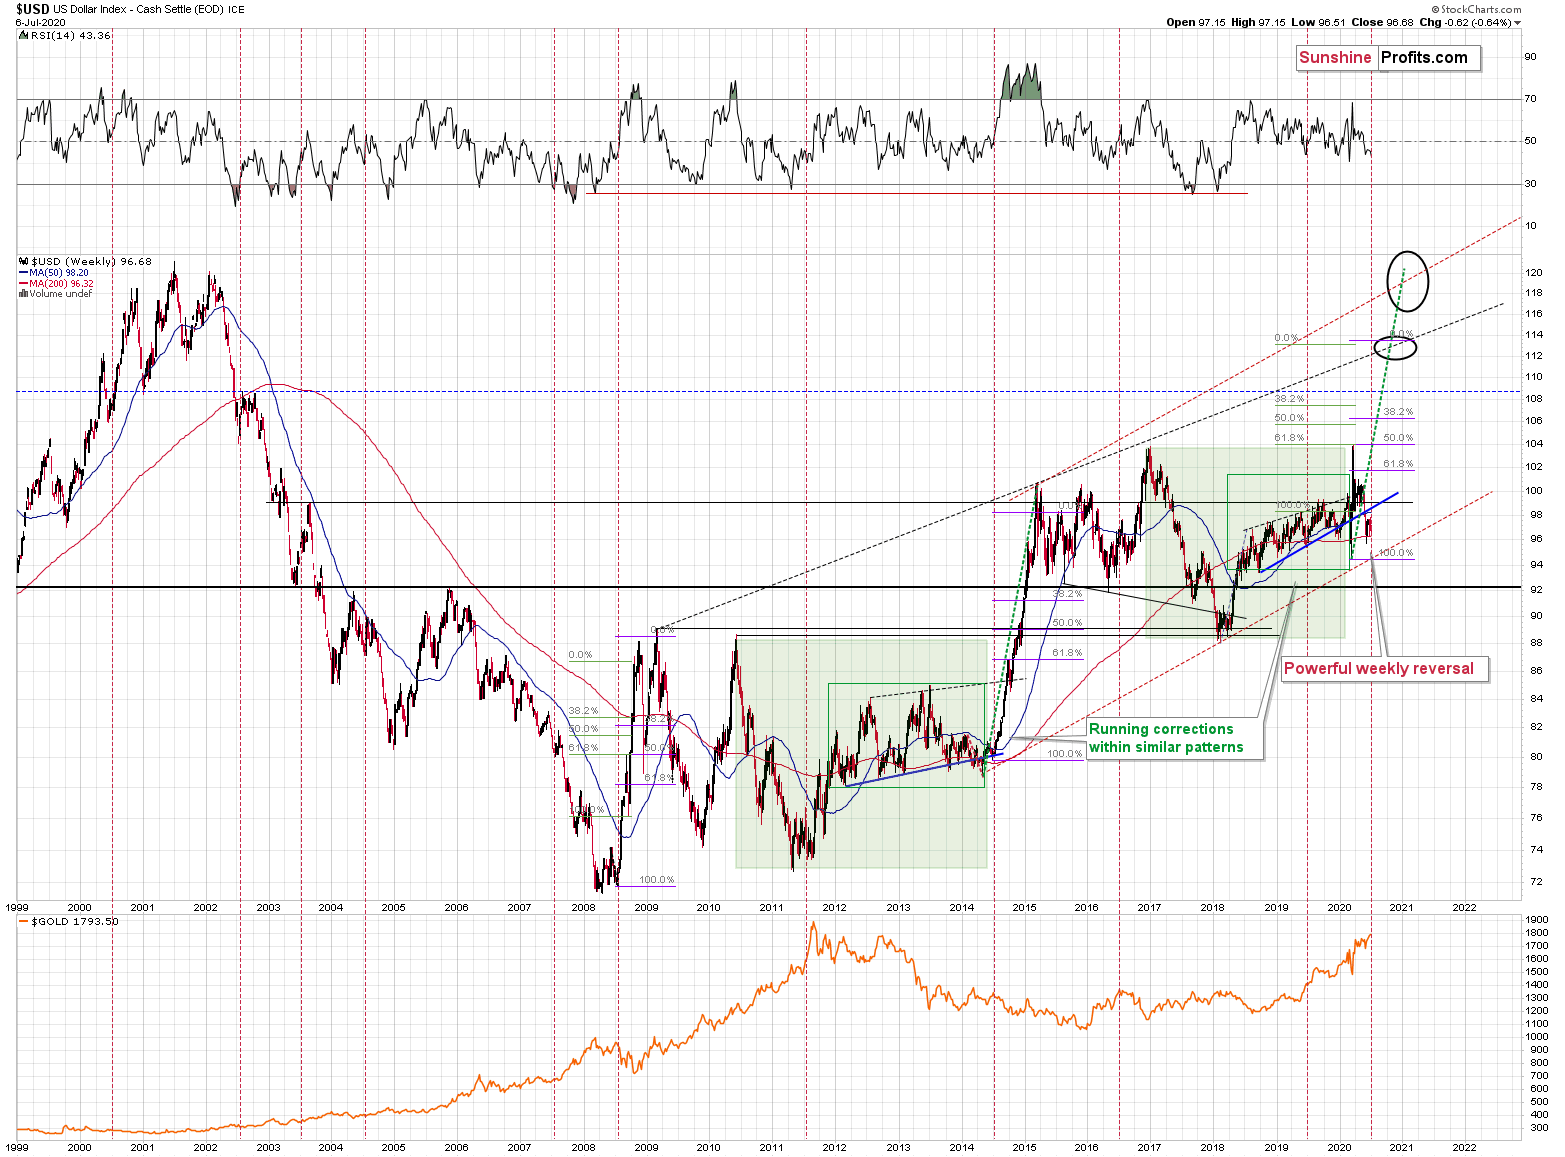
- In mid 2008, the USDX first moved lower before truly soaring.
- In Q3 2011 (close to the middle of the year), the USDX also moved lower, forming a broad bottom, before soaring sharply.
- In mid 2014, the USD Index also dipped while being between the 50-day moving average (marked with blue) and the 200-day moving average (marked with red) - exactly where they are right now.
- In 2016, the USD Index moved a bit lower and reversed (at about 93) before the middle of the year. That was also when gold topped.
The biggest rallies in the USD Index of the previous years started in the middle of the year. But this specific pattern goes beyond that. There were numerous smaller rallies that started in the middle of the year or close to it. There were also tops, which would indicate that mid-year is actually an important turning point for the U.S. currency, but most of them were bottoms, especially in recent years. Since the most recent move was down, the implications are bullish for the USDX and bearish for gold.
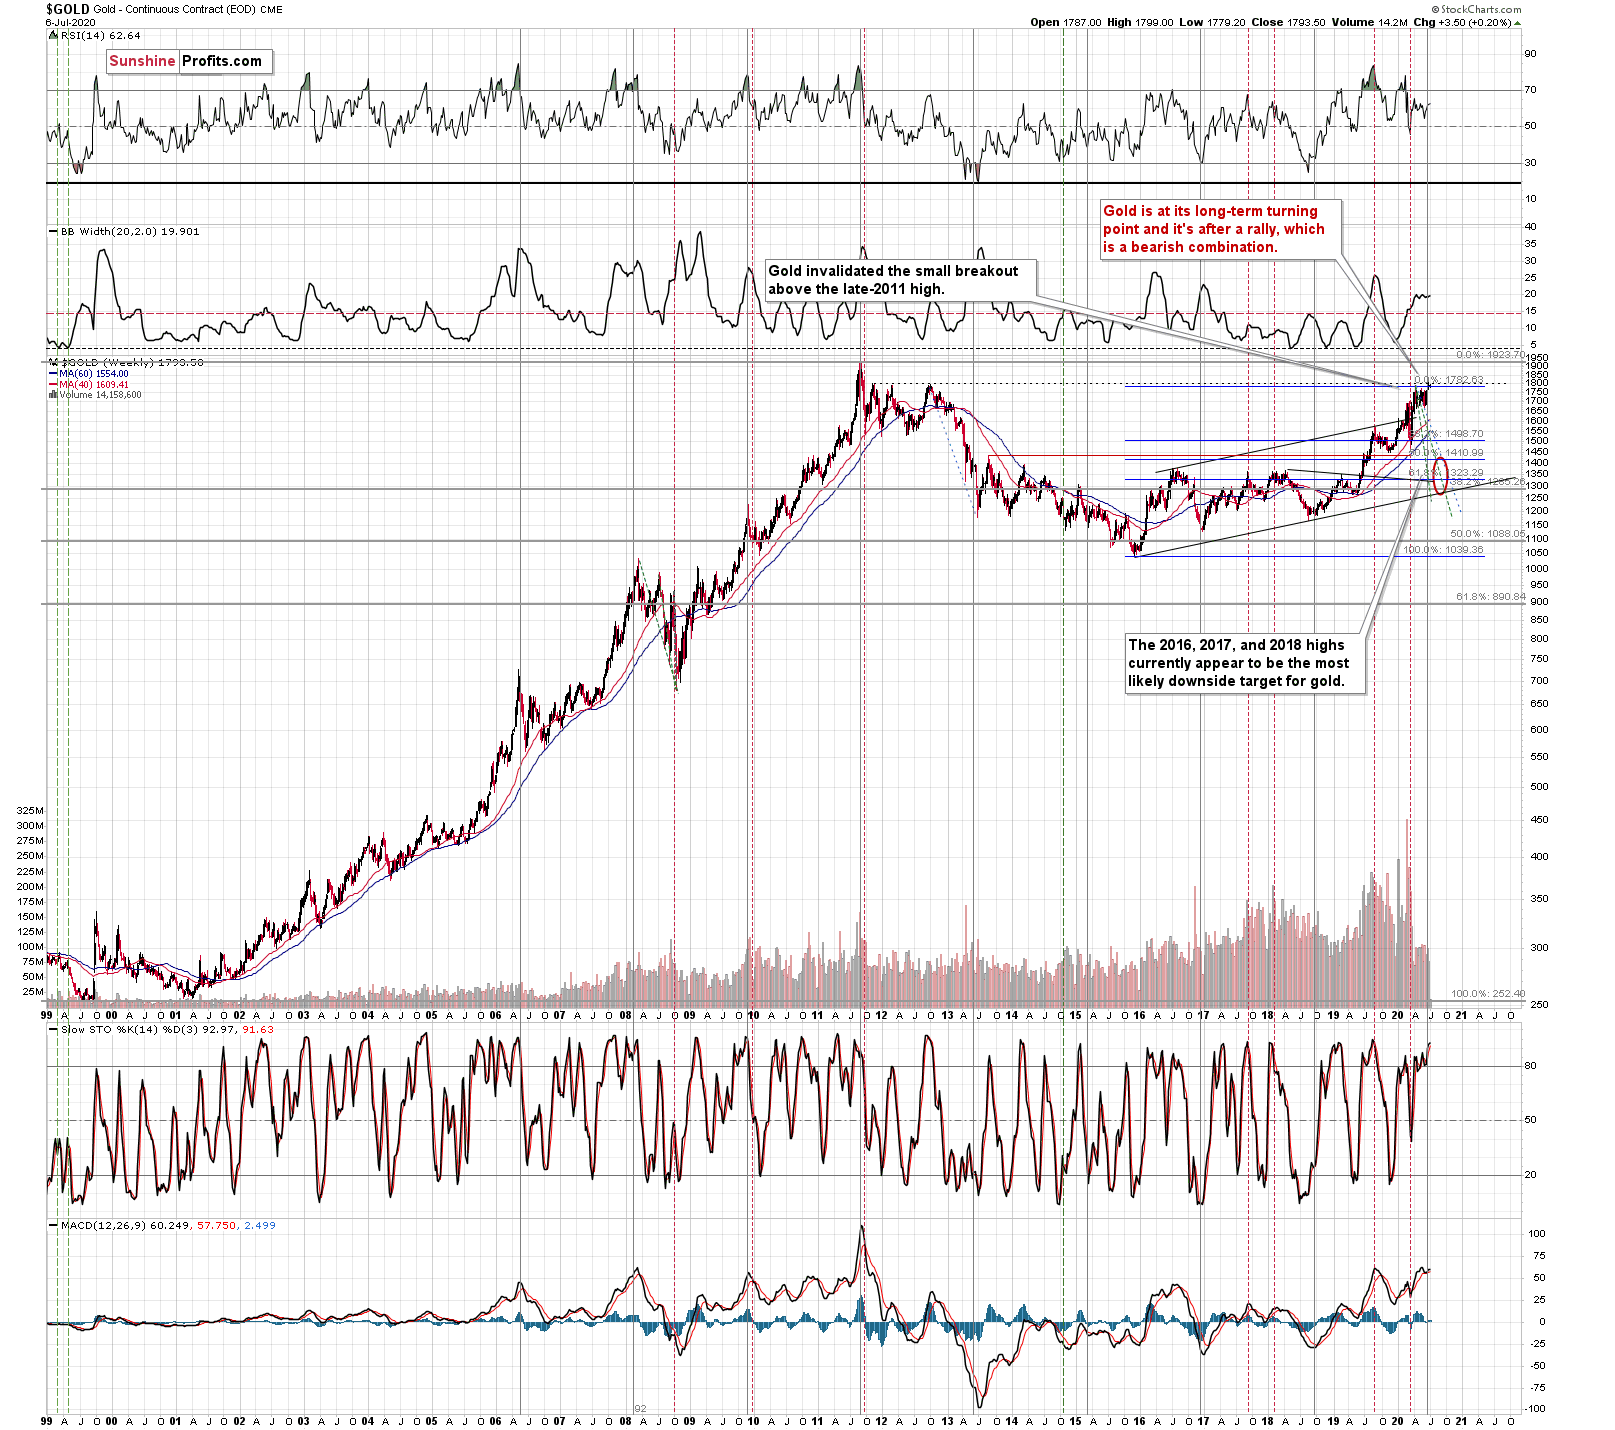
Gold's very long-term turning point is here and since the most recent move was to the upside, the implications are bearish. They are particularly bearish since gold just invalidated the tiny breakout above its November 2011 high.
Naturally, everyone's trading falls within their responsibility, but in our opinion, if there ever was a time to either enter a short position in the miners or to increase its size if it wasn't already sizable, it's now. We made money on the March decline and on the March rebound, and it seems that another massive slide is about to start. When everyone is on one side of the boat, it's a good idea to be on the other side, and the Gold Miners Bullish Percent Index literally indicates that this is the case with mining stocks.
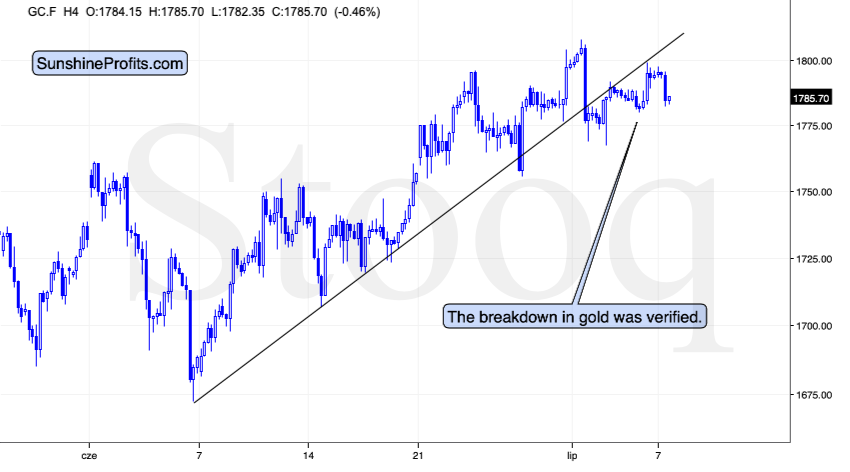
On a short-term basis, we see that has not only gold broken below its rising support line, but it actually managed to verify this breakdown by moving once again to the previously broken line and verifying it as resistance.
Meanwhile, the technical picture for the mining stocks continues to show the same thing that we described yesterday:
Miners reversed and ended the day over 1% lower, even though the GLD ETF ended the day slightly higher. Consequently, this piece of the puzzle seems to be in.
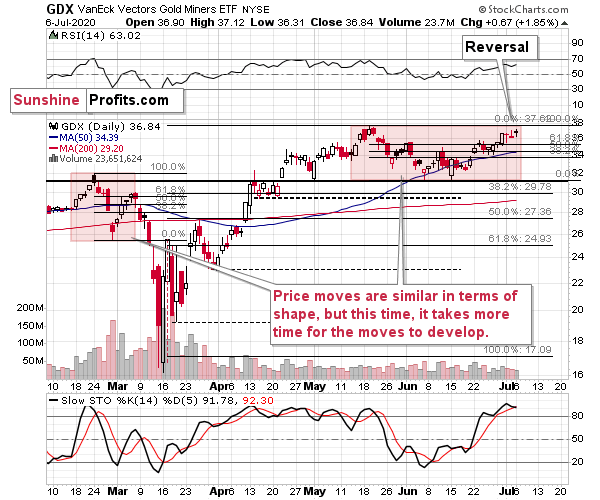
Remember when we wrote that the situation right now is similar to what happened in March, but this time it takes longer for everything to develop due to the change in market's perception of risk? To make a long story short, the March panic was because the entire world was dealing with the unknown, which exacerbated the fear. Right now, the situation is worse, and it goes worse almost on a daily basis, but people are not as afraid. The economic implications don't appear so dire either. And it's definitely nothing unknown - we more or less know what to expect.
This means that we're likely to see a repeat of what we saw in March, we're likely to see it in "slow motion", at least for some time. Please note that even slow-motion mode of the mid-March plunge would still be very volatile.
The areas that we marked with red rectangles are similar in terms of shape, but the current one is about 4x longer. The previous pattern was characterized by a decline and a correction that took more or less the same time to complete. If we're about to see something similar also this time, then we can expect the top to be formed this week.
If the March decline took 5 trading days and the price moves are taking 4x as long this time, then perhaps we would see a monthly decline to the final lows instead of a weekly one. This would serve as a perfect "handle" for the massive, long-term "cup and handle" pattern in gold.
Summary
Summing up, the extreme overbought reading from the Gold Miners Bullish Percent Index is a perfectly bearish confirmation for points that we made previously about gold and the USD Index.
Naturally, everyone's trading is their responsibility, but in our opinion, if there ever was a time to either enter a short position in the miners or to increase its size if it wasn't already sizable, it's now. We made money on the March decline and on the March rebound, and it seems that another massive slide is about to start. When everyone is on one side of the boat, it's a good idea to be on the other side, and the Gold Miners Bullish Percent Index literally indicates that this is the case with mining stocks.
After the sell-off (that takes gold below $1,400), we expect the precious metals to rally significantly. The final decline might take as little as 1-6 weeks, so it's important to stay alert to any changes.
Most importantly - stay healthy and safe. We made a lot of money on the March decline and the subsequent rebound (its initial part) price moves (and we'll likely make much more in the following weeks and months), but you have to be healthy to really enjoy the results.
As always, we'll keep you - our subscribers - informed.
To summarize:
Trading capital (supplementary part of the portfolio; our opinion): Full speculative short positions (300% of the full position) in mining stocks is justified from the risk to reward point of view with the following binding exit profit-take price levels:
Senior mining stocks (price levels for the GDX ETF): binding profit-take exit price: $10.32; stop-loss: none (the volatility is too big to justify a SL order in case of this particular trade); binding profit-take level for the DUST ETF: $231.75; stop-loss for the DUST ETF: none (the volatility is too big to justify a SL order in case of this particular trade)
Junior mining stocks (price levels for the GDXJ ETF): binding profit-take exit price: $9.57; stop-loss: none (the volatility is too big to justify a SL order in case of this particular trade); binding profit-take level for the JDST ETF: $284.25; stop-loss for the JDST ETF: none (the volatility is too big to justify a SL order in case of this particular trade)
For-your-information targets (our opinion; we continue to think that mining stocks are the preferred way of taking advantage of the upcoming price move, but if for whatever reason one wants / has to use silver or gold for this trade, we are providing the details anyway. In our view, silver has greater potential than gold does):
Silver futures downside profit-take exit price: $8.58 (the downside potential for silver is significant, but likely not as big as the one in the mining stocks)
Gold futures downside profit-take exit price: $1,382 (the target for gold is least clear; it might drop to even $1,170 or so; the downside potential for gold is significant, but likely not as big as the one in the mining stocks or silver)
Long-term capital (core part of the portfolio; our opinion): No positions (in other words: cash
Insurance capital (core part of the portfolio; our opinion): Full position
Whether you already subscribed or not, we encourage you to find out how to make the most of our alerts and read our replies to the most common alert-and-gold-trading-related-questions.
Please note that the in the trading section we describe the situation for the day that the alert is posted. In other words, it we are writing about a speculative position, it means that it is up-to-date on the day it was posted. We are also featuring the initial target prices, so that you can decide whether keeping a position on a given day is something that is in tune with your approach (some moves are too small for medium-term traders and some might appear too big for day-traders).
Plus, you might want to read why our stop-loss orders are usually relatively far from the current price.
Please note that a full position doesn't mean using all of the capital for a given trade. You will find details on our thoughts on gold portfolio structuring in the Key Insights section on our website.
As a reminder - "initial target price" means exactly that - an "initial" one, it's not a price level at which we suggest closing positions. If this becomes the case (like it did in the previous trade) we will refer to these levels as levels of exit orders (exactly as we've done previously). Stop-loss levels, however, are naturally not "initial", but something that, in our opinion, might be entered as an order.
Since it is impossible to synchronize target prices and stop-loss levels for all the ETFs and ETNs with the main markets that we provide these levels for (gold, silver and mining stocks - the GDX ETF), the stop-loss levels and target prices for other ETNs and ETF (among other: UGLD, DGLD, USLV, DSLV, NUGT, DUST, JNUG, JDST) are provided as supplementary, and not as "final". This means that if a stop-loss or a target level is reached for any of the "additional instruments" (DGLD for instance), but not for the "main instrument" (gold in this case), we will view positions in both gold and DGLD as still open and the stop-loss for DGLD would have to be moved lower. On the other hand, if gold moves to a stop-loss level but DGLD doesn't, then we will view both positions (in gold and DGLD) as closed. In other words, since it's not possible to be 100% certain that each related instrument moves to a given level when the underlying instrument does, we can't provide levels that would be binding. The levels that we do provide are our best estimate of the levels that will correspond to the levels in the underlying assets, but it will be the underlying assets that one will need to focus on regarding the signs pointing to closing a given position or keeping it open. We might adjust the levels in the "additional instruments" without adjusting the levels in the "main instruments", which will simply mean that we have improved our estimation of these levels, not that we changed our outlook on the markets. We are already working on a tool that would update these levels on a daily basis for the most popular ETFs, ETNs and individual mining stocks.
Our preferred ways to invest in and to trade gold along with the reasoning can be found in the how to buy gold section. Additionally, our preferred ETFs and ETNs can be found in our Gold & Silver ETF Ranking.
As a reminder, Gold & Silver Trading Alerts are posted before or on each trading day (we usually post them before the opening bell, but we don't promise doing that each day). If there's anything urgent, we will send you an additional small alert before posting the main one.
Thank you.
Sincerely,
Przemyslaw Radomski, CFA
Editor-in-chief, Gold & Silver Fund Manager

