

Briefly: in our opinion, full (300% of the regular position size) speculative short positions in junior mining stocks are justified from the risk/reward point of view at the moment of publishing this Alert.
Based on the comments below yesterday’s regular analysis and on yesterday’s intraday follow-up, you know that yesterday’s post-CPI rally in gold is unlikely to trigger a bigger rally, and it’s much more likely to be one of the final steps in the topping formation.
Here’s how it looks on the charts after the closing bell.
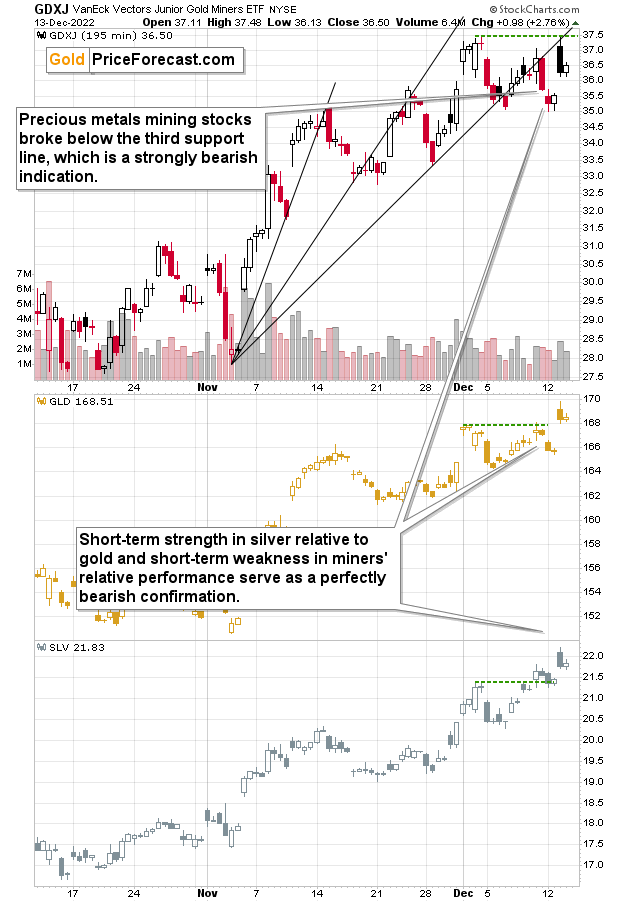
Junior miners tested their previous December high, and then they declined visibly once again. They even moved below the very recent intraday highs.
At the same time, gold moved to new December highs, and silver moved even higher. Precisely, it too moved to new December highs, but in the case of silver, the short-term uptrend is even clearer.
I’ve written quite a lot about what this kind of relative performance implies for the outlook, but I think it would be a good idea to re-state it once again. After all, it's the most difficult to remain calm and analytical at the tops and bottoms—when emotions are at their highest.
On Monday, I wrote the following:
The key thing that you can see above is that the way in which those three parts of the precious metals market behaved on Friday differed considerably.
While gold was more or less neutral, silver moved much higher, while gold miners moved… Visibly lower. In particular, it was the final few hours of Friday’s session (the last candlestick) that made the difference.
If used horizontally, green lines make it easier to compare the most recent performance to the early-December high. And:
- The GLD ended the previous week very close to that high.
- The SLV ended the week above that high.
- The GDXJ ended the week well below that high.
This means that silver was just particularly strong relative to gold, and miners were just particularly weak relative to gold.
Gold miners tend to be early in a given move, while silver prices tend to lag / catch-up in the final parts of the move. That’s what we’ve been able to see in the precious metals market for many years. Naturally, there were exceptions, but the above rule still holds for the majority of the time, especially when it’s both silver-gold and miners-gold links that point to the same thing.
Now, the miners-gold link suggests that a new downtrend is starting, because miners were weak relative to gold to a big extent.
The performance of the silver price, on the other hand, suggests that the rally is coming to an end, as it is clearly playing catch-up.
Yesterday’s price action is a continuation of the above-mentioned indications.
Meanwhile, the USD Index appears to be forming a double-bottom pattern close to its 2016/2017 and 2020 highs.
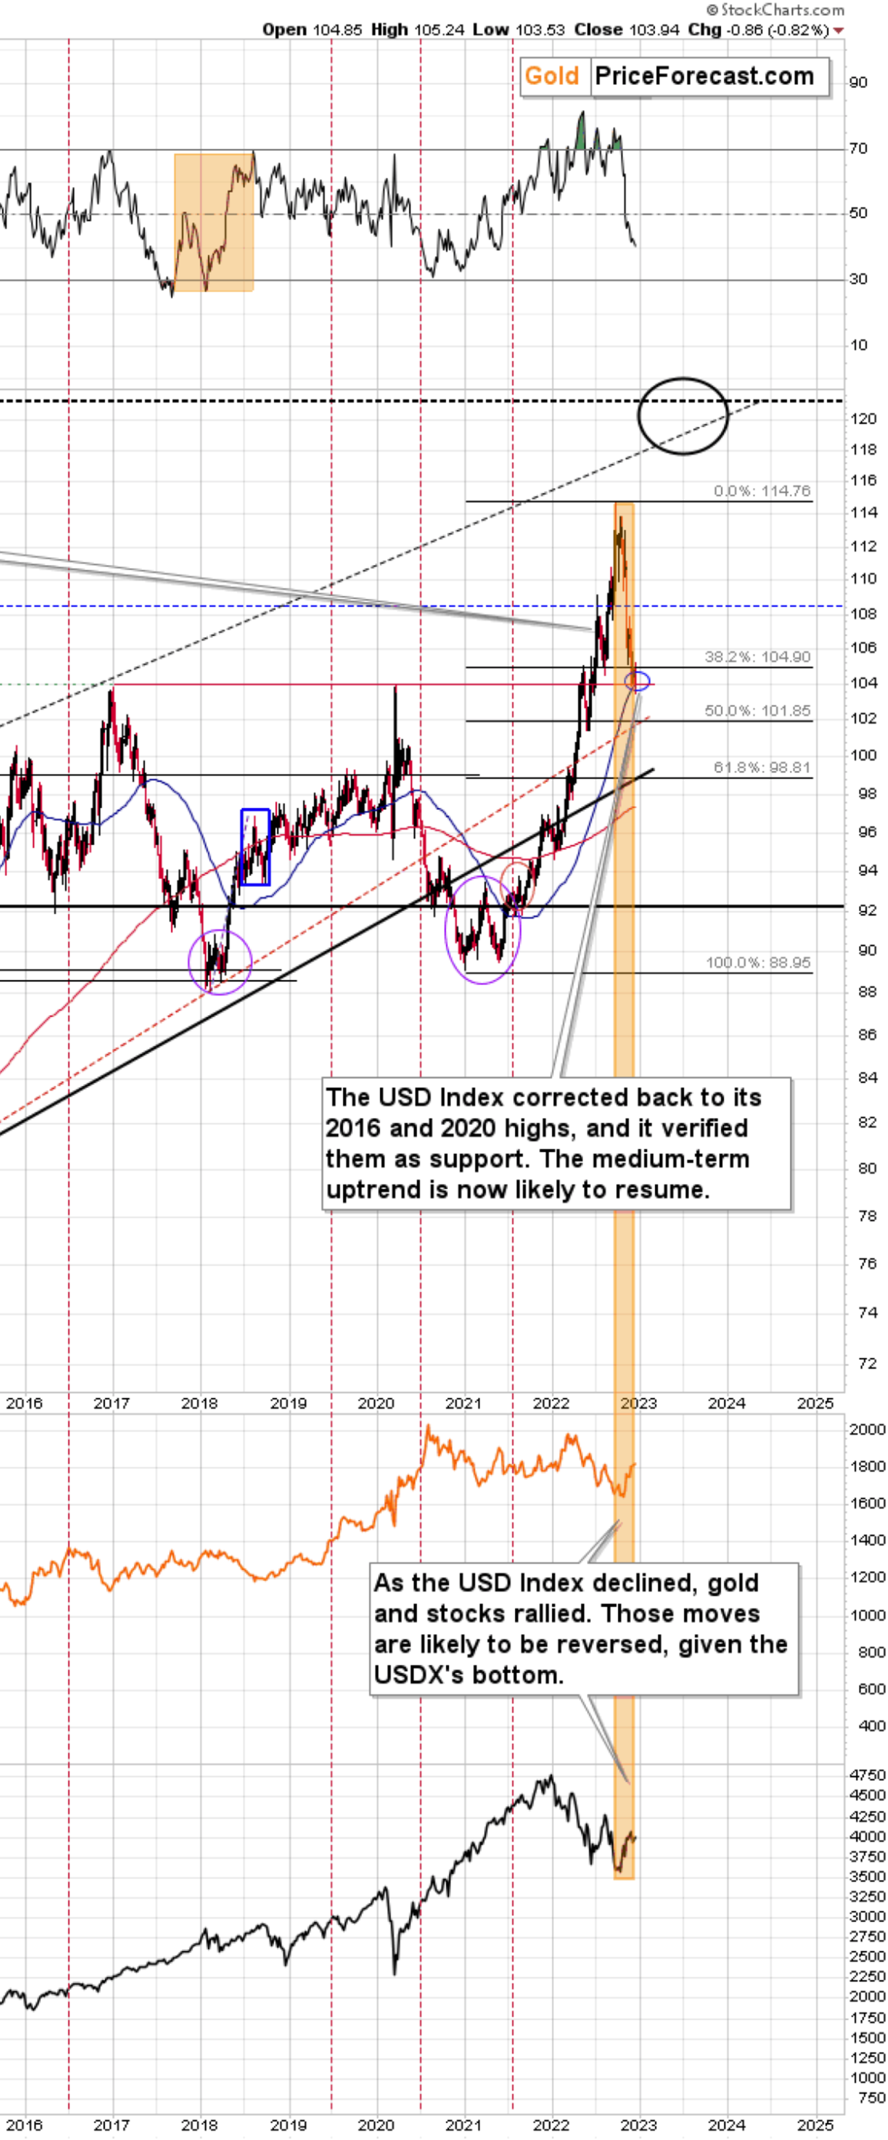
While it might not be obvious based on the above chart, yesterday’s close in the USDX was higher than the highest daily close in 2016, 2017, and 2020.
There was no important breakdown whatsoever.
And without an important breakdown in the USD Index, there’s little to no reason to think that the precious metals sector has broken higher and that a new uptrend is beginning.
No.
It’s quite the opposite, in my view. The corrective upswings in the markets appear to be ending.
Having said that, let’s take a look at the markets from a more fundamental angle.
Gold Writes Inflation’s Obituary: Fact or Fiction?
With the headline Consumer Price Index (CPI) coming in at 7.1% year-over-year (YoY) versus 7.3% YoY expected, the bulls felt like Christmas came early. However, we warned before the release:
With oil prices declining in November, they should put downward pressure on the headline CPI; and with investors’ emotional reactions poised to persist, the noise could be amplified.
Thus, with the headline CPI continuing its deceleration on Dec. 13, it was far from unexpected.
Please see below:
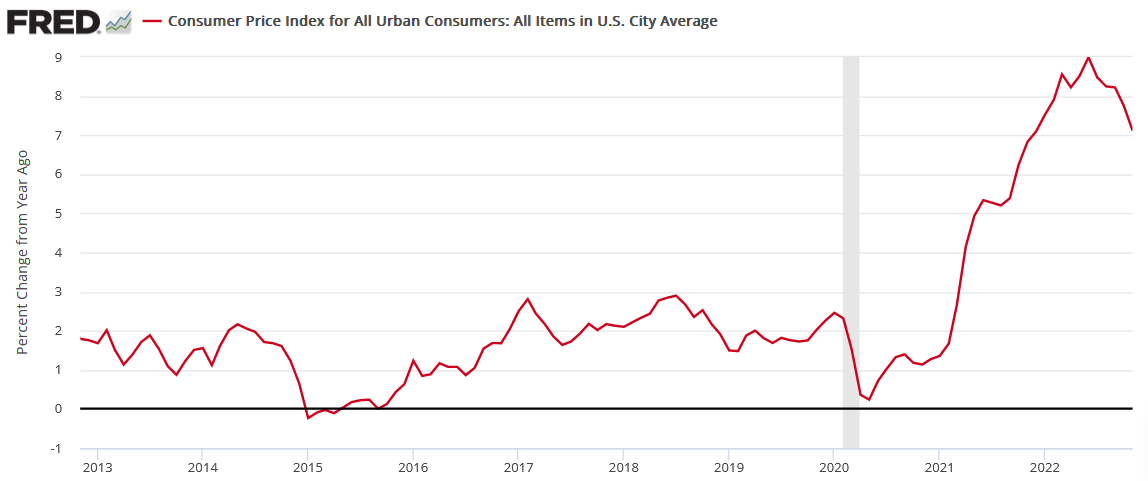
But, since oil prices have an outsized influence on the headline CPI, concern has arisen that further weakness in the former could spell trouble for the latter. Yet, please remember that optimism is contagious, and the positivity that uplifts stocks and the gold price filter across other markets.
For example, the USD Index and the U.S. 10-Year real yield declined on Dec. 13, as risk-on currencies and bonds were bid. Therefore, the ‘pivot trade’ was on full display, as a less hawkish Fed is bullish for the euro, Treasury bonds and other risk assets.
Moreover, the recent decline in oil prices was driven by investors’ misguided fears of an imminent recession. In a nutshell: if the global economy is on the brink of collapse, demand for oil should suffer mightily.
Please see below:
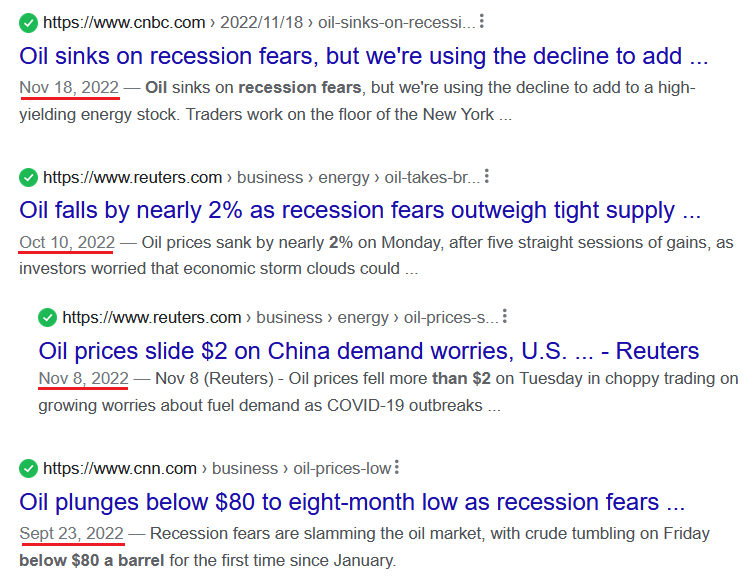 Source: Google
To explain, the various headlines above depict the recession sentiment confronting the oil market since late September. As you can see, “recession fears” have been making the rounds, and these fears helped reduce oil prices, which helped reduce the headline CPI. We explained the phenomenon on Dec. 13:
The crowd believes that lower inflation is a linear process of positive results. However, the pessimism that confronted the financial markets from mid-August to mid-October lowered asset prices and helped calm today’s inflation metrics. Conversely, with that pessimism reversing recently and financial conditions loosening, the current optimism sets the stage for higher inflation over the medium term.
Furthermore, market participants don’t realize that the inflation merry-go-round will spin if they keep overreacting to relatively immaterial progress. In other words: investors’ hopes for a dovish pivot actually reduce the chances of one occurring.
To that point, with risk assets rising amid the misguided optimism, guess who outperformed on Dec. 13?
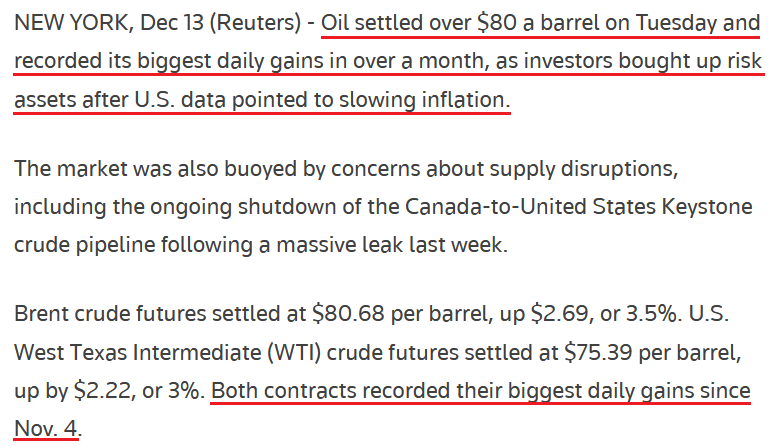 Source: Reuters
Consequently, it’s quite humorous how predictable the consensus has become. Remember, when a hawkish Fed creates recession anxiety, asset prices fall, which helps reduce inflation. In contrast, when a dovish Fed (or the perception of one) reduces recession anxiety, asset prices rally, which spurs more inflation. That’s why we wrote investors’ hopes for a dovish pivot actually reduce the chances of one occurring.
So, with the shoe now on the other foot, the mild progress realized when sentiment was depressed is poised to reverse now that sentiment is optimistic.
In addition, the core CPI has already delivered two head fakes since 2021.
Please see below:
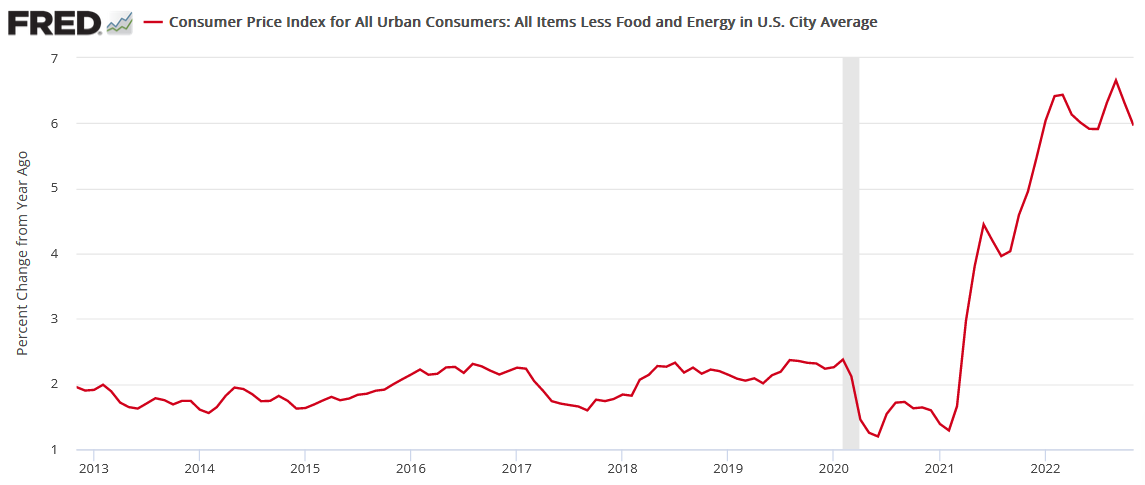
To explain, the red line above tracks the YoY percentage change in the core CPI, which excludes the inflationary impact of food and energy. If you analyze the right side of the chart, you can see that the metric declined from June to August 2021 before hitting a new high, and also declined from March to July 2022 before hitting a new high. As a result, the crowd should regret overemphasizing the immaterial progress.
Now, the most important development on Dec. 13 was the behavior of the Sticky CPIs. To explain, we wrote on Nov. 11:
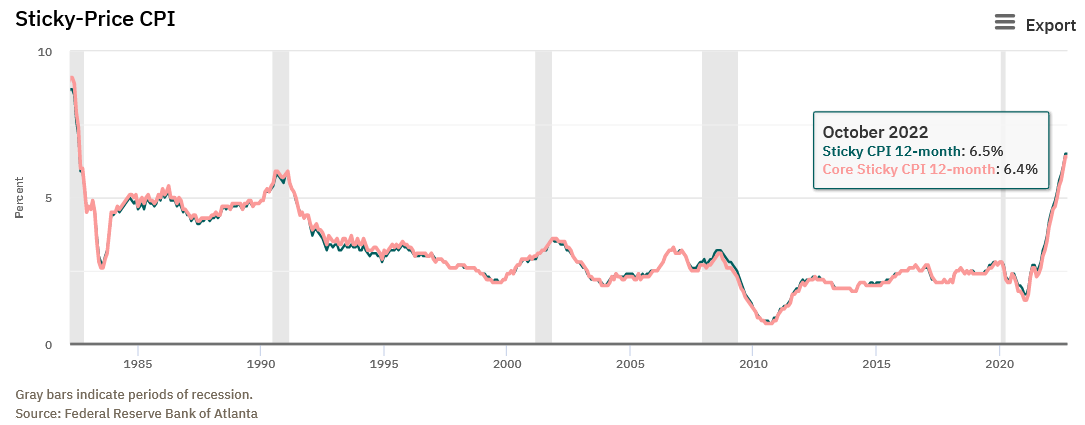
The blue and pink lines above track the YoY percentage changes in the Sticky and core Sticky (excluding food and energy) CPIs. If you analyze the right side of the chart, you can see that both metrics are at their highest levels since 1982.
For context, the Atlanta Fed highlighted the reliability of the Sticky CPI. Researches stated:
“The Sticky CPI is calculated from a subset of goods and services included in the CPI that change price relatively infrequently. Because these goods and services change price relatively infrequently, they are thought to incorporate expectations about future inflation to a greater degree than prices that change on a more frequent basis. One possible explanation for sticky prices could be the costs firms incur when changing price.”
Furthermore, the October 2022 readings of 6.5% and 6.4% match the peaks from September, so while inflation may seem like an old problem, investor sentiment is significantly out of touch with reality.
Therefore, with the headline and core Sticky CPIs hitting new 2022 highs on Dec. 13, broad-based inflation continues to accelerate, not decelerate.
Please see below:
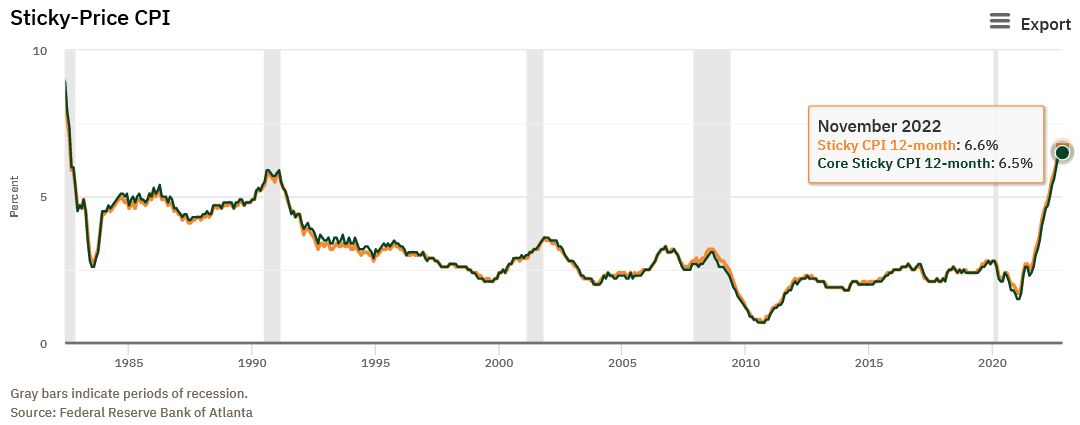
To explain, the November results showed that the headline and core Sticky CPIs hit 6.6% and 6.5% YoY, an increase from the 6.5% and 6.4% YoY realized in October. So, while the crowd celebrated oil prices’ impact on the headline CPI, inflation is much more prevalent; and when the harsh reality shifts sentiment over the medium term, the gold price should confront plenty of downside.
Continuing the theme, data from Hedgeye highlights the crowds’ willingness to buy into uninformed narratives.
Please see below:
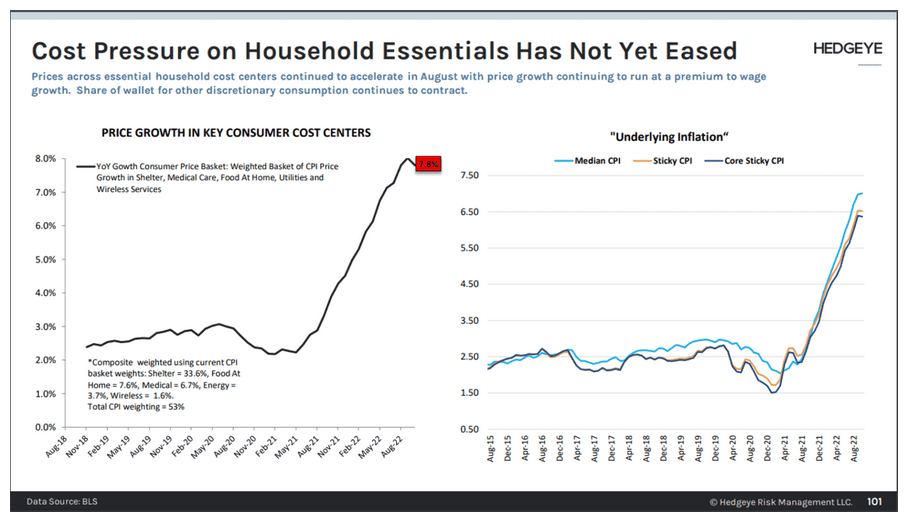
To explain, the chart on the right depicts the Sticky CPI results shown above, while the chart on the left represents the cost of goods that are most used by consumers. For context, the basket includes shelter, food at home, medical, energy and wireless services.
If you analyze the red box near the top, you can see that the basket is running at 7.8% YoY; and while market participants believe that inflation will go quietly into the night, the economic data suggests otherwise.
Overall, misguided hope continues to dominate the financial markets and uplift the gold price. Despite the historical lessons learned and the diverging strength of the Sticky CPIs, the crowd doesn’t see the connection between their optimism/pessimism and the movement of inflation. As a result, when the next ‘surprise’ reverses the current optimism, gold’s downside could be immense.
Stocks and Silver Stay Sky-High
After the S&P 500 broke below its two-month rising support line, the bears regained control of the general stock market. However, with the index ratcheting higher amid the inflation optimism on Dec. 13, the FOMC and Chairman Jerome Powell’s press conference are next on the fundamental docket.
Moreover, with silver closing at a new monthly high (though, it still couldn’t hold $24), the white metal and the S&P 500 have benefited from bullish seasonality, a weaker USD Index and lower U.S. real yields. But, with the crowd misjudging the fundamental path ahead, the S&P 500 could send the silver price into a nosedive.
For example, liquidity-fueled assets like Bitcoin and ‘profitless tech’ have borne the brunt of a hawkish Fed and higher interest rates in 2022. In contrast, with the U.S. economy remaining resilient, economically-sensitive sectors like materials, energy, industrials and financials have fared much better, and the Dow Jones Industrial Average (DJIA) has materially outperformed the S&P 500.
Please see below:
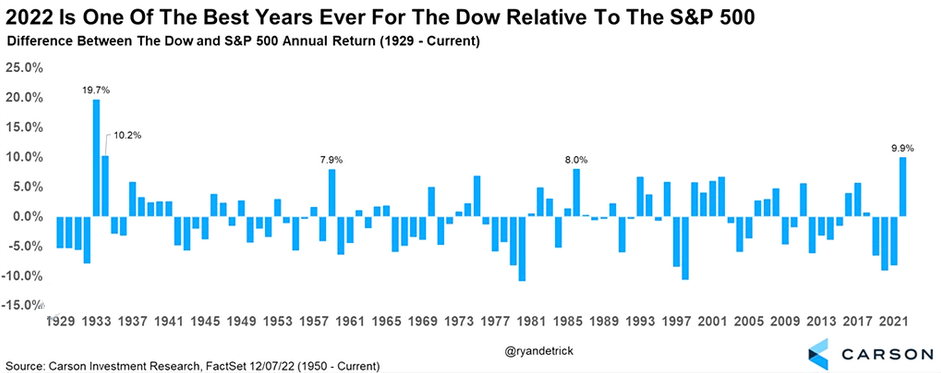
To explain, the blue bar on the right side of the chart shows that the DJIA has surpassed the S&P 500 by nearly 10% as of Dec. 7, and the relative strength is the largest since the 1930s. As such, investors have been rotating money out of QE beneficiaries and into ‘old economy’ stocks rather than liquidating their portfolios.
Likewise, with Bank of America’s U.S. Regime Indicator still signaling a “late cycle,” the panic witnessed during prior bear markets still awaits us.
Please see below:
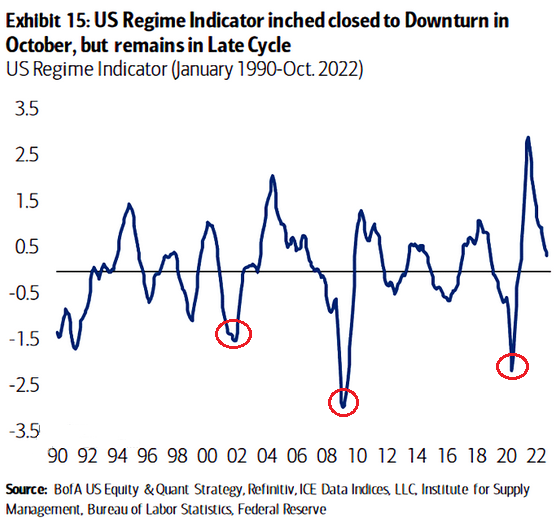
To explain, the blue line above tracks Bank of America’s U.S. Regime Indicator. If you analyze the right side of the chart, you can see that the metric signaled modest growth as of the end of October. Conversely, the red circles show how the indicator turned deeply negative during the last three recessions, and with every inflation fight since 1954 ending with a recession, the ‘old economy’ should confront material downside before the next upturn begins.
Remember, the U.S. federal funds rate (FFR) has also eclipsed the peak YoY core CPI in every inflation fight since 1961; and since the YoY core CPI peaked (for now) at 6.66% in September 2022, the historically-implied peak FFR is at least 6.67%. Thus, economic growth should suffer mightily as the Fed’s inflation fight continues in 2023.
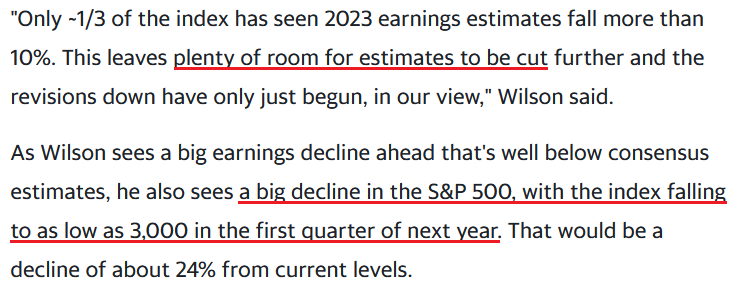
To that point, Morgan Stanley’s Chief U.S. Equity Strategist Mike Wilson said on Dec. 13:
“The magnitude and timing of the earnings decline we expect implies that labor market risk may be underappreciated…. We recall a similar set up in August 2008 from an EPS standpoint to remind investors the market usually takes longer to price such earnings declines than one might think/expect.”
So, with market participants hiding out in economically-sensitive sectors like materials, energy, industrials and financials (as well as defensive sectors like health care, consumer staples and utilities), the drawdowns that hit the QE beneficiaries in 2022 should hit the ‘old economy’ in 2023.
Please see below:
 Source: Yahoo Finance
Also noteworthy, the NFIB released its Small Business Optimism Index on Dec. 13. The report stated:
“Inflation remains the top business problem for small business owners, with 32% of owners reporting it as their single most important problem in operating their business, five points lower than July’s highest reading since the fourth quarter of 1979.”
In addition:
“The net percent of owners raising average selling prices increased one point from October to a net 51% seasonally adjusted.”
On top of that, the largest monthly increases occurred in categories that are bullish for the FFR.
Please see below:
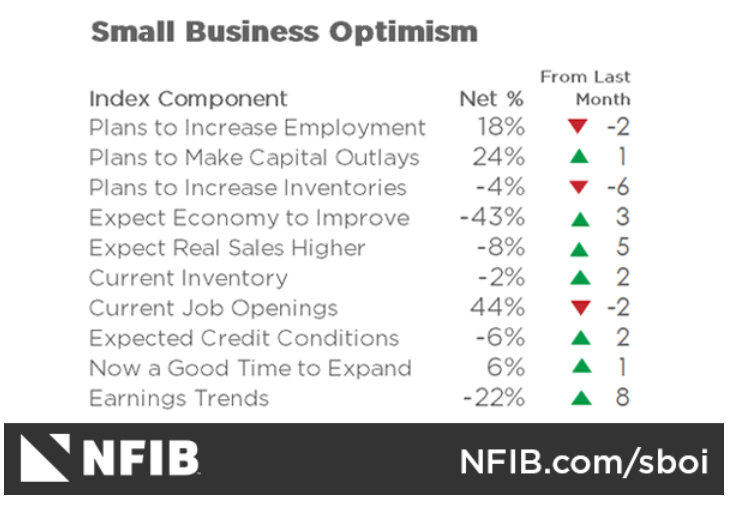
To explain, the net change in earnings trends increased by eight points month-over-month (MoM), while the net change in real sales increased by five points MoM. As a result, small businesses are becoming more optimistic.
More importantly, their “single most important problem” is inflation, not weak demand, and higher interest rates should persist in 2023, which is bearish for the S&P 500 and the silver price.
Please see below:
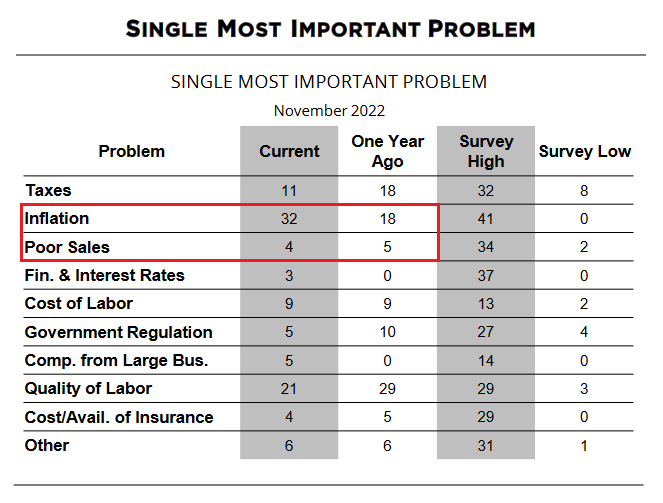 Source: NFIB
To explain, respondents noted that inflation is their “single most important problem,” with the reading increasing from 18 in November 2021 to 32 in November 2022. Conversely, those worried about poor sales declined from 5 in November 2021 to 4 in November 2022. As such, the Fed’s inflation fight should be one of attrition, and the ‘old economy’ should take a major hit as the liquidity drain continues.
Overall, silver’s fundamental and technical backdrops remain highly bearish, and we view the recent rally as a countertrend upswing within a medium-term downtrend. Therefore, while seasonality keeps the bulls’ spirits high, a final sell-off should occur before a long-term buying opportunity emerges.
The Bottom Line
It’s the FOMC’s show on Dec. 14, and investors will look for dovish clues in Powell’s speech. However, the reality is the fundamentals guide the Fed, not the other way around; and while Powell preached patience throughout 2021, he had to reverse course as inflation reigned. Consequently, with inflation still much more problematic than the consensus realizes, the FFR should rise substantially before it’s all said and done.
In conclusion, the PMs rallied on Dec. 13, as the CPI print upended the USD Index and the U.S. 10-Year real yield. But, with the crowd over-extrapolating inflation’s short-term weakness, history shows the pricing pressures don’t just wilt away alongside near record-low unemployment. As a result, we believe most of the economic pain hasn’t even begun, and risk assets have plenty of room to fall before the ominous implications are priced in.
Overview of the Upcoming Part of the Decline
- It seems to me that the corrective upswing is over (or about to be over) and that the next big move lower is already underway (or that it’s about to start).
- If we see a situation where miners slide in a meaningful and volatile way while silver doesn’t (it just declines moderately), I plan to – once again – switch from short positions in miners to short positions in silver. At this time, it’s too early to say at what price levels this could take place and if we get this kind of opportunity at all – perhaps with gold prices close to $1,500 - $1,550.
- I plan to switch from the short positions in junior mining stocks or silver (whichever I’ll have at that moment) to long positions in junior mining stocks when gold / mining stocks move to their 2020 lows (approximately). While I’m probably not going to write about it at this stage yet, this is when some investors might consider getting back in with their long-term investing capital (or perhaps 1/3 or 1/2 thereof).
- I plan to return to short positions in junior mining stocks after a rebound – and the rebound could take gold from about $1,450 to about $1,550, and it could take the GDXJ from about $20 to about $24. In other words, I’m currently planning to go long when GDXJ is close to $20 (which might take place when gold is close to $1,450), and I’m planning to exit this long position and re-enter the short position once we see a corrective rally to $24 in the GDXJ (which might take place when gold is close to $1,550).
- I plan to exit all remaining short positions once gold shows substantial strength relative to the USD Index while the latter is still rallying. This may be the case with gold prices close to $1,400 and GDXJ close to $15 . This moment (when gold performs very strongly against the rallying USD and miners are strong relative to gold after its substantial decline) is likely to be the best entry point for long-term investments, in my view. This can also happen with gold close to $1,400, but at the moment it’s too early to say with certainty.
- The above is based on the information available today, and it might change in the following days/weeks.
You will find my general overview of the outlook for gold on the chart below:
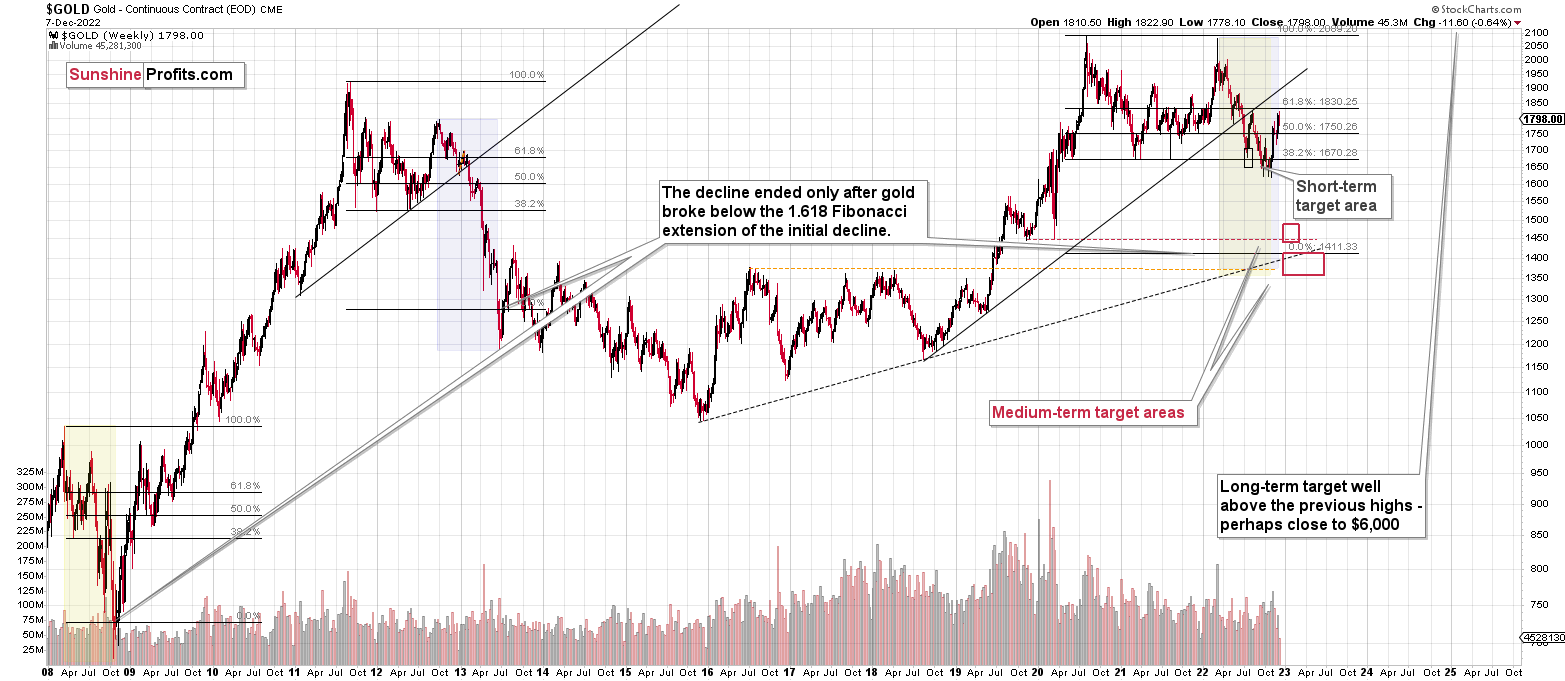
Please note that the above timing details are relatively broad and “for general overview only” – so that you know more or less what I think and how volatile I think the moves are likely to be – on an approximate basis. These time targets are not binding nor clear enough for me to think that they should be used for purchasing options, warrants, or similar instruments.
Letters to the Editor
There are no new letters for today, but I wanted to keep the below reminder in place, just to make sure that everyone had the chance to see it:
Please note that this section is going to go away within the next 1-8 weeks, as you can add comments/questions below the article on Golden Meadow – the platform that we’re using to provide our analyses. Your notification e-mails include an invitation link that allows you to access the “Gold Trading Alerts” space.
The first premium analysis had over 30 comments below it, and once I finish writing this article, I’ll head over to the comments section and catch up on yesterday’s comments.
Also, if you haven’t had the chance to see the video, in which I’m talking about the new platform and why we essentially moved from Sunshine Profits to Golden Meadow, I strongly encourage you to do so:
Summary
Summing up, it seems that the major bottom in the USD Index is in, while the correction in stocks, gold, silver, and mining stocks is over.
The nature of the recent corrections was mostly technical. No market moves up or down in a straight line, and seeing market corrections is rather normal. The excuse that markets used to correct this time was an incorrect (in my view) expectation that the Fed is going to make a dovish U-turn. The fact that even the positive employment numbers were ignored as a bearish indication of further rate hikes shows the extent of the recent/current irrationality.
However, as the irrationality ends, the medium-term trend is likely to resume. In the case of junior mining stocks, this trend is downward. The latter are likely to decline profoundly based on declines in both: gold and the stock market.
In my opinion, the current trading position is going to become profitable in the following weeks, and quite possibly in the following days. And while I can’t promise any kind of performance, I fully expect it to become very profitable before it’s over and to prolong our 2022 winning streak.
After the final sell-off (that takes gold to about $1,350-$1,500), I expect the precious metals to rally significantly. The final part of the decline might take as little as 1-5 weeks, so it's important to stay alert to any changes.
Also, as a reminder, I will be doing a live webinar tomorrow – on Thursday, Dec. 15 at 10 AM EST (4 PM CET) – it’s a live event for subscribers only, and it’s available without an additional payment. You have likely received an invitation message already, but if not, you can find more information here.
As always, we'll keep you – our subscribers – informed.
To summarize:
Trading capital (supplementary part of the portfolio; our opinion): Full speculative short positions (300% of the full position) in junior mining stocks are justified from the risk to reward point of view with the following binding exit profit-take price levels:
Mining stocks (price levels for the GDXJ ETF): binding profit-take exit price: $20.32; stop-loss: none (the volatility is too big to justify a stop-loss order in case of this particular trade)
Alternatively, if one seeks leverage, we’re providing the binding profit-take levels for the JDST (2x leveraged). The binding profit-take level for the JDST: $27.87; stop-loss for the JDST: none (the volatility is too big to justify a SL order in case of this particular trade).
For-your-information targets (our opinion; we continue to think that mining stocks are the preferred way of taking advantage of the upcoming price move, but if for whatever reason one wants / has to use silver or gold for this trade, we are providing the details anyway.):
Silver futures downside profit-take exit price: $12.32
SLV profit-take exit price: $11.32
ZSL profit-take exit price: $74.87
Gold futures downside profit-take exit price: $1,504
HGD.TO – alternative (Canadian) 2x inverse leveraged gold stocks ETF – the upside profit-take exit price: $18.47
HZD.TO – alternative (Canadian) 2x inverse leveraged silver ETF – the upside profit-take exit price: $46.87
Long-term capital (core part of the portfolio; our opinion): No positions (in other words: cash)
Insurance capital (core part of the portfolio; our opinion): Full position
Whether you’ve already subscribed or not, we encourage you to find out how to make the most of our alerts and read our replies to the most common alert-and-gold-trading-related-questions.
Please note that we describe the situation for the day that the alert is posted in the trading section. In other words, if we are writing about a speculative position, it means that it is up-to-date on the day it was posted. We are also featuring the initial target prices to decide whether keeping a position on a given day is in tune with your approach (some moves are too small for medium-term traders, and some might appear too big for day-traders).
Additionally, you might want to read why our stop-loss orders are usually relatively far from the current price.
Please note that a full position doesn't mean using all of the capital for a given trade. You will find details on our thoughts on gold portfolio structuring in the Key Insights section on our website.
As a reminder - "initial target price" means exactly that - an "initial" one. It's not a price level at which we suggest closing positions. If this becomes the case (as it did in the previous trade), we will refer to these levels as levels of exit orders (exactly as we've done previously). Stop-loss levels, however, are naturally not "initial", but something that, in our opinion, might be entered as an order.
Since it is impossible to synchronize target prices and stop-loss levels for all the ETFs and ETNs with the main markets that we provide these levels for (gold, silver and mining stocks - the GDX ETF), the stop-loss levels and target prices for other ETNs and ETF (among other: UGL, GLL, AGQ, ZSL, NUGT, DUST, JNUG, JDST) are provided as supplementary, and not as "final". This means that if a stop-loss or a target level is reached for any of the "additional instruments" (GLL for instance), but not for the "main instrument" (gold in this case), we will view positions in both gold and GLL as still open and the stop-loss for GLL would have to be moved lower. On the other hand, if gold moves to a stop-loss level but GLL doesn't, then we will view both positions (in gold and GLL) as closed. In other words, since it's not possible to be 100% certain that each related instrument moves to a given level when the underlying instrument does, we can't provide levels that would be binding. The levels that we do provide are our best estimate of the levels that will correspond to the levels in the underlying assets, but it will be the underlying assets that one will need to focus on regarding the signs pointing to closing a given position or keeping it open. We might adjust the levels in the "additional instruments" without adjusting the levels in the "main instruments", which will simply mean that we have improved our estimation of these levels, not that we changed our outlook on the markets. We are already working on a tool that would update these levels daily for the most popular ETFs, ETNs and individual mining stocks.
Our preferred ways to invest in and to trade gold along with the reasoning can be found in the how to buy gold section. Furthermore, our preferred ETFs and ETNs can be found in our Gold & Silver ETF Ranking.
As a reminder, Gold & Silver Trading Alerts are posted before or on each trading day (we usually post them before the opening bell, but we don't promise doing that each day). If there's anything urgent, we will send you an additional small alert before posting the main one.
Thank you.
Przemyslaw K. Radomski, CFA
Founder, Editor-in-chief

