

Briefly: in our opinion, full (300% of the regular position size) speculative short positions in junior mining stocks are justified from the risk/reward point of view at the moment of publishing this Alert.
Gold moved slightly higher, silver soared, but miners declined on Friday. If it’s not a screaming short-term signal, I don’t know what is.
In other words, Friday’s session served as a perfectly bearish confirmation of what we’ve been writing throughout the previous week.
Let’s take a look at what happened on the markets. The below 4-hour candlestick chart features junior gold (and silver) miners, gold, and silver, through their proxies: GDXJ, GLD, and SLV ETFs.
I’m using the ETFs for all those markets so that the opening and closing hours of each candlestick are identical and can thus be really comparable.
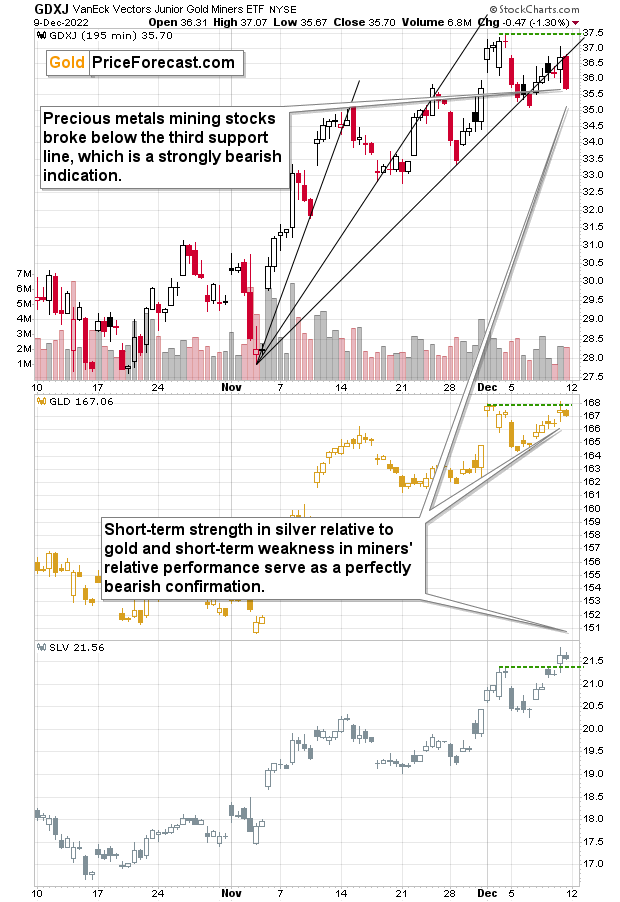
The key thing that you can see above is that the way in which those three parts of the precious metals market behaved on Friday differed considerably.
While gold was more or less neutral, silver moved much higher, while gold miners moved… Visibly lower. In particular, it was the final few hours of Friday’s session (last candlestick) that made the difference.
If used horizontally, green lines make it easier to compare the most recent performance to the early-December high. And:
- The GLD ended the previous week very close to that high.
- The SLV ended the week above that high.
- The GDXJ ended the week well below that high.
This means that silver was just particularly strong relative to gold, and miners were just particularly weak relative to gold.
Gold miners tend to be early in a given move, while silver prices tend to lag / catch-up in the final parts of the move. That’s what we’ve been able to see on the precious metals market for many years. Naturally, there were exceptions, but the above rule still holds for the majority of the time, especially when it’s both silver-gold and miners-gold links that point to the same thing.
Now, the miners-gold link suggests that a new downtrend is starting, because miners were weak relative to gold to a big extent.
The performance of the silver price, on the other hand, suggests that the rally is coming to an end, as it is clearly playing catch-up. In fact, that’s what we also see in today’s pre-market trading (chart courtesy of https://silverpriceforecast.com).
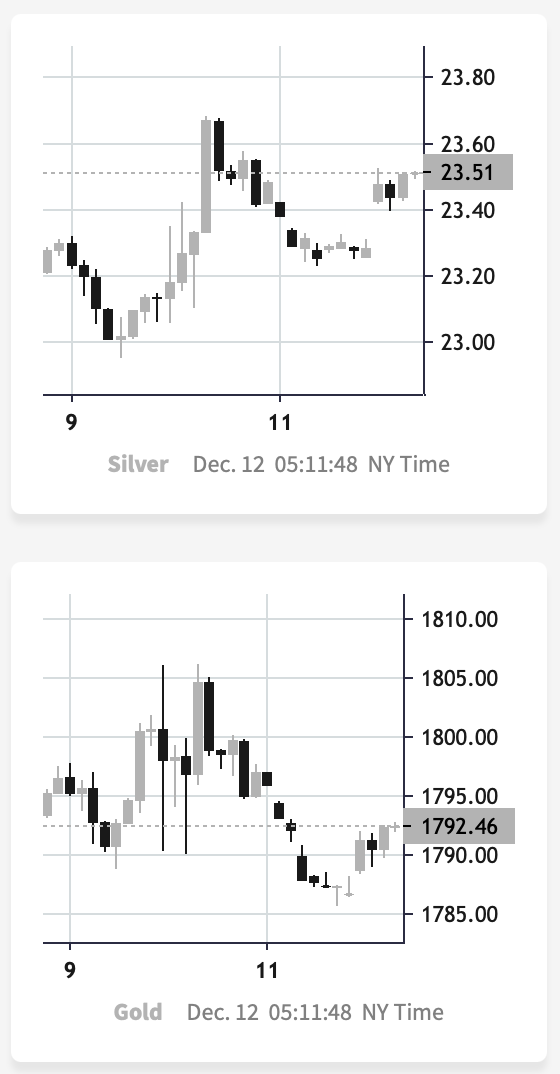
Silver corrected much more of the recent immediate-term decline than gold did, which confirms the indications from Friday’s session.
Taking the above together points to a situation in which we are seeing a top in the precious metals market.
No surprise, the precious metals sector has recently been very strongly negatively correlated with the USD Index, which appears to have formed a major bottom.
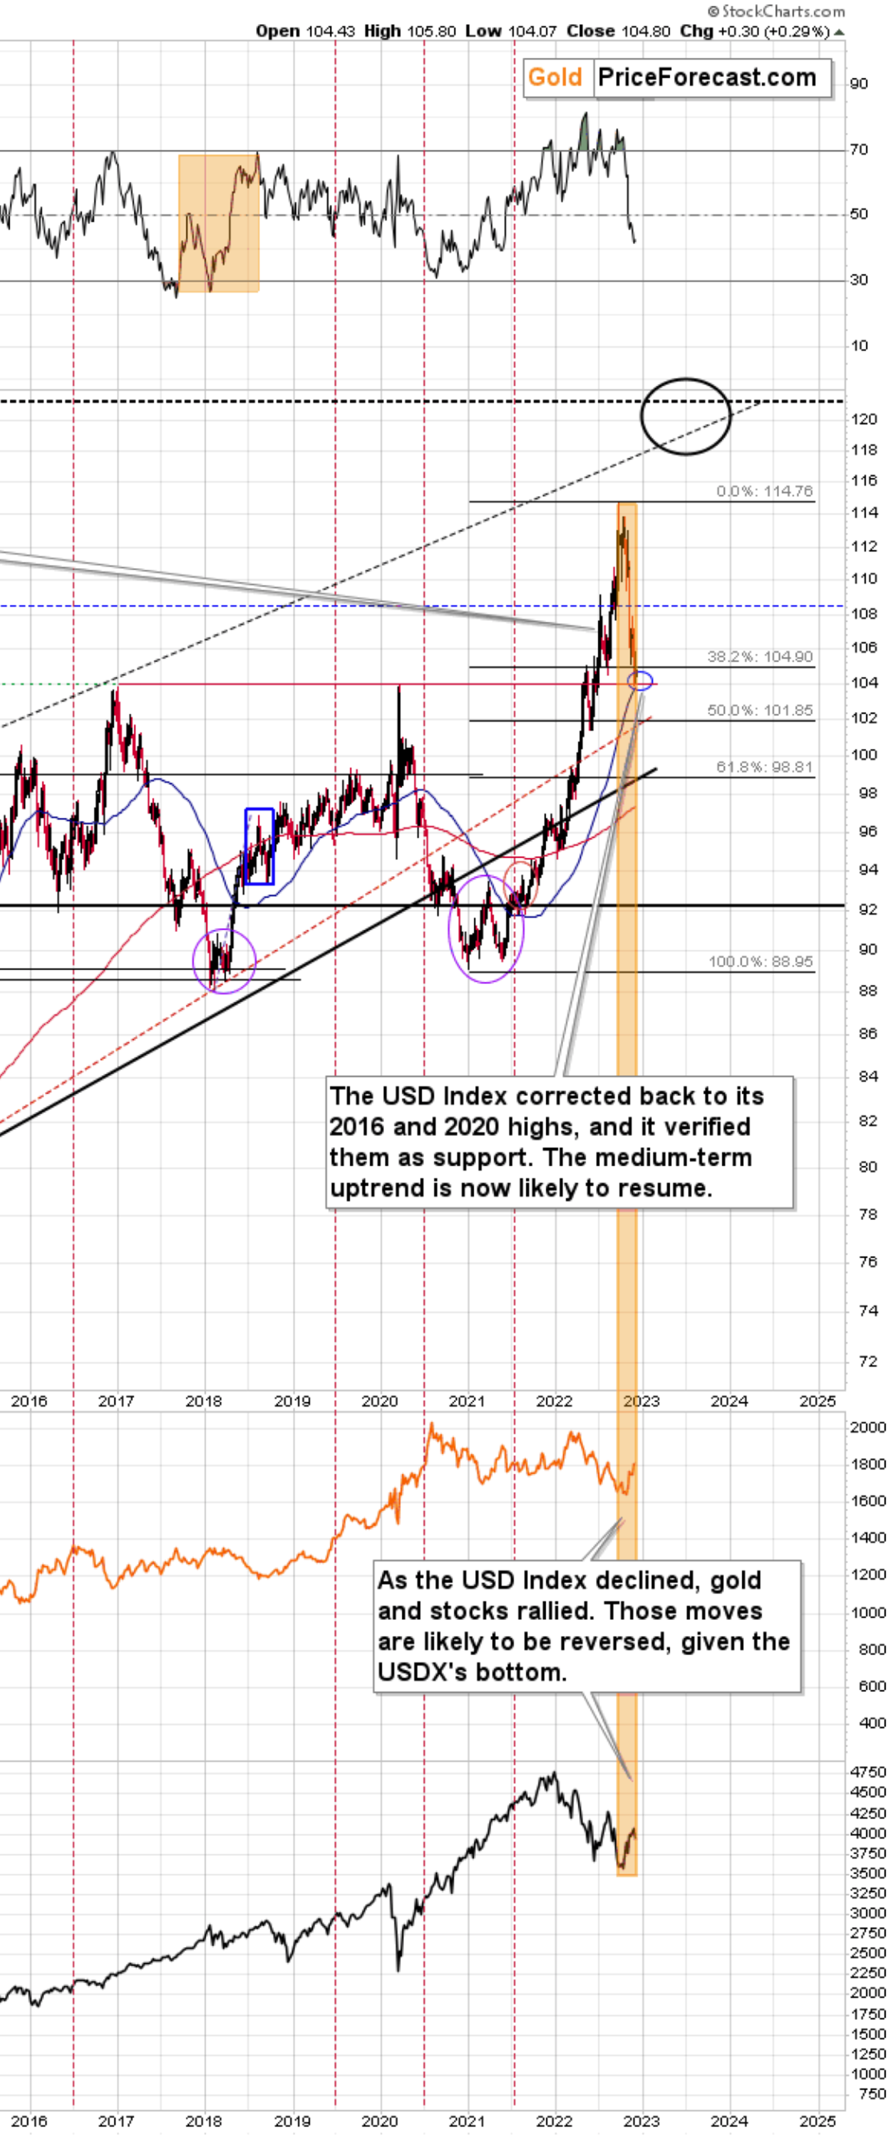
The USD Index corrected back to its 2016 and 2020 highs, and it verified them as supports. The medium-term uptrend is now likely to resume.
And since both: gold, and the stock market have been correcting along with the USD Index (in the opposite direction, of course), as the correction in the USDX is over, it seems that the corrective downswings in gold and stocks are also ending.
All in all, it seems that the next big move in the precious metals market is going to be to the downside, and that it’s about to begin. In fact, in the case of the mining stocks, it seems to be already underway.Having said that, let’s take a look at the markets from a more fundamental point of view.
A Losing Battle?
Despite investors’ attempts to create their own reality, gold’s fundamentals remain highly bearish.
With more hawkish data hitting the wire on Dec. 9, risk assets sold off into the close. Moreover, while mining stocks suffered from the bearish reversal, gold and silver continued their ascents. However, with investors highly uninformed about the resiliency of inflation, 2023 should be unkind to the PMs.
For example, the U.S. Bureau of Labor Statistics (BLS) released the Producer Price Index (PPI) on Dec. 9. For context, the metric measures the input inflation experienced by manufacturers and supply-chain companies; and with the PPI outperforming expectations, the data continues to highlight why the Fed’s inflation fight will be one of attrition.
Please see below:
 Source: Investing.com
To explain, the red box above shows that the PPI increased by 7.4% year-over-year (YoY) and 0.3% month-over-month (MoM) in November, which came in above the consensus estimates of 7.2% YoY and 0.2% MoM. As a result, the slow death of inflation highlights why the U.S. federal funds rate (FFR) needs to go much higher to bring the metric back to its pre-pandemic trend.
Likewise, while we’ve warned on numerous occasions that ZeroHedge likes to create doubt with its recurring pivot proclamations, the site continues to buy hope and sell reality.
Please see below:
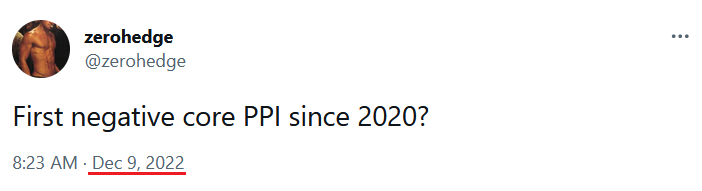 Source: Twitter
But, while narratives create controversy and increase engagement, objectively analyzing the fundamentals is much more prudent from an investment perspective.
Please seen below:
 Source: Investing.com
To explain, the core PPI came in at 0.4% MoM in November, which was double the consensus estimate of 0.2% MoM; and while ZeroHedge continues to wish its pivot narrative into fruition, the data signals the exact opposite.
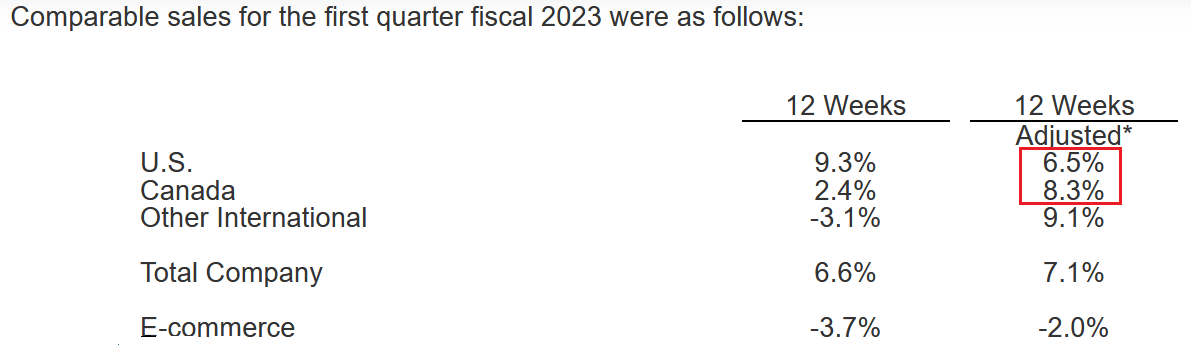
To that point, Costco released its first-quarter earnings on Dec. 8. For context, it’s the third largest retailer in the U.S. according to the National Retail Federation (NRF); and with its comparable sales remaining resilient, the results are far from recessionary, and nowhere near the levels that would support a dovish pivot.
Please see below:
 Source: Costco
To explain, Costco’s adjusted comparable sales in the U.S. and Canada came in at 6.5% and 8.3% YoY in Q1. For context, the adjusted metrics are more informative, because they exclude the impact of gasoline prices and currency fluctuations. As such, North American demand remains resilient, and the results are bullish for the FFR.
Furthermore, CFO Richard Galanti said during the Q1 conference call:
“Recall last quarter in fourth quarter, we estimated that YoY price inflation was about 8%. In the first quarter, we estimate the equivalent YoY inflation number in the range of 6% to 7%. Food and sundries is still up more than nonfoods, but overall, a little better level than a quarter ago for the company.”
Thus, while the company has seen "a little light at the end of the tunnel," Galanti noted that "it's still little" and that inflation remains highly problematic. Plus, when the Fed hikes the FFR 15 times in 2022 (25 basis point increments), and the tally should hit 17 on Dec. 14, reducing Costco's inflation from 8% to a "range of 6% to 7%." is nothing to write home about.
Consequently, realized inflation progress has been relatively minimal, and investors still underestimate the challenges that lie ahead. In a nutshell: demand destruction won't materialize on its own, and the Fed needs to push the FFR much higher to normalize inflation.
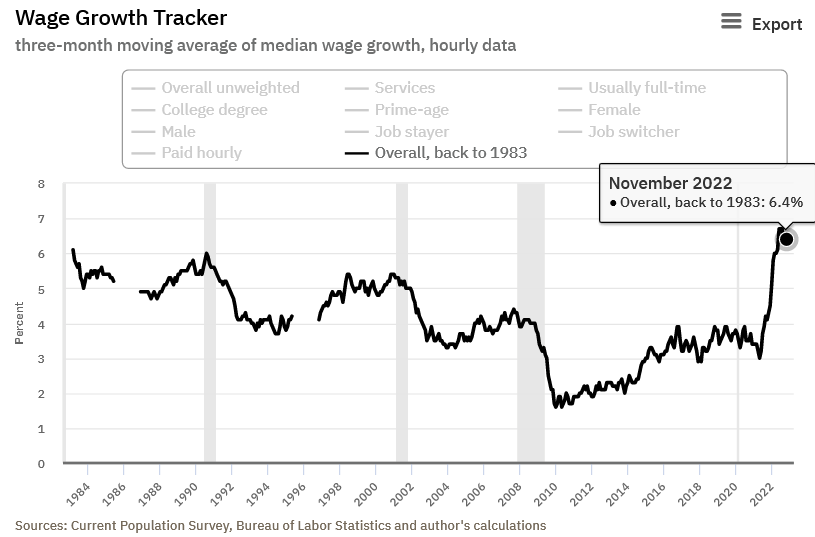
As further evidence, the Atlanta Fed updated its Wage Growth Tracker on Dec. 9; and with the consolidated metric coming in at 6.4% in November, it matched October's figure, and is only 0.3% below the all-time high of 6.7% set in June, July and August.
Please see below:
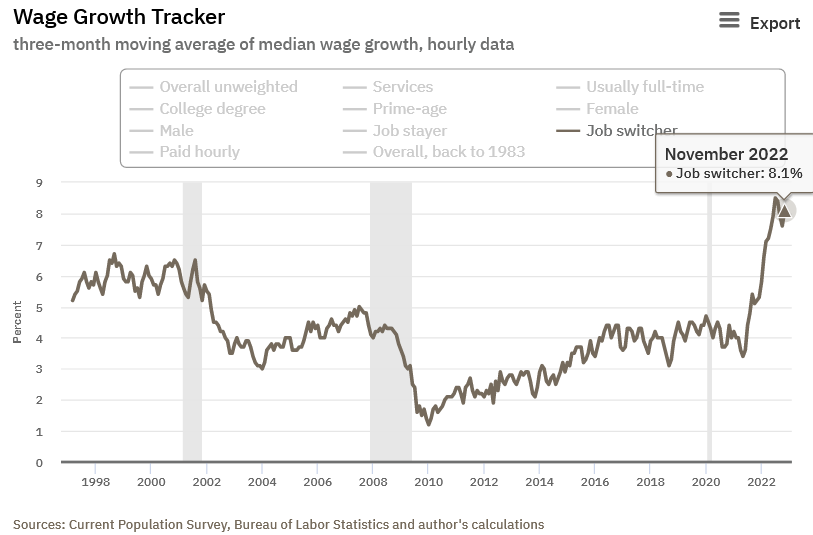
More importantly, job switchers – those who leave one job for another – saw their wage growth decline from an all-time high of 8.5% in July to a recent low of 7.6% in October. But, the metric rose again in November and now stands at 8.1%, which means investors are in la-la land if they think output inflation will fall to 2% when overall wages are running north of 6%.
Please see below:
For context, we warned on Dec. 5 that elevated compensation would prove problematic for the pivot bulls. We wrote:
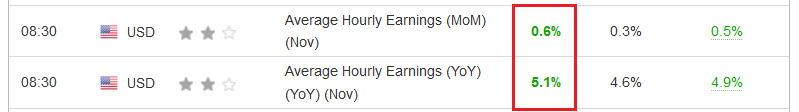
With average hourly earnings (AHE) substantially outperforming expectations on Dec. 2, the fundamentals continue to unfold as expected.
Please see below:
 Source: Investing.com
To explain, AHE increased by 0.8% MoM in November, which was more than double the consensus estimate of 0.3% MoM. Likewise, the 5.1% YoY increase also surpassed the 4.6% YoY estimate.
So, while more important data releases will commence on Dec. 12, the recent results support a more hawkish Fed than the consensus expects, not less.
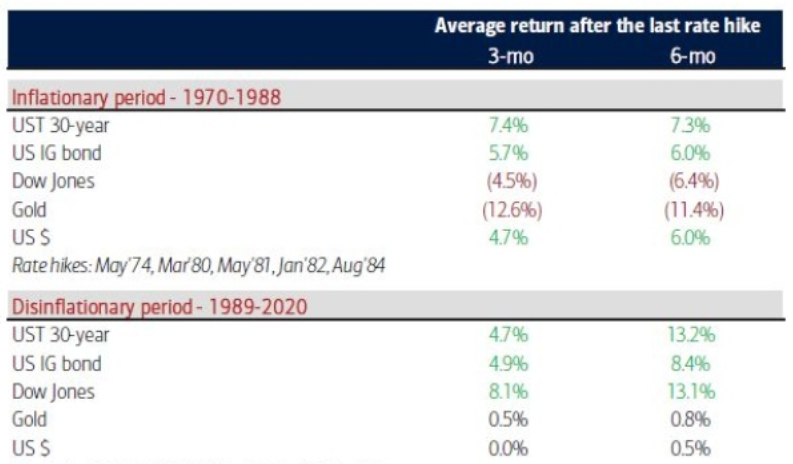
Finally, while the crowd bids up the gold price as if more QE is on the horizon, the liquidity drain (rate hikes + QT) should have plenty of room to run. Furthermore, even if the Fed pauses, history shows the development is bearish for the gold price.
Please see below:
 Source: Bank of America
To explain, Bank of America tallied the performance of various assets three and six months after the Fed’s final rate hike. If you analyze the top half of the table, you can see that the inflationary period from 1970 to 1988 (which is similar to the one we’re in now) resulted in gold declining by an average of 12.6% and 11.4% in the three and six months after the Fed’s final rate hike.
Thus, while we expect the FFR to go much higher before it’s all said and done, historical pauses amid high inflation have been unkind to the yellow metal; and while seasonality and sentiment keep the PMs uplifted in the short term, investors’ misunderstanding of the fundamentals should be their undoing in the months ahead.
Silver
While it’s been full steam ahead for silver, is an accident waiting to happen?
While several risk assets exhibit caution, silver has been off to the races. However, the white metal is known for false breakouts, and fading these moves is a staple within our gold trading tips. Therefore, while the crowd likes to buy high and sell low, the recent rally in the silver price highlights why caution is warranted.
For example, lower interest rates and a weaker USD Index have increased the PMs’ fundamental attractiveness. Yet, the moves are driven by the false belief that inflation has been curtailed and the Fed can turn dovish. So, when reality re-emerges and the pair continue their medium-term uptrends, silver’s strength could turn into immense weakness.
Please see below:
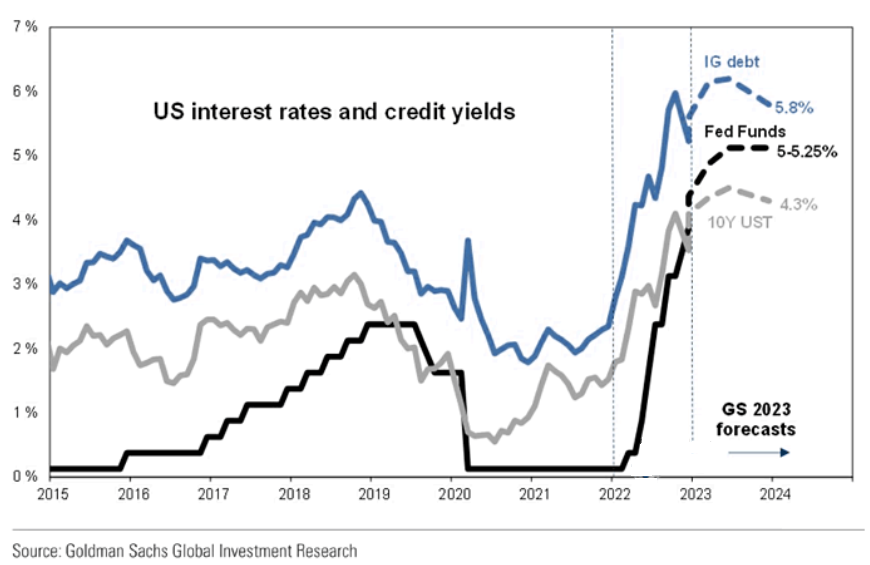
To explain, Goldman Sachs expects the FFR to peak between 5% and 5.25% (the black line above). Moreover, while the U.S. 10-Year Treasury yield (10Y) ended the Dec. 9 session at 3.57%, the investment bank expects it to rise to 4.5% in 2023 (the gray line above) before settling at 4.3%. As a result, when the pullback in interest rates reverses, silver’s gains should reverse as well.
Remember, the 10Y and the USD Index have moved in tandem for the last ~14 months; and since higher interest rates are bullish for the greenback, inflationary realities should push both metrics higher in the months ahead.
Please see below:
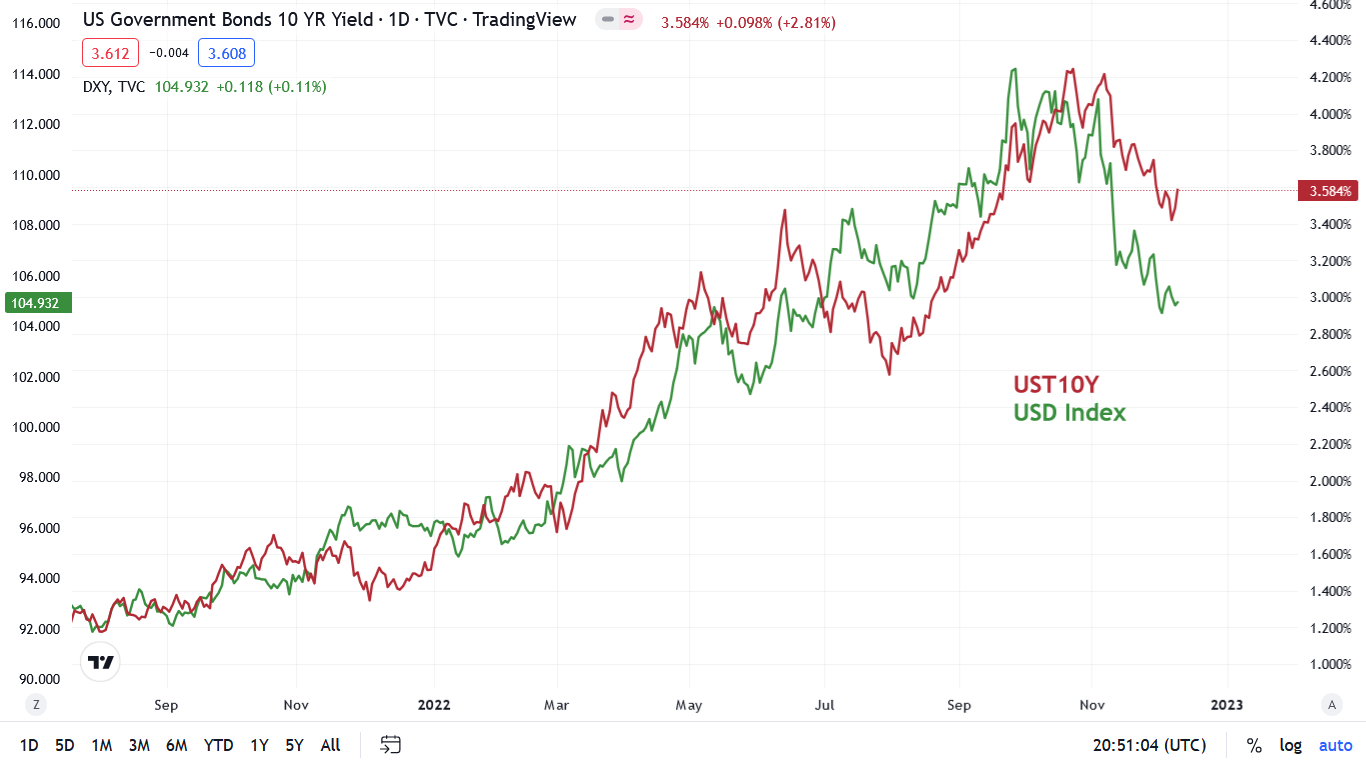
To explain, the red line above tracks the 10Y, while the green line above tracks the USD Index. If you analyze the relationship, you can see that the two have largely followed in each other’s footsteps; and while their pullbacks on the right side of the chart have been bullish for the PMs, we view them as countertrend declines within medium-term uptrends. As such, we expect new highs to materialize in 2023.
Likewise, the technicals are just as ominous, and silver’s outperformance of gold is an important sell signal because it often soars and breaks above its previous highs (or other important resistance lines) only to fool those who are new to this market; and then it slides. Thus, the sharpest rallies often occur right before a collapse.
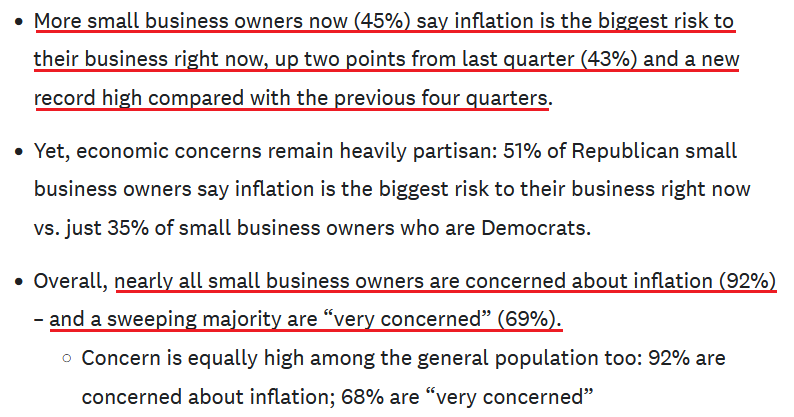
Furthermore, CNBC released its Q4 Small Business Index on Dec. 9. The article stated:
“More players in the stock market and among the ranks of professional economists have come around to the view that inflation has peaked or already is in decline, but small business owners on Main Street don’t expect a reprieve from high prices anytime soon.
“An overwhelming majority (78%) of America’s entrepreneurs say they expect inflation to continue to rise, according to the quarterly CNBC|SurveyMonkey Small Business Survey. That is effectively unchanged from last quarter when 77% said they expected inflation to continue to rise.”
So, while the narrative proclaims that inflation is old news and a dovish pivot can commence, the businesses operating on the ground paint a significantly different portrait.
Please see below:
 Source: CNBC
Consequently, while investors often extrapolate short-term trends into perpetuity, we’ve warned repeatedly that the Fed’s inflation fight will be one of attrition, and market participants underestimate the peak FFR and the need for tighter financial conditions.
In addition, debtors borrow money over the long term, so if the 10Y, 20Y, 30Y, etc. don’t rise, it will be difficult for the Fed to reduce demand for capital and cool inflation. Thus, the fundamentals are bullish for the FFR, real yields and the USD Index, and bearish for silver.
Also noteworthy, the University of Michigan released its Consumer Sentiment Index on Dec. 9; and with Americans increasingly bullish on their earnings prospects, it’s another indicator of why demand destruction still awaits us.
Please see below:
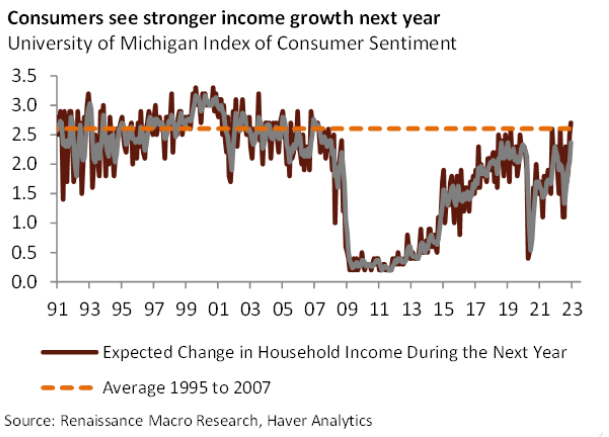
To explain, the brown line above tracks respondents’ expected change in household income over the next 12 months. If you analyze the right side of the chart, you can see that the metric has risen for three straight months and is now at its highest level since 2007.
As a result, with wage inflation reaccelerating and Americans increasingly optimistic about their income outlook, the pivot predictors are pumping a narrative that contrasts the hard data; and with prior iterations ending badly for the believers, this one should be no different.
Overall, while seasonality and momentum have silver riding high, the fundamentals are profoundly bearish. Wages are rising, financial conditions have loosened materially and outside of lowering commodity prices, the Fed has made little progress in its inflation fight. Therefore, when sentiment shifts, it could be a long way down before the silver price finds a floor.
The Bottom Line
Investors' hopes for demand destruction continue to backfire, as the economic data outperforms expectations. Moreover, we warned on numerous occasions that resilient inflation would rattle the Fed and upend liquidity-fueled assets, given the stimulus backdrop that unfolded in 2020.
Furthermore, while bear market rallies are always unpleasant, asset prices don't move in a straight line. So, countertrend shifts are expected along the path to medium-term lows, and the PMs have largely followed the script. As such, while seasonality remains bullish, the fundamentals are highly bearish, and investors' belief in a dovish pivot continues to dwindle; and with sentiment also showing signs of slippage, gold, silver and mining stocks' medium-term downtrends should resume sooner rather than later.
In conclusion, the PMs were mixed on Dec. 9, as mining stocks followed the S&P 500 lower. In addition, the USD Index was flat, while the U.S. 10-Year real yield increased. However, we believe the pair's best days lie ahead, and a realization is profoundly bearish for the PMs.
Overview of the Upcoming Part of the Decline
- It seems to me that the corrective upswing is over (or about to be over) and that the next big move lower is already underway (or that it’s about to start).
- If we see a situation where miners slide in a meaningful and volatile way while silver doesn’t (it just declines moderately), I plan to – once again – switch from short positions in miners to short positions in silver. At this time, it’s too early to say at what price levels this could take place and if we get this kind of opportunity at all – perhaps with gold prices close to $1,500 - $1,550.
- I plan to switch from the short positions in junior mining stocks or silver (whichever I’ll have at that moment) to long positions in junior mining stocks when gold / mining stocks move to their 2020 lows (approximately). While I’m probably not going to write about it at this stage yet, this is when some investors might consider getting back in with their long-term investing capital (or perhaps 1/3 or 1/2 thereof).
- I plan to return to short positions in junior mining stocks after a rebound – and the rebound could take gold from about $1,450 to about $1,550, and it could take the GDXJ from about $20 to about $24. In other words, I’m currently planning to go long when GDXJ is close to $20 (which might take place when gold is close to $1,450), and I’m planning to exit this long position and re-enter the short position once we see a corrective rally to $24 in the GDXJ (which might take place when gold is close to $1,550).
- I plan to exit all remaining short positions once gold shows substantial strength relative to the USD Index while the latter is still rallying. This may be the case with gold prices close to $1,400 and GDXJ close to $15 . This moment (when gold performs very strongly against the rallying USD and miners are strong relative to gold after its substantial decline) is likely to be the best entry point for long-term investments, in my view. This can also happen with gold close to $1,400, but at the moment it’s too early to say with certainty.
- The above is based on the information available today, and it might change in the following days/weeks.
You will find my general overview of the outlook for gold on the chart below:
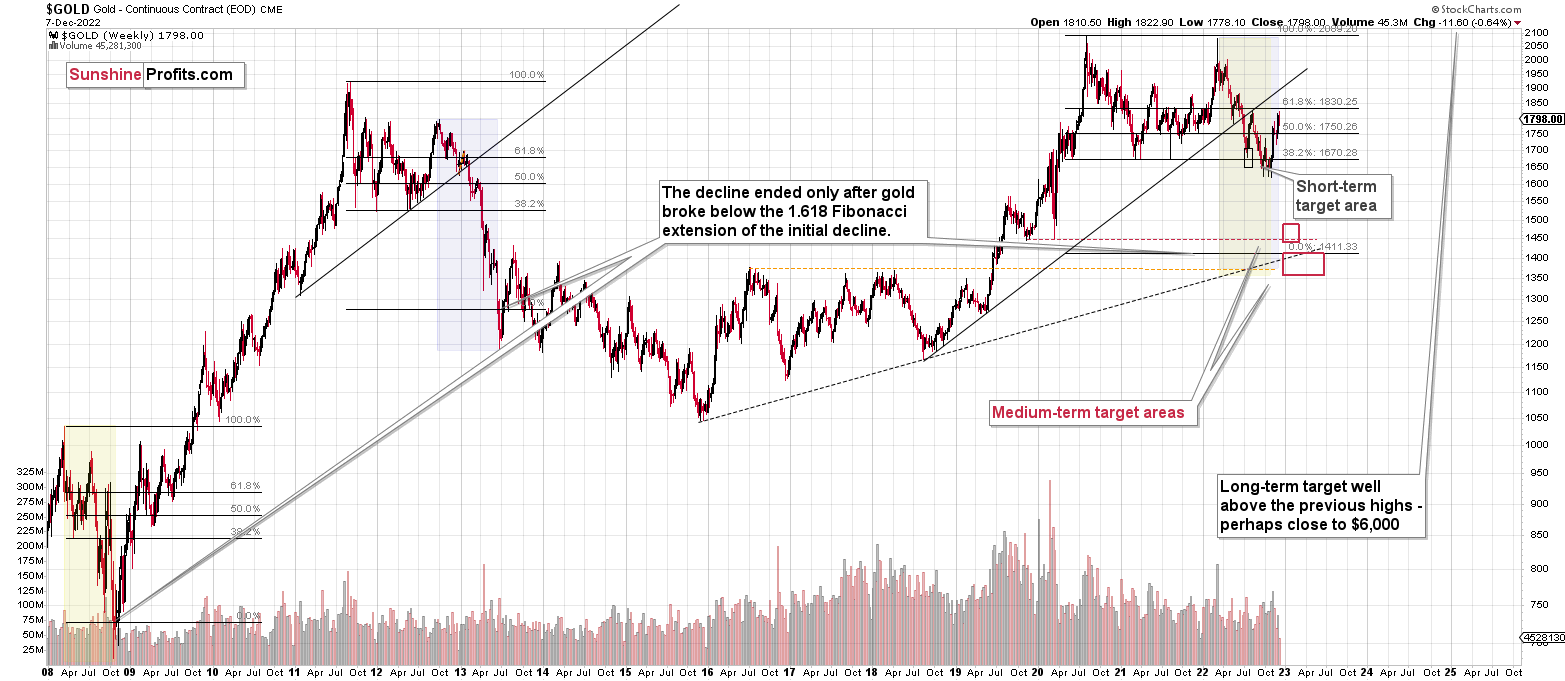
Please note that the above timing details are relatively broad and “for general overview only” – so that you know more or less what I think and how volatile I think the moves are likely to be – on an approximate basis. These time targets are not binding nor clear enough for me to think that they should be used for purchasing options, warrants, or similar instruments.
Letters to the Editor
There are no new letters for today, but I wanted to keep the below reminder in place, just to make sure that everyone had the chance to see it:
Please note that this section is going to go away within the next 1-8 weeks, as you can add comments/questions below the article on Golden Meadow – the platform that we’re using to provide our analyses. Your notification e-mails include an invitation link that allows you to access the “Gold Trading Alerts” space.
The first premium analysis had over 30 comments below it, and once I finish writing this article, I’ll head over to the comments section and catch up on yesterday’s comments.
Also, if you haven’t had the chance to see the video, in which I’m talking about the new platform and why we essentially moved from Sunshine Profits to Golden Meadow, I strongly encourage you to do so:
Summary
Summing up, it seems that the major bottom in the USD Index is in, while the correction in stocks, gold, silver, and mining stocks is over.
The nature of the recent corrections was mostly technical. No market moves up or down in a straight line, and seeing market corrections is rather normal. The excuse that markets used to correct this time was an incorrect (in my view) expectation that the Fed is going to make a dovish U-turn. The fact that even the positive employment numbers were ignored as a bearish indication of further rate hikes shows the extent of the recent/current irrationality.
However, as the irrationality ends, the medium-term trend is likely to be resumed. And this trend is down in case of the junior mining stocks. The latter are likely to decline profoundly based on declines in both: gold and the stock market.
In my opinion, the current trading position is going to become profitable in the following weeks, and quite possibly in the following days. And while I can’t promise any kind of performance, I fully expect it to become very profitable before it’s over and to prolong our 2022 winning streak.
After the final sell-off (that takes gold to about $1,350-$1,500), I expect the precious metals to rally significantly. The final part of the decline might take as little as 1-5 weeks, so it's important to stay alert to any changes.
As always, we'll keep you – our subscribers – informed.
To summarize:
Trading capital (supplementary part of the portfolio; our opinion): Full speculative short positions (300% of the full position) in junior mining stocks are justified from the risk to reward point of view with the following binding exit profit-take price levels:
Mining stocks (price levels for the GDXJ ETF): binding profit-take exit price: $20.32; stop-loss: none (the volatility is too big to justify a stop-loss order in case of this particular trade)
Alternatively, if one seeks leverage, we’re providing the binding profit-take levels for the JDST (2x leveraged). The binding profit-take level for the JDST: $27.87; stop-loss for the JDST: none (the volatility is too big to justify a SL order in case of this particular trade).
For-your-information targets (our opinion; we continue to think that mining stocks are the preferred way of taking advantage of the upcoming price move, but if for whatever reason one wants / has to use silver or gold for this trade, we are providing the details anyway.):
Silver futures downside profit-take exit price: $12.32
SLV profit-take exit price: $11.32
ZSL profit-take exit price: $74.87
Gold futures downside profit-take exit price: $1,504
HGD.TO – alternative (Canadian) 2x inverse leveraged gold stocks ETF – the upside profit-take exit price: $18.47
HZD.TO – alternative (Canadian) 2x inverse leveraged silver ETF – the upside profit-take exit price: $46.87
Long-term capital (core part of the portfolio; our opinion): No positions (in other words: cash)
Insurance capital (core part of the portfolio; our opinion): Full position
Whether you’ve already subscribed or not, we encourage you to find out how to make the most of our alerts and read our replies to the most common alert-and-gold-trading-related-questions.
Please note that we describe the situation for the day that the alert is posted in the trading section. In other words, if we are writing about a speculative position, it means that it is up-to-date on the day it was posted. We are also featuring the initial target prices to decide whether keeping a position on a given day is in tune with your approach (some moves are too small for medium-term traders, and some might appear too big for day-traders).
Additionally, you might want to read why our stop-loss orders are usually relatively far from the current price.
Please note that a full position doesn't mean using all of the capital for a given trade. You will find details on our thoughts on gold portfolio structuring in the Key Insights section on our website.
As a reminder - "initial target price" means exactly that - an "initial" one. It's not a price level at which we suggest closing positions. If this becomes the case (as it did in the previous trade), we will refer to these levels as levels of exit orders (exactly as we've done previously). Stop-loss levels, however, are naturally not "initial", but something that, in our opinion, might be entered as an order.
Since it is impossible to synchronize target prices and stop-loss levels for all the ETFs and ETNs with the main markets that we provide these levels for (gold, silver and mining stocks - the GDX ETF), the stop-loss levels and target prices for other ETNs and ETF (among other: UGL, GLL, AGQ, ZSL, NUGT, DUST, JNUG, JDST) are provided as supplementary, and not as "final". This means that if a stop-loss or a target level is reached for any of the "additional instruments" (GLL for instance), but not for the "main instrument" (gold in this case), we will view positions in both gold and GLL as still open and the stop-loss for GLL would have to be moved lower. On the other hand, if gold moves to a stop-loss level but GLL doesn't, then we will view both positions (in gold and GLL) as closed. In other words, since it's not possible to be 100% certain that each related instrument moves to a given level when the underlying instrument does, we can't provide levels that would be binding. The levels that we do provide are our best estimate of the levels that will correspond to the levels in the underlying assets, but it will be the underlying assets that one will need to focus on regarding the signs pointing to closing a given position or keeping it open. We might adjust the levels in the "additional instruments" without adjusting the levels in the "main instruments", which will simply mean that we have improved our estimation of these levels, not that we changed our outlook on the markets. We are already working on a tool that would update these levels daily for the most popular ETFs, ETNs and individual mining stocks.
Our preferred ways to invest in and to trade gold along with the reasoning can be found in the how to buy gold section. Furthermore, our preferred ETFs and ETNs can be found in our Gold & Silver ETF Ranking.
As a reminder, Gold & Silver Trading Alerts are posted before or on each trading day (we usually post them before the opening bell, but we don't promise doing that each day). If there's anything urgent, we will send you an additional small alert before posting the main one.
Thank you.
Przemyslaw K. Radomski, CFA
Founder, Editor-in-chief

