

Briefly: in our opinion, full (300% of the regular position size) speculative short positions in junior mining stocks are justified from the risk/reward point of view at the moment of publishing this Alert.
Once again, practically everything that I wrote in Monday’s analysis, Tuesday’s analysis, and yesterday's analysis remains up-to-date.
In yesterday’s analysis, I wrote the following about the stock market:
Speaking of the general stock market, it moved slightly higher yesterday (in terms of closing prices), but the move was not significant enough to invalidate the breakdown below the neck level of the head-and-shoulders formation. Therefore, the breakdown is now almost confirmed, and the situation is already more bearish than it was yesterday.
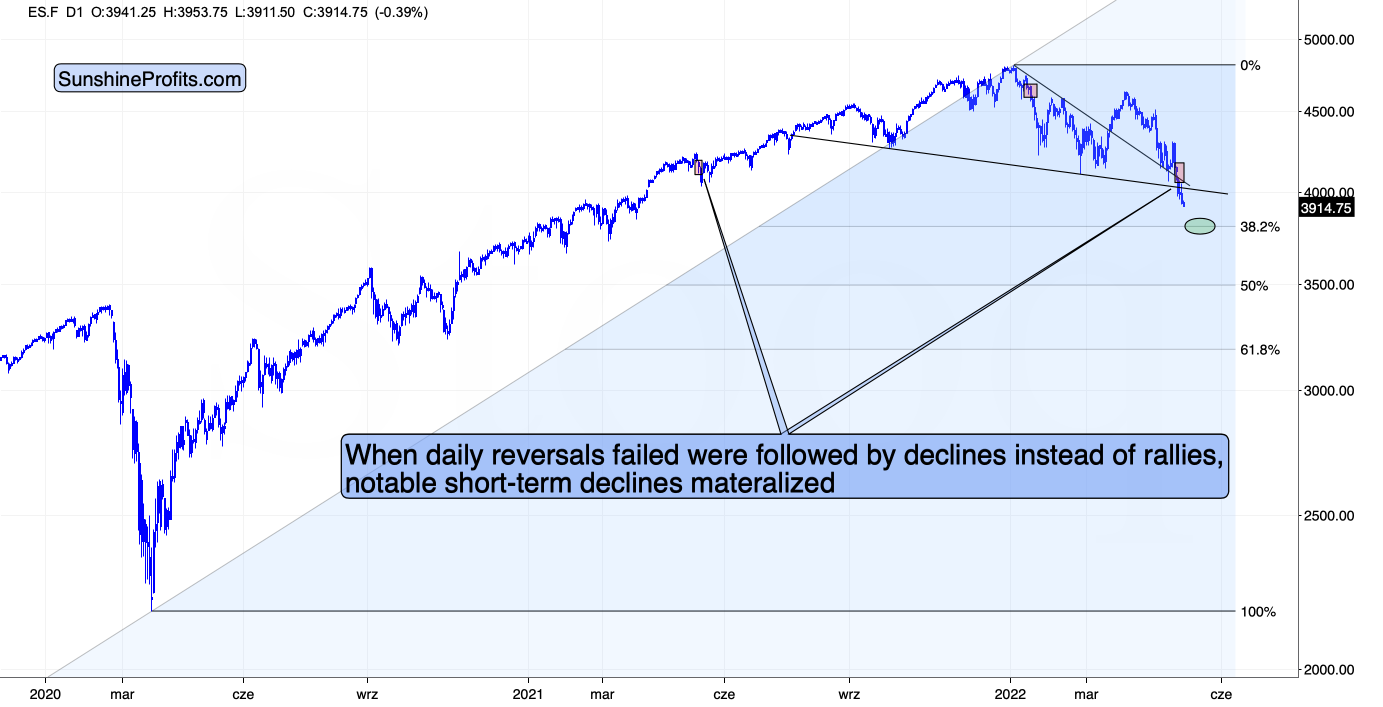
At the moment of writing these words, stocks are once again trying to rally, but so far the rally is not as big as yesterday’s pre-market rally that was just erased. Thus, I doubt that stocks will be able to avoid falling in the near term.
The S&P 500 is currently confirming a breakdown below its head and shoulders pattern. Once confirmed (just one more close below the neck level is required), the formation will be complete, and the next target will be below 3,500. So, yes, I expect the S&P 500 to decline below its 2021 lows in the near future.
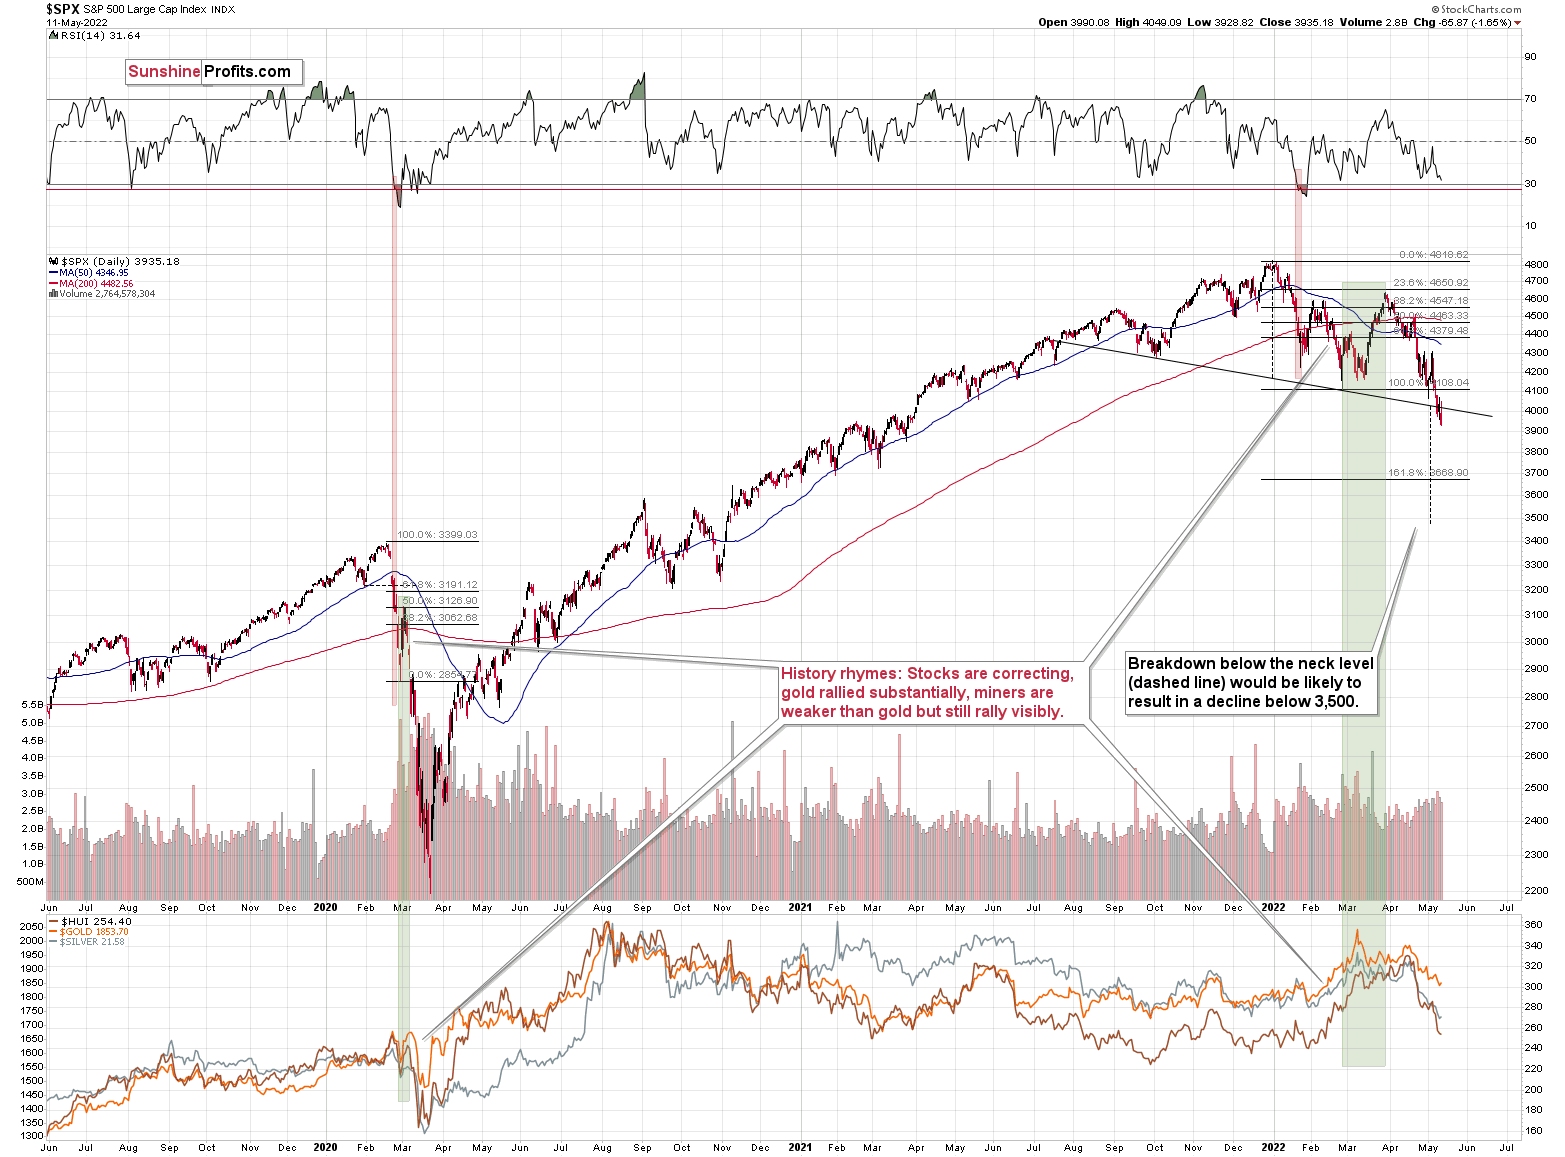
Despite yesterday’s attempt to move higher, stocks closed the day below the neck level of the head and shoulders pattern for the third consecutive day. The bearish H&S pattern was confirmed, just as I expected.
The implications are bearish, and while the target based on this formation is slightly below 3,500, it wouldn’t surprise me to see a rebound from about 3,800 – that’s where the 38.2% Fibonacci retracement is located. I previously wrote about it in the following way:
Is there any nearby support level that would be strong enough to stop this short-term decline? Yes: it’s the 38.2% Fibonacci retracement level based on the 2020-2022 rally.
Back in 2020, the very first decline erased 50% of the preceding rally, but back then the market was much more volatile than it is right now, so it’s understandable.
If we see a decline to the 38.2% Fibonacci retracement and then a comeback to the previously broken neck level of the head and shoulders pattern, it would fit practically everything that I wrote above and in the previous days / weeks.
It would trigger another immediate-term decline in silver and mining stocks in the near term, wchich would be followed by a (quite likely tradable) rebound.
So, it seems that the general stock market is quite close to its near-term target area but not yet at it – another move lower appears likely.
Having said that, let’s take a look at the other (usually main) determinant of the driver of junior mining stock prices – gold.
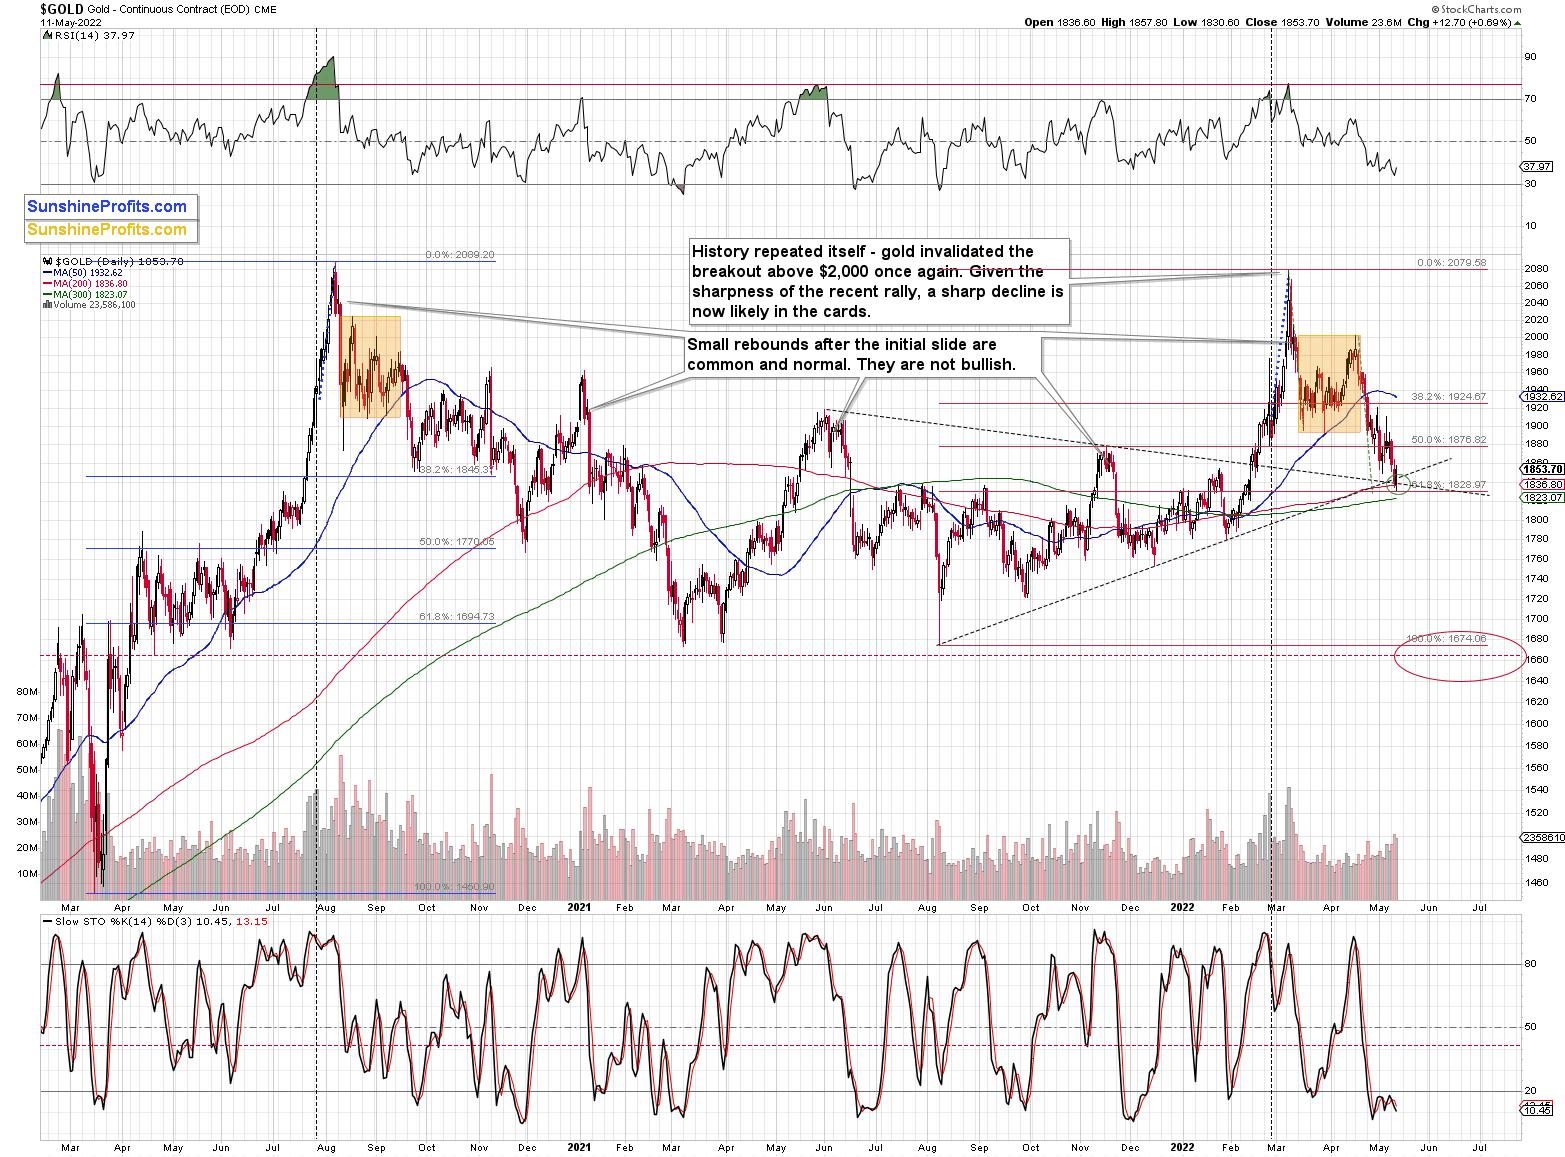
In yesterday’s analysis, I commented on the gold chart in the following way:
As gold moved right to the middle of my target area, it seems that it might not want to move much lower before correcting. However, it’s still possible that the bottom would form over several days, and if the stock market declines during that time, junior miners could decline despite the lack of declines in gold.
If the above is the case, then once the stock market moves back up, juniors will likely soar back with vengeance, like a coiled spring that’s finally able to expand. For now, it seems that the general stock market will take juniors lower (in the very near term, that is).
Please take one more look at the part that I put in bold. The stock market declined yesterday, while gold moved higher. What did the mining stocks do? The GDX ETF was slightly lower and the GDXJ ETF was slightly higher, but overall they didn’t do anything despite the intraday attempt to rally.
The above is in perfect tune with the current situation in gold and stocks. As gold rallied yesterday, and it moved a bit lower once again in today’s pre-market trading (~$7 at the moment of writing these words), it’s likely forming a broader bottom here. Since stocks (S&P 500 futures) are trading lower (they are down by 0.5%) in today’s pre-market trading, it seems that junior miners are about to get another bearish push.
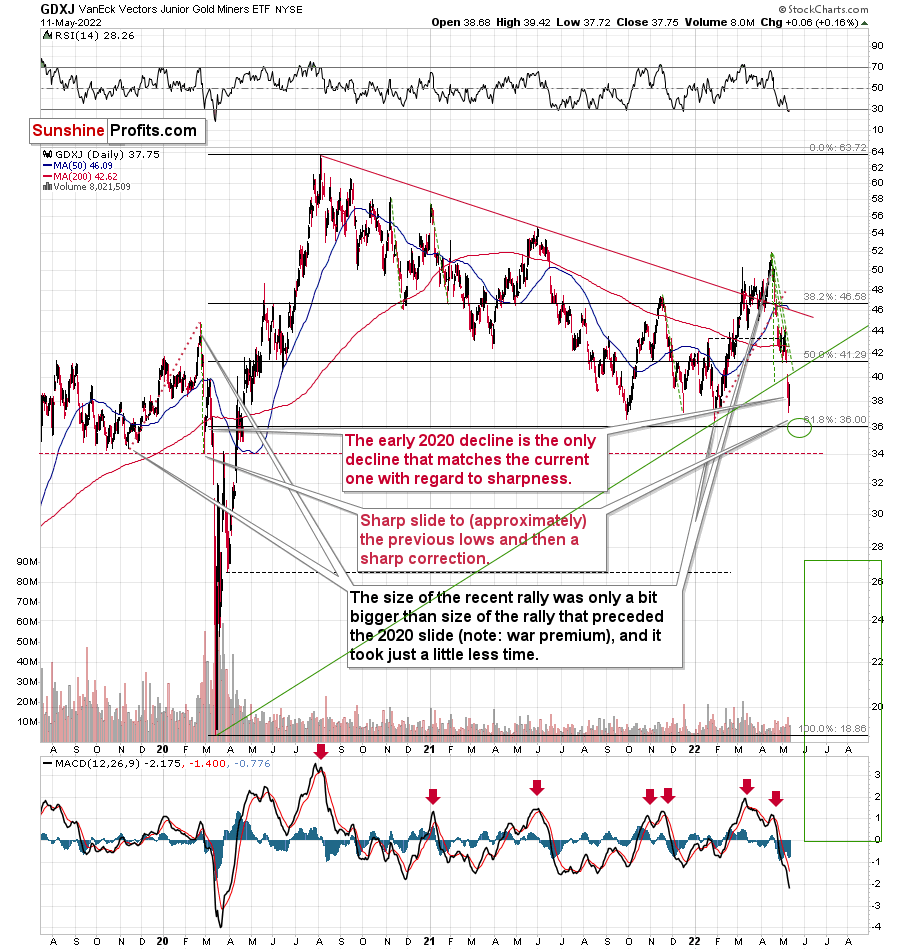
As stocks are likely to move a bit lower before correcting, so are junior miners. This means that practically everything that I wrote about their performance and outlook remains up-to-date – the market simply agreed:
In short, just like in the case of silver, I decided to move our exit prices lower – a bit below the previous lows.
Why? Because that’s where there’s the next really strong support – provided by the 61.8% Fibonacci retracement and because it seems that the general stock market will decline a bit more before correcting.
I mean, I expected juniors to decline along with the general stock market, but the huge size of juniors’ decline was more than I had expected to happen during just one session compared to what happened in the S&P 500.
If stocks have more to fall (much more than just a repeat of yesterday’s decline) and gold could repeat its yesterday’s decline, it seems that junior miners could more than repeat their slide. Since they fell by over $3 yesterday, juniors can now decline by at least another $3. This would bring them below their previous lows and below the previous target of about $37.
In fact, given the strength of the momentum, I wouldn’t even rule out the scenario in which miners slide to ~$34. Then again, let’s not forget that miners tend to show some kind of strength before rallying, so the pace of their decline would be likely to diminish before the turnaround. Therefore, expecting the sharpness of the decline to continue all the way down is not realistic. Consequently, ~$36 seems more realistic as a short-term downside target than $34 is.
Besides, the GDXJ’s 4-hour chart also suggests a move to this area.
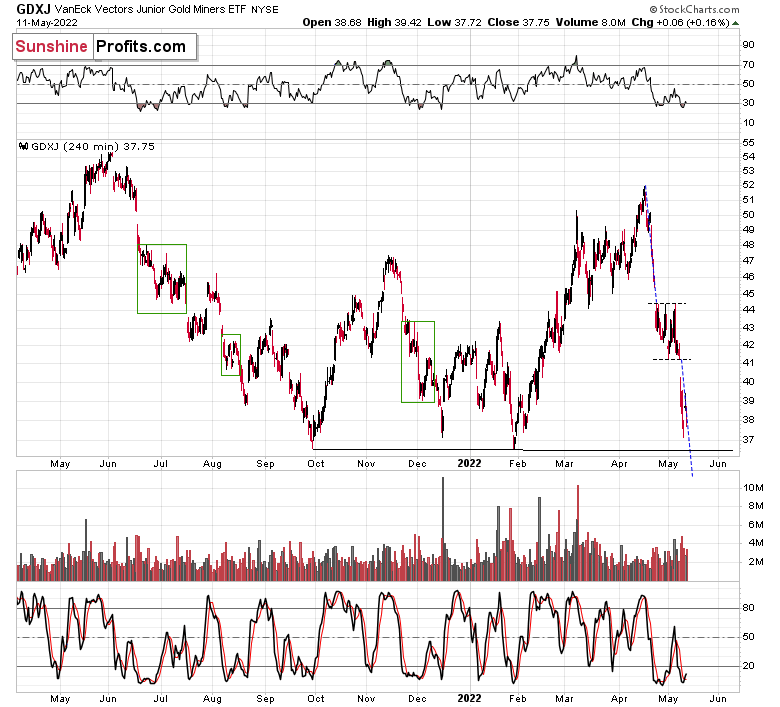
Consolidations tend to be followed by price moves that are similar to the moves that preceded them. Applying this to the letter provides us with a target that’s slightly below $36.
To summarize the technical part of today’s analysis, it seems that junior miners will move to their short-term target soon, which will enable us to exit the current short positions in them and (if one wants to do so, that is) to enter temporary long positions to benefit from the likely rebound.
As soon as the target levels are reached in the case of the GDXJ, I think that exiting short and entering long positions will be justified from the risk to reward point of view (regardless of whether you get a confirmation from me). Please note that the move to ~$36 could be sharp, and it could be reversed on an intraday basis.
Having said that, let’s take a look at the markets from a fundamental point of view.
Maybe Next Month
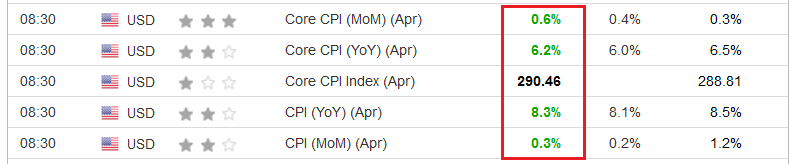
While I've been warning for some time that inflationary pressures are abundant, investors are desperately waiting for inflation's peak so that the Fed can turn dovish. However, while the headline Consumer Price Index (CPI) technically 'peaked' on a year-over-year (YoY) basis on May 11, the data still came in hotter than expected. For context, the gray figures in the second column below were economists' consensus estimates.
As a result, what I wrote on May 11 should prove prescient: even if the CPI peaks YoY, the battle is far from over, and the Fed will have to fire plenty of hawkish bullets to win this war.
Please see below:
 Source: Investing.com
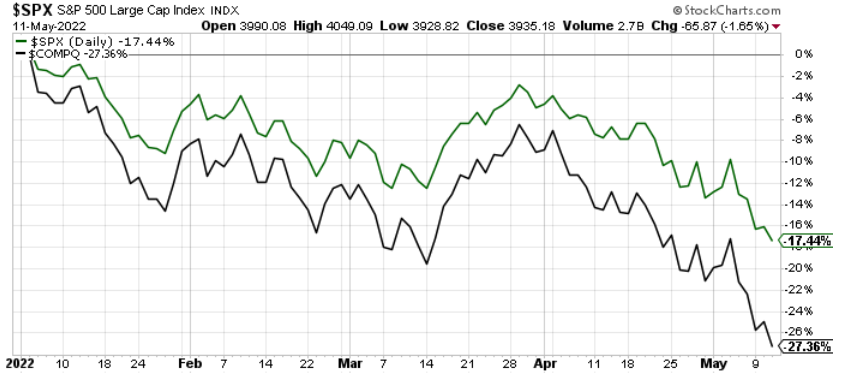
To that point, with the S&P 500 and the NASDAQ Composite selling off again on May 11, the bulls are searching for a medium-term bottom that inflation simply won’t underwrite. As such, with the pricing pressures preventing the Fed from running to the rescue, investors’ anxiety has intensified as they navigate the uncertainties alone. Therefore, the nightmare on Wall Street has grown extremely insidious.
Please see below:
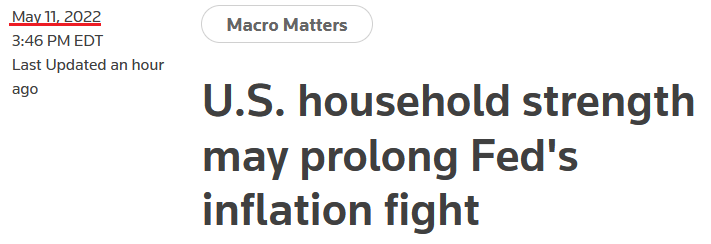
Furthermore, the consensus has finally come around to the realities that I’ve been warning about for months. To explain, a Reuters article stated on May 11:
“The financial strength built up in U.S. households limited the damage from the coronavirus pandemic but may now be aggravating – and prolonging – the Federal Reserve's inflation fight as the central bank waits for people to run out of spending power.”
Please see below:
 Source: Reuters
However, I warned about this more than four months ago. I wrote on Dec. 23:
While the fiscal spending spree may end, U.S. households are still flush with cash.
Please see below:
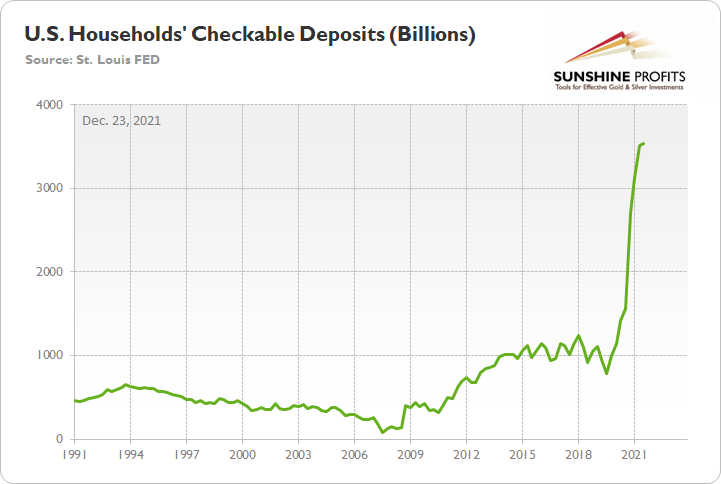
To explain, the green line above tracks U.S. households’ checkable deposits (data released on Dec. 9). In a nutshell: it’s the amount of money that U.S. households have in their checking accounts and/or demand deposit accounts.
If you analyze the vertical ascent on the right side of the chart, you can see that U.S. households have nearly $3.54 trillion in their checking accounts. For context, this is 253% more than Q4 2019 (pre-COVID-19).
The bottom line? While some investors expect a dovish 180 from the Fed, they shouldn’t hold their breath. With U.S. economic growth still resilient and the U.S. consumer in much better shape than some portray, the Fed can raise interest rates without crashing the U.S. economy. As a result, Powell will likely stick to his hawkish script and forge ahead with rate hikes in 2022.
Furthermore, I wrote on Mar. 31:
There is a misnomer in the financial markets that inflation is a supply-side phenomenon. In a nutshell: COVID-19 restrictions, labor shortages, and manufacturing disruptions are the reasons for inflation’s reign. As such, when these issues are no longer present, inflation will normalize and the U.S. economy will enjoy a “soft landing.” However, investors’ faith in the narrative will likely lead to plenty of pain over the medium term.
As a result, investors’ misunderstanding of the drivers of inflation led to short-sighted compliancy. However, now, the realities of sticky inflation are more obvious, and the longer the pricing pressures persist, the longer investors have to wait for the Fed to bail them out. Thus, the extended time horizon has helped create a crisis of confidence.
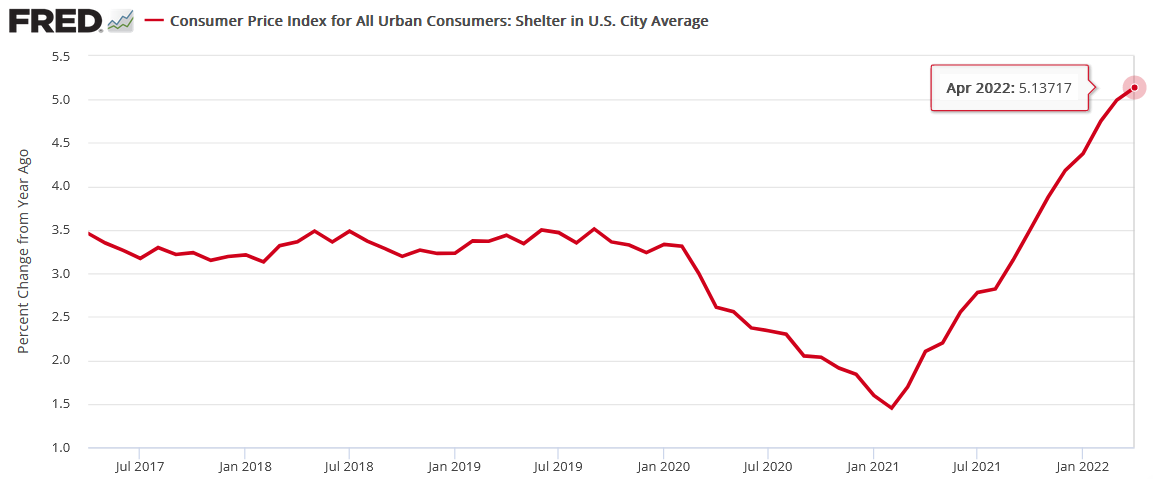
To that point, while I’ve been warning for months that the shelter CPI – which accounts for more than 30% of the headline CPI’s movement – was materially depressed relative to the realities on the ground, the metric hit a new 2022 YoY high on May 11.
Please see below:
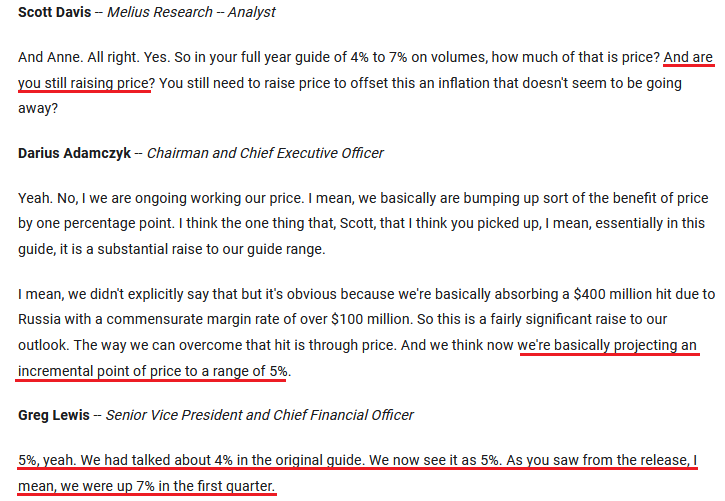
Likewise, the inflation outlook remains problematic over the next several months. Case in point: Honeywell released its first-quarter earnings on Apr. 29. For context, the company creates products for industries like aerospace, building technologies, and performance materials. CFO Greg Lewis said during the Q1 earnings call:
“We expect that our disciplined price actions will keep us ahead of the current inflationary environment, contributing approximately 5% to our sales growth, which is higher than we anticipated in our original guide, and offsetting the majority of the approximately $400 million of lost Russia sales.”
As a result, major U.S. corporations are still prepping price increases for the coming months.
Please see below:
 Source: Honeywell/The Motley Fool
Likewise, Newell Brands released its first-quarter earnings on Apr. 29. For context, the company manufactures personal and commercial home products like trash cans, slow cookers, and pens. CEO Ravi Saligram said during the Q1 earnings call:
“Core sales grew 6.9% against a difficult 20.9% comparison (…). In Q1, our core sales growth was driven by pricing as volume was relatively flat.”
In addition:
“Inflation remains stubbornly high, and our expectation for the full year has moved up slightly since February. The war in Ukraine took up energy prices, which, in turn, resulted in higher than initially anticipated costs for resin and transportation.”
“We now expect inflation to account for about 9% of cost of goods sold in 2022 similar to last year and about 1% above our previous forecast. We continue to anticipate that ocean freight, source finished goods and wages will see the largest year-over-year increases.”
Therefore:
“The contribution from pricing has continued to build sequentially with additional actions expected to be implemented in Q2. For the full year, we still expect pricing and productivity to more than offset the impact of inflation.”
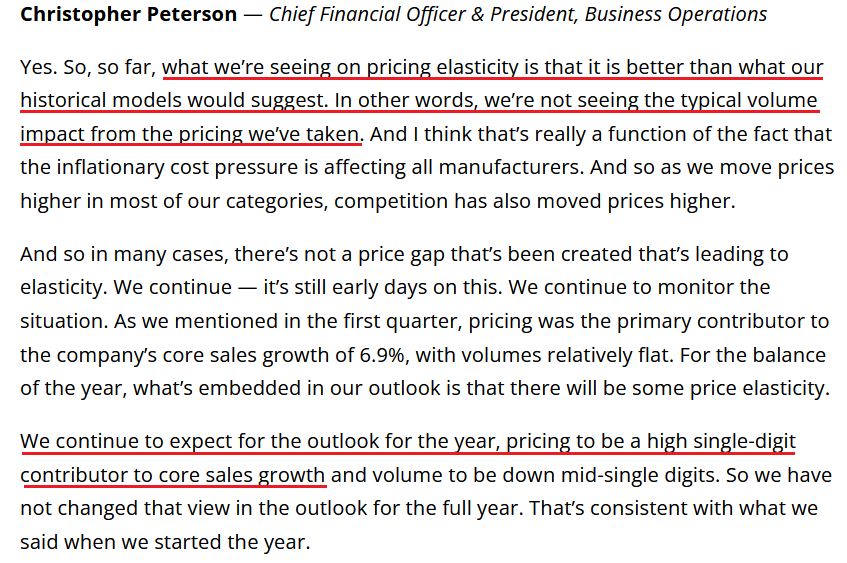
Furthermore, not only is the company projecting more price increases in the coming months, but CFO Christopher Peterson said that elasticities are outperforming and demand remains resilient. As a result, the combination is extremely inflationary.
Please see below:
 Source: Newell Brands/Alpha Street
Continuing the theme, Estée Lauder – a manufacturer of skincare, makeup, fragrance and hair care products – released its third-quarter earnings on May 3. CEO Fabrizio Freda said during the Q3 earnings call:
“Consumer demand remains robust even in this inflationary environment. Our largest brands provided highly sought-after, MAC, Estee Lauder, and Clinique each delivered double-digit growth in makeup, fueling the category renaissance while La Mer thrived in skincare.”
“Four of our scaling brands resonated strongly with consumers as Jo Malone London, Tom Ford Beauty, Aveda, and Bobbi Brown each rose double digits. Among our developing brands, Le Labo, KILIAN PARIS, and Bumble and bumble each achieved outsized growth and showcased their promise.”
As a result, with Americans eager to look their best and resume in-person activities, the inflationary impact is material. Therefore, like I wrote on May 11, whether or not inflation shows signs of deceleration on a YoY basis is irrelevant. The important point is that it’s still increasing month-over-month (MoM); and as long as that’s the case, the Fed has little choice but to remain hawked up.
Please see below:
 Source: Estée Lauder/ The Motley Fool
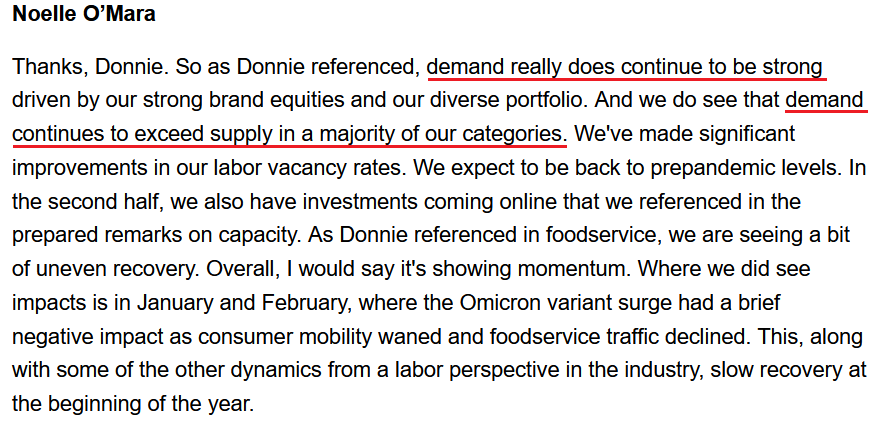
Making four of a kind, Tyson Foods – the largest U.S. meat company by sales – released its second-quarter earnings on May 9. CFO Stewart Glendinning said during the Q2 earnings call:
“We saw continued inflation across the business, in some instances, up 25% or more. Notable examples were labor feed ingredients, live cattle, lean hogs and freight costs.”
CEO Donnie King added:
“For the first half, our cost of goods sold rose 15% relative to the same period last year.”
As a result, the average sales price for pork “increased 10.8%” and chicken “improved 14.4%.” Moreover, King said that “we have also worked with customers to manage inflationary pressures by adjusting pricing to achieve a fair value for our products. This will be important to ensuring we deliver sequential improvement in our operating margins in the second half of fiscal year '22.”
Also noteworthy, resilient demand has increased the company’s confidence in raising prices:
 Source: Tyson Foods/Seeking Alpha
The bottom line? Despite mounting evidence that inflation was extremely problematic, investors initially let hope guide their investment decisions. However, with these realities more obvious now, the ‘buy the dip’ crowd has lost a lot of its mojo. Moreover, with the inflationary backdrop poised to keep the Fed’s foot on the hawkish accelerator, the medium-term outlooks for the PMs and the S&P 500 remain profoundly bearish. As a result, more hikes should elicit more fright in the coming months.
In conclusion, the PMs were mixed on May 11, as the GDX ETF was the daily underperformer. Moreover, with consumers’ appetite for spending not letting the Fed or investors off the hook, the central bank will have to kill demand to rid the U.S. of inflation. Therefore, the medium-term fundamentals are bullish for the USD Index and real yields but not for the PMs.
Naturally, as always, I’ll keep you – my subscribers – informed.
Overview of the Upcoming Part of the Decline
- It seems to me that the post-decline consolidation is now over, and that gold, silver, and mining stocks are now likely to continue their medium-term decline. A brief, short-term rally could materialize soon, anyway.
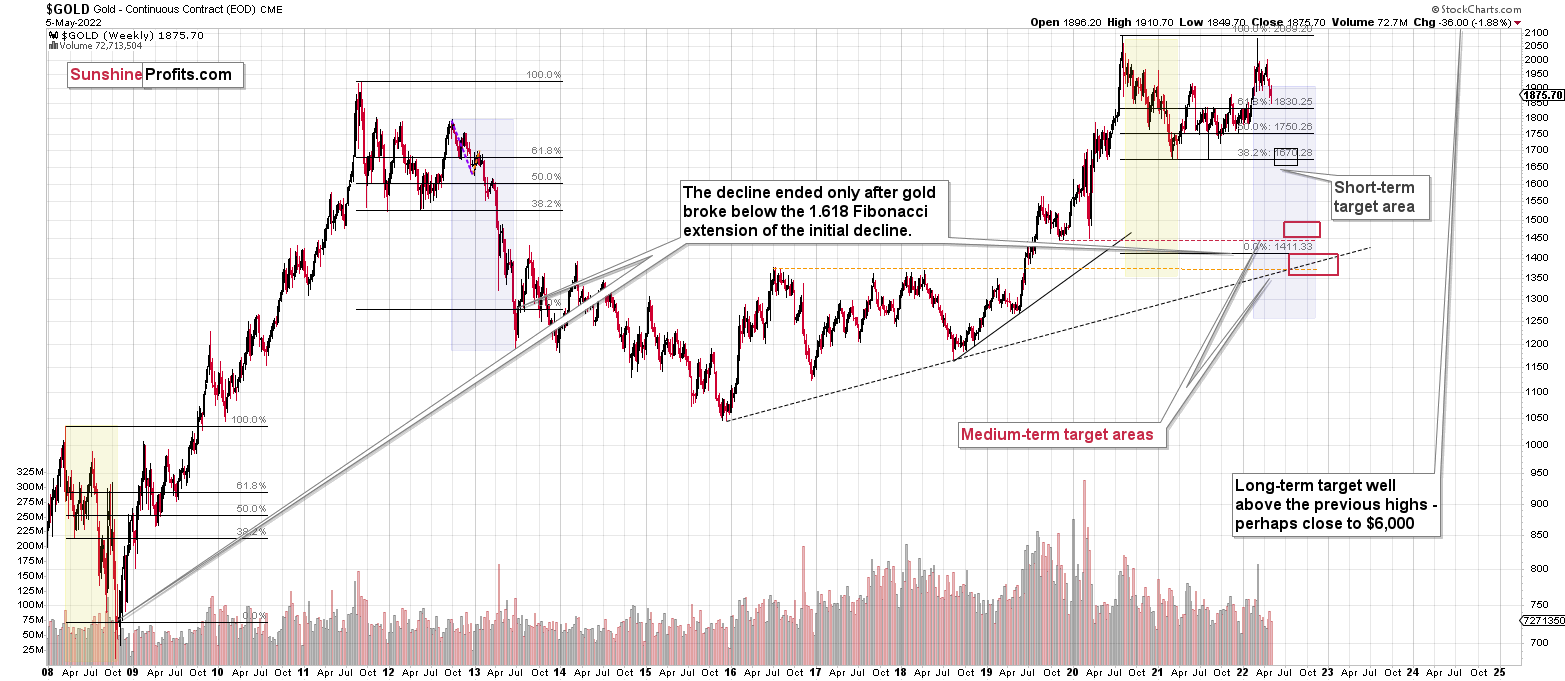
- It seems that the first ( bigger ) stop for gold will be close to its previous 2021 lows, slightly below $1,800 . Then it will likely correct a bit, but it’s unclear if I want to exit or reverse the current short position based on that – it depends on the number and the nature of the bullish indications that we get at that time.
- After the above-mentioned correction, we’re likely to see a powerful slide, perhaps close to the 2020 low ($1,450 - $1,500).
- If we see a situation where miners slide in a meaningful and volatile way while silver doesn’t (it just declines moderately), I plan to – once again – switch from short positions in miners to short positions in silver. At this time, it’s too early to say at what price levels this could take place, and if we get this kind of opportunity at all – perhaps with gold close to $1,600.
- I plan to exit all remaining short positions once gold shows substantial strength relative to the USD Index while the latter is still rallying. This may be the case with gold close to $1,350 - $1,400. I expect silver to fall the hardest in the final part of the move. This moment (when gold performs very strongly against the rallying USD and miners are strong relative to gold after its substantial decline) is likely to be the best entry point for long-term investments, in my view. This can also happen with gold close to $1,375, but at the moment it’s too early to say with certainty.
- As a confirmation for the above, I will use the (upcoming or perhaps we have already seen it?) top in the general stock market as the starting point for the three-month countdown. The reason is that after the 1929 top, gold miners declined for about three months after the general stock market started to slide. We also saw some confirmations of this theory based on the analogy to 2008. All in all, the precious metals sector is likely to bottom about three months after the general stock market tops.
- The above is based on the information available today, and it might change in the following days/weeks.
You will find my general overview of the outlook for gold on the chart below:
Please note that the above timing details are relatively broad and “for general overview only” – so that you know more or less what I think and how volatile I think the moves are likely to be – on an approximate basis. These time targets are not binding or clear enough for me to think that they should be used for purchasing options, warrants or similar instruments.
Summary
Summing up, it seems that we are about to see a short-term corrective upswing in the precious metals sector (after another very short-term move lower), even though the medium-term trend remains clearly down.
The medium-term downtrend is likely to continue shortly (perhaps after a weekly or a few-day long correction). As investors are starting to wake up to the reality, the precious metals sector (particularly junior mining stocks) is declining sharply. Here are the key aspects of the reality that market participants have ignored:
- rising real interest rates,
- rising USD Index values.
Both of the aforementioned are the two most important fundamental drivers of the gold price. Since neither the USD Index nor real interest rates are likely to stop rising anytime soon (especially now that inflation has become highly political), the gold price is likely to fall sooner or later. Given the analogy to 2012 in gold, silver, and mining stocks, “sooner” is the more likely outcome.
It seems that our profits from short positions are going to become truly epic in the coming months.
For now, I’m adjusting the exit price levels. Please note that they are “binding exit prices”, which means that I think that exiting the short positions without an additional (manual) confirmation from me is a good idea. I think that once these short positions are closed, entering long ones (100% of the regular position size) is also a good idea. If one wants to use a leveraged ETF for this long trade, the JNUG might be worth considering. However, it seems that in most cases, simply using the GDXJ would be sufficient (I’m writing about 100% of the regular position size, not 200% or 300% as I am right now in the case of the short positions). Then again, it’s your capital, and you can do with it whatever you want and are comfortable with.
Of course, if you’re not comfortable with such short-term trading, you can ignore this quick trade and focus on the bigger downturn.
After the final sell-off (that takes gold to about $1,350-$1,500), I expect the precious metals to rally significantly. The final part of the decline might take as little as 1-5 weeks, so it's important to stay alert to any changes.
As always, we'll keep you – our subscribers – informed.
To summarize:
Trading capital (supplementary part of the portfolio; our opinion): Full speculative short positions (300% of the full position) in junior mining stocks are justified from the risk to reward point of view with the following binding exit profit-take price levels:
Mining stocks (price levels for the GDXJ ETF): binding profit-take exit price: $36.23; stop-loss: none (the volatility is too big to justify a stop-loss order in case of this particular trade)
Alternatively, if one seeks leverage, we’re providing the binding profit-take levels for the JDST (2x leveraged) and GDXD (3x leveraged – which is not suggested for most traders/investors due to the significant leverage). The binding profit-take level for the JDST: $11.98; stop-loss for the JDST: none (the volatility is too big to justify a SL order in case of this particular trade); binding profit-take level for the GDXD: $15.98; stop-loss for the GDXD: none (the volatility is too big to justify a SL order in case of this particular trade).
For-your-information targets (our opinion; we continue to think that mining stocks are the preferred way of taking advantage of the upcoming price move, but if for whatever reason one wants / has to use silver or gold for this trade, we are providing the details anyway.):
Silver futures downside profit-take exit price: no position (the target was already reached)
SLV profit-take exit price: no position (the target was already reached)
ZSL profit-take exit price: no position (the target was already reached)
Gold futures downside profit-take exit price: no position (the target was already reached)
HGD.TO – alternative (Canadian) inverse 2x leveraged gold stocks ETF – the upside profit-take exit price: $7.78
HZD.TO – alternative (Canadian) inverse 2x leveraged silver ETF – the upside profit-take exit price: no position (the target was already reached)
Long-term capital (core part of the portfolio; our opinion): No positions (in other words: cash
Insurance capital (core part of the portfolio; our opinion): Full position
Whether you already subscribed or not, we encourage you to find out how to make the most of our alerts and read our replies to the most common alert-and-gold-trading-related-questions.
Please note that we describe the situation for the day that the alert is posted in the trading section. In other words, if we are writing about a speculative position, it means that it is up-to-date on the day it was posted. We are also featuring the initial target prices to decide whether keeping a position on a given day is in tune with your approach (some moves are too small for medium-term traders, and some might appear too big for day-traders).
Additionally, you might want to read why our stop-loss orders are usually relatively far from the current price.
Please note that a full position doesn't mean using all of the capital for a given trade. You will find details on our thoughts on gold portfolio structuring in the Key Insights section on our website.
As a reminder - "initial target price" means exactly that - an "initial" one. It's not a price level at which we suggest closing positions. If this becomes the case (like it did in the previous trade), we will refer to these levels as levels of exit orders (exactly as we've done previously). Stop-loss levels, however, are naturally not "initial", but something that, in our opinion, might be entered as an order.
Since it is impossible to synchronize target prices and stop-loss levels for all the ETFs and ETNs with the main markets that we provide these levels for (gold, silver and mining stocks - the GDX ETF), the stop-loss levels and target prices for other ETNs and ETF (among other: UGL, GLL, AGQ, ZSL, NUGT, DUST, JNUG, JDST) are provided as supplementary, and not as "final". This means that if a stop-loss or a target level is reached for any of the "additional instruments" (GLL for instance), but not for the "main instrument" (gold in this case), we will view positions in both gold and GLL as still open and the stop-loss for GLL would have to be moved lower. On the other hand, if gold moves to a stop-loss level but GLL doesn't, then we will view both positions (in gold and GLL) as closed. In other words, since it's not possible to be 100% certain that each related instrument moves to a given level when the underlying instrument does, we can't provide levels that would be binding. The levels that we do provide are our best estimate of the levels that will correspond to the levels in the underlying assets, but it will be the underlying assets that one will need to focus on regarding the signs pointing to closing a given position or keeping it open. We might adjust the levels in the "additional instruments" without adjusting the levels in the "main instruments", which will simply mean that we have improved our estimation of these levels, not that we changed our outlook on the markets. We are already working on a tool that would update these levels daily for the most popular ETFs, ETNs and individual mining stocks.
Our preferred ways to invest in and to trade gold along with the reasoning can be found in the how to buy gold section. Furthermore, our preferred ETFs and ETNs can be found in our Gold & Silver ETF Ranking.
As a reminder, Gold & Silver Trading Alerts are posted before or on each trading day (we usually post them before the opening bell, but we don't promise doing that each day). If there's anything urgent, we will send you an additional small alert before posting the main one.
Thank you.
Przemyslaw Radomski, CFA
Founder, Editor-in-chief

