

Briefly: in our opinion, full (200% of the regular size of the position) speculative short positions in gold, silver and mining stocks are justified from the risk/reward perspective at the moment of publishing this alert.
In yesterday’s analysis we explained why the outlook was no longer bullish, but bearish and we didn’t have to wait long for a confirmation. The short positions that we had entered, became profitable very quickly and we even saw more bearish signs yesterday as mining stocks continued to underperform gold. What’s next and how will we profit on it?
Most likely a big decline is coming next (even though nobody can rule out another short-term upswing, but it doesn’t seem likely enough to view it as a real threat) and given this outlook, it seems best to simply stick to the big short position that we have right now.
Let’s take a look at the charts for details, starting with the USD Index (charts courtesy of http://stockcharts.com).
USD’s Unfinished Comeback
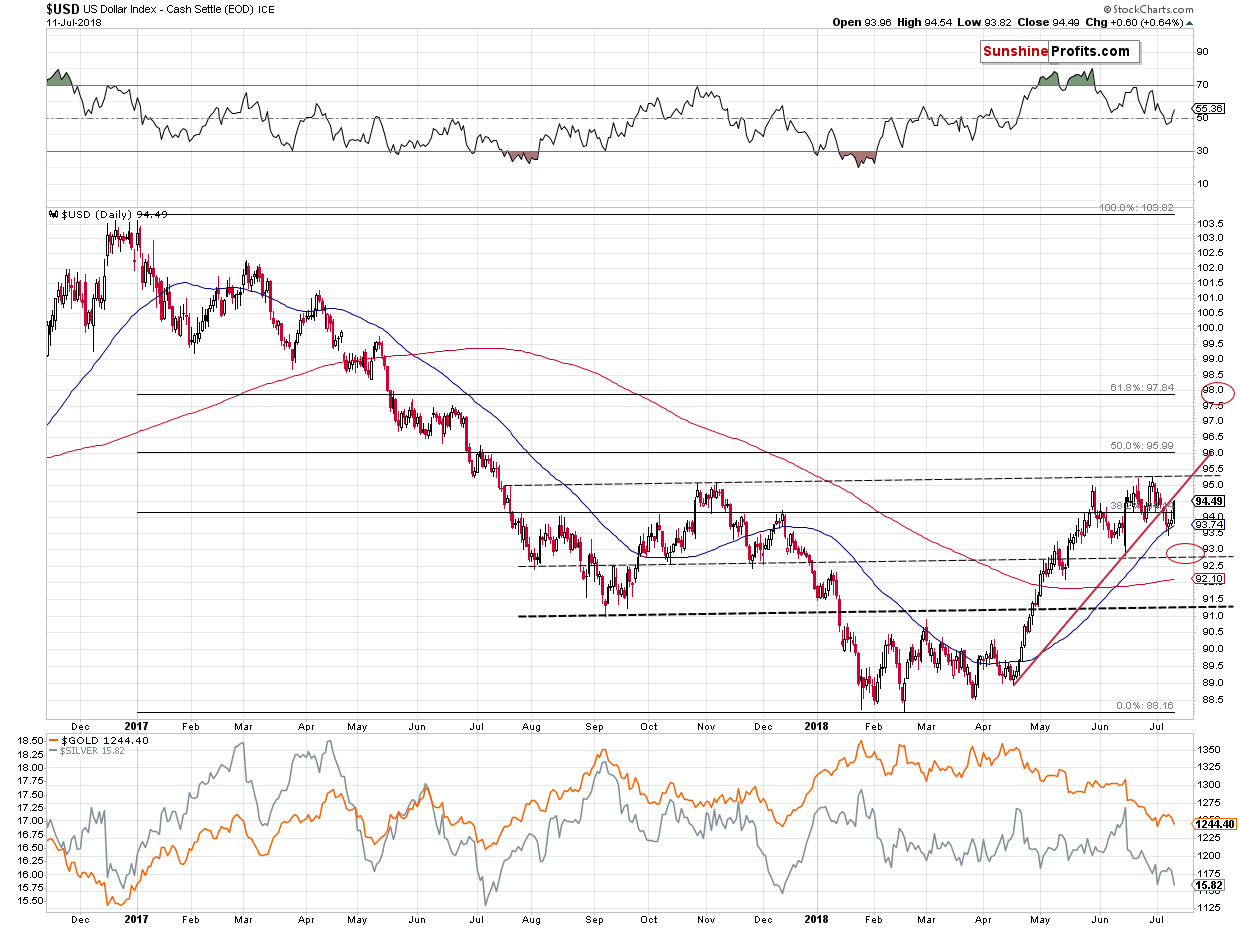
The USD Index has recently moved below the rising red support line and this was the factor that was supposed to take it much lower and trigger a sizable rally in gold. At first sight, nothing really changed in the case of the USDX – it’s still below the rising red support line, possibly verifying it as resistance.
But, in this case it seems like the devil is in the details. The key 2 components of the USD Index are the euro and the yen. The euro moved very close to its resistance and it seems to be in the decline mode. The situation in the Japanese yen is also very specific.
In yesterday’s Alert, we commented on the above chart in the following way:
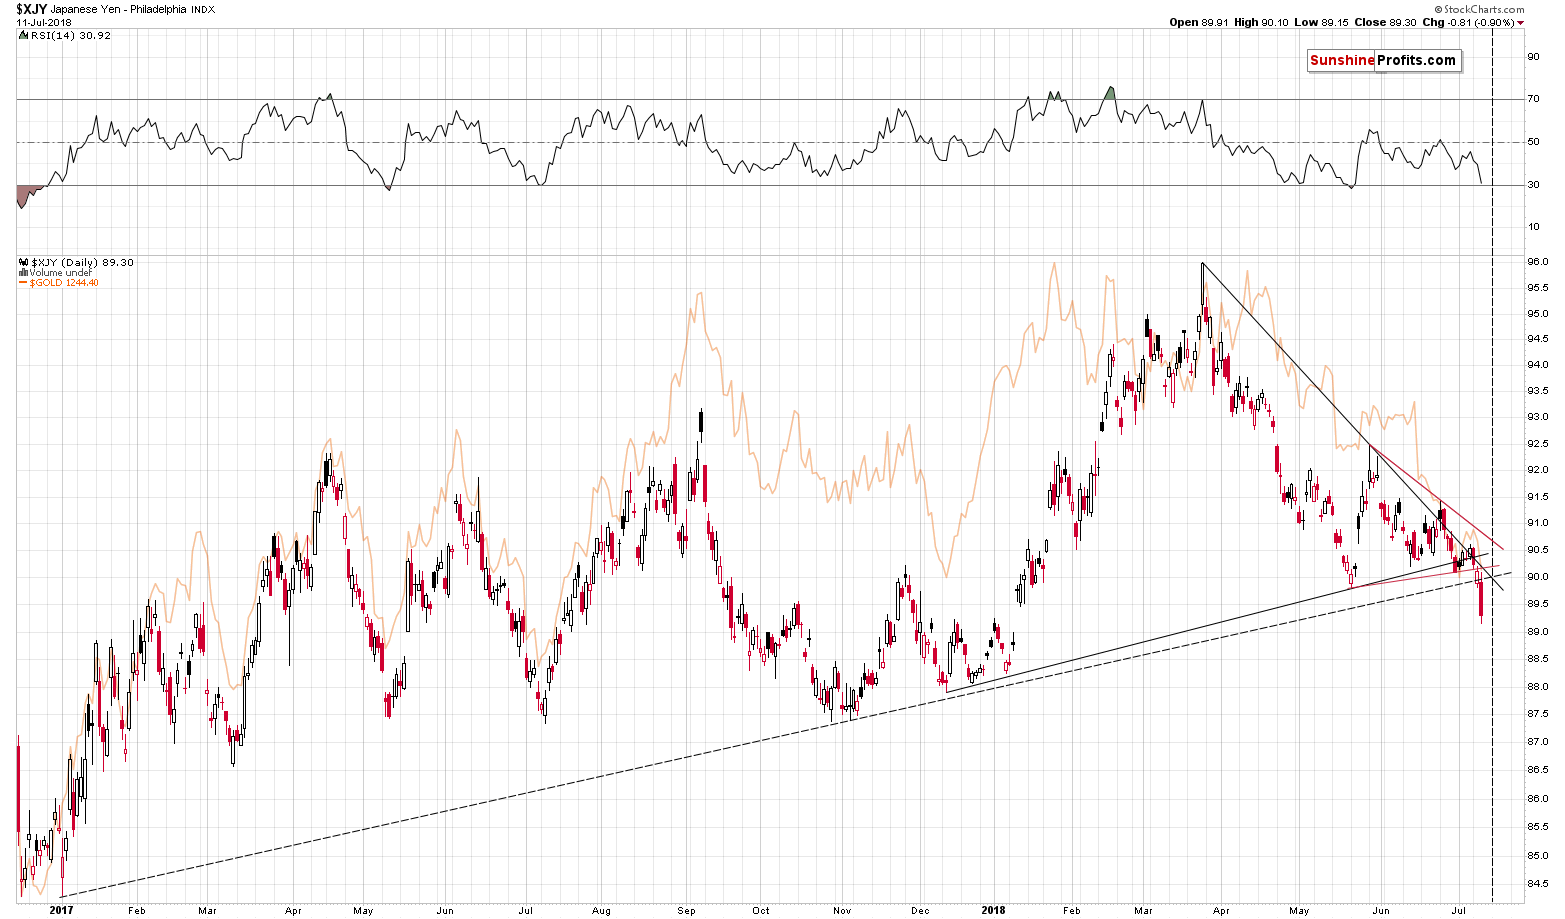
As we discussed yesterday, the price of gold quite often moves in tune with the Japanese yen. The latter just broke below several support levels, which has very bearish implications going forward. When we posted our yesterday’s analysis, the breakdowns were not confirmed. Based on the closing prices, we know that there was finally no breakdown below the rising medium-term support line, but there was a breakdown below the triangle marked in red. Therefore, the outlook and thus the implications for the PMs deteriorated anyway.
Moreover, the Japanese yen is down once again in today’s pre-market trading, suggesting that we may see a breakdown below the rising medium-term support line shortly.
And we did see it. The breakdown was quite clear and the implications of both breakdowns: below the rising medium-term support line and the triangle pattern are bearish.
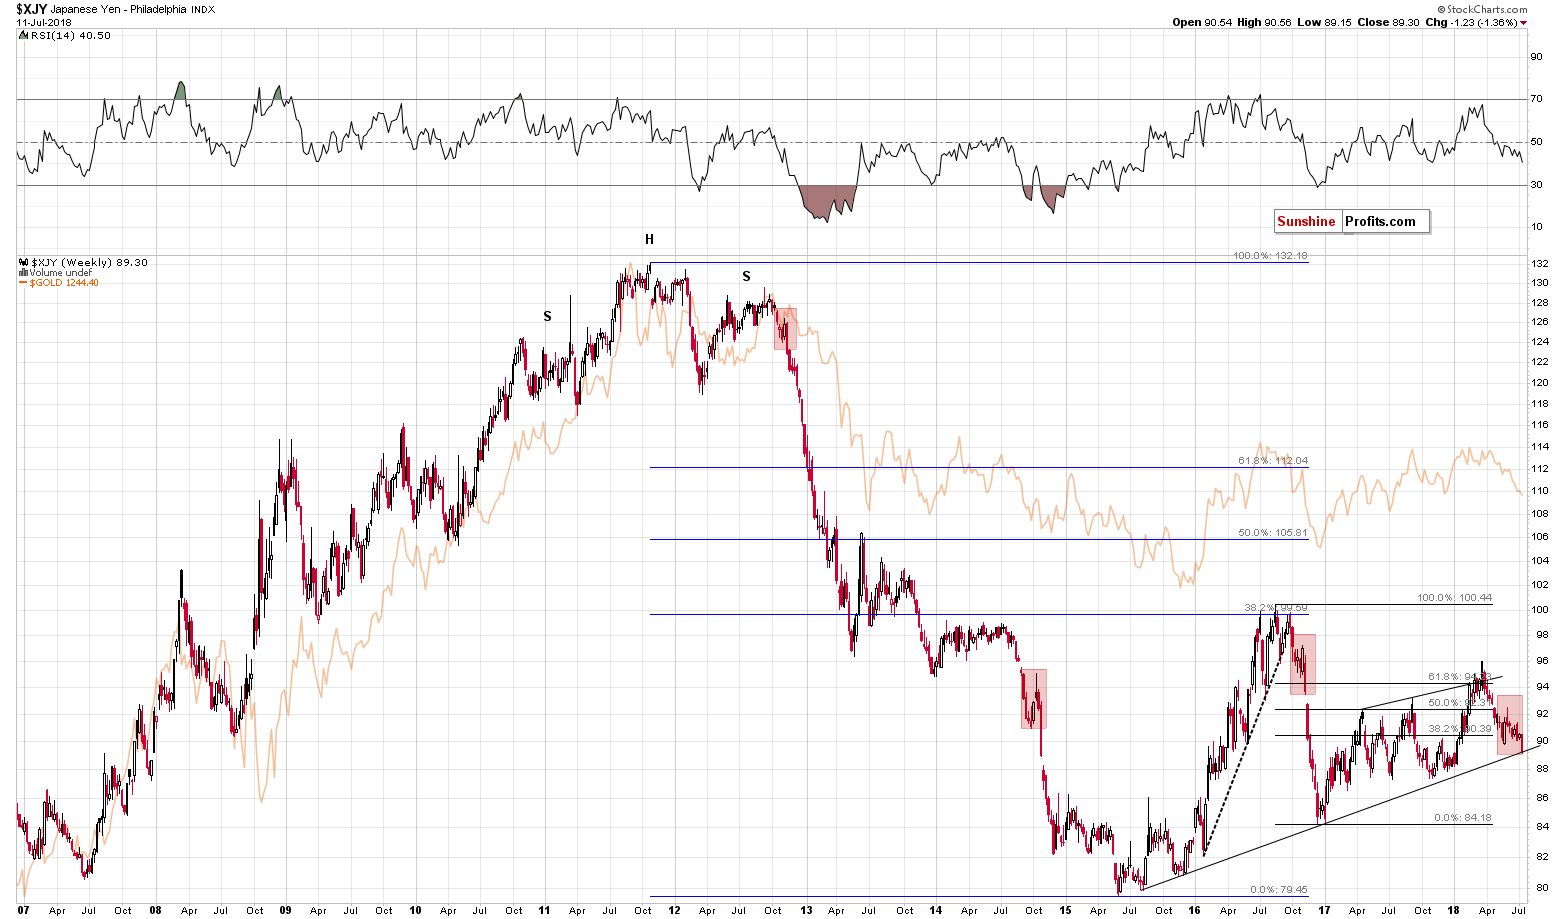
But, at the same time, the Japanese yen moved to its long-term support line, which might trigger a pause… But it doesn’t. The Japanese yen is once again down in today’s pre-market trading, so we might be looking at a long-term breakdown in the making.
What does all this mean for us – precious metals investors and traders? It means that the situation is tense with a bearish bias. The USD Index is at a resistance, but ultimately the index will move in tune with the currencies it’s made of. Looking at the EUR/USD makes us think that the USD’s rally has further to go, so the main thing still preventing the USD Index from moving higher is the Japanese yen. More precisely, it is its rising long-term support line. Since the yen is already after two breakdowns that have bearish implications for the short term, a long-term breakdown also seems quite likely, especially that today’s pre-market action confirms it.
So, even though looking only at the USD Index chart alone might indicate lower USD values, it seems that higher values are more likely, which is bearish for the precious metals sector.
Most importantly, however, gold and silver moved to/below their previous lows, while the USD Index is not at its recent highs yet, which means that PMs are showing weakness on a relative basis. This is a more important factor and it’s also bearish.
Speaking of gold, let’s take a look at what happened in it yesterday.
Verification of Gold’s Major Breakdown
In yesterday’s Alert, we wrote the following:
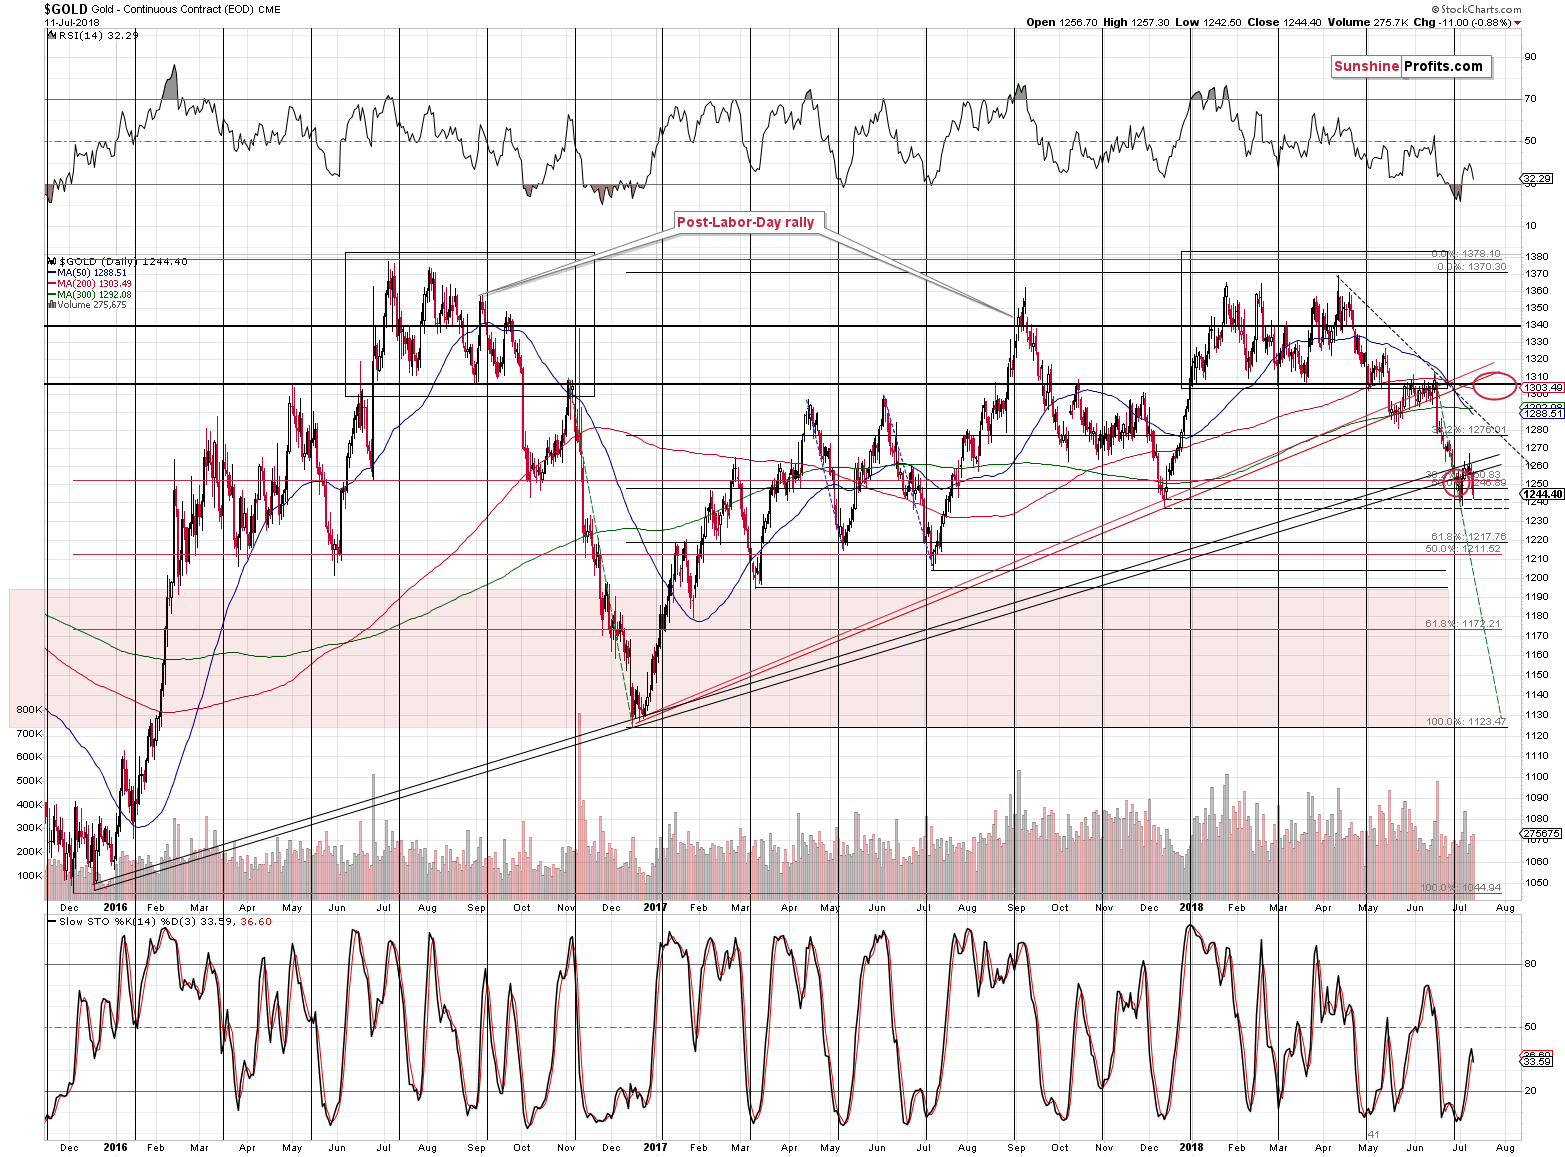
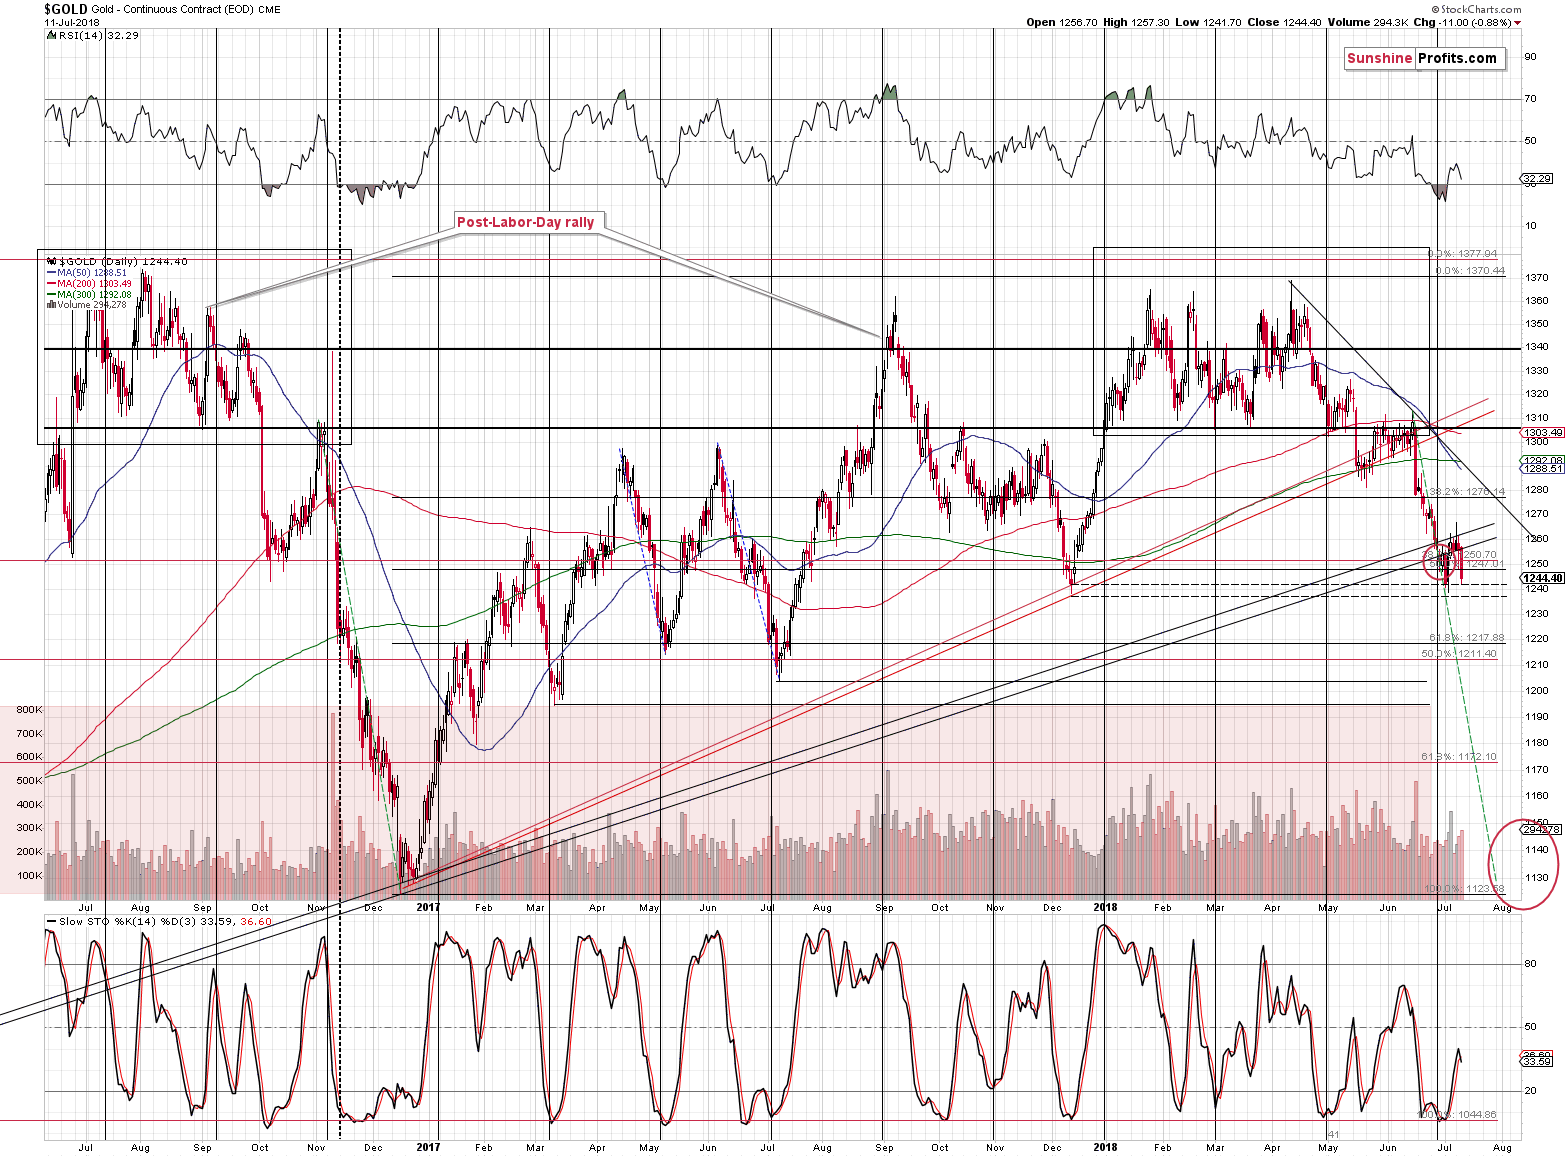
(…) we saw a breakdown below the medium-term support line that was based on major bottoms (late 2015 and late 2016 price extremes). Gold was likely to rally based on multiple factors – and it did - but, instead of invalidating the breakdown and rallying to $1,300 (which seemed quite realistic given the previous oversold situation in terms of the RSI indicator), gold just moved back to the rising support line and verified it as resistance.
In other words, we had many bullish signals, but perhaps what was likely to happen based on them has already happened. We saw a rally, but gold was not strong enough to even invalidate a breakdown, let alone rally back to the June highs.
On a short-term basis, we see that yesterday’s decline took place on volume that was higher than Monday’s move up, which is a bearish sign. That’s one of the reasons that confirms that taking profits off the table and closing our previous short-term long position in the precious metals market was indeed a good idea.
Gold declined once again and the volume that accompanied the move was a bit higher than the one that accompanied Tuesday’s move lower. The decline continues on increasing volume, which is a bearish sign.
What’s more bearish, however, is that the breakdown below the mentioned support/resistance line is now confirmed. This is a huge deal and the chart below shows why.
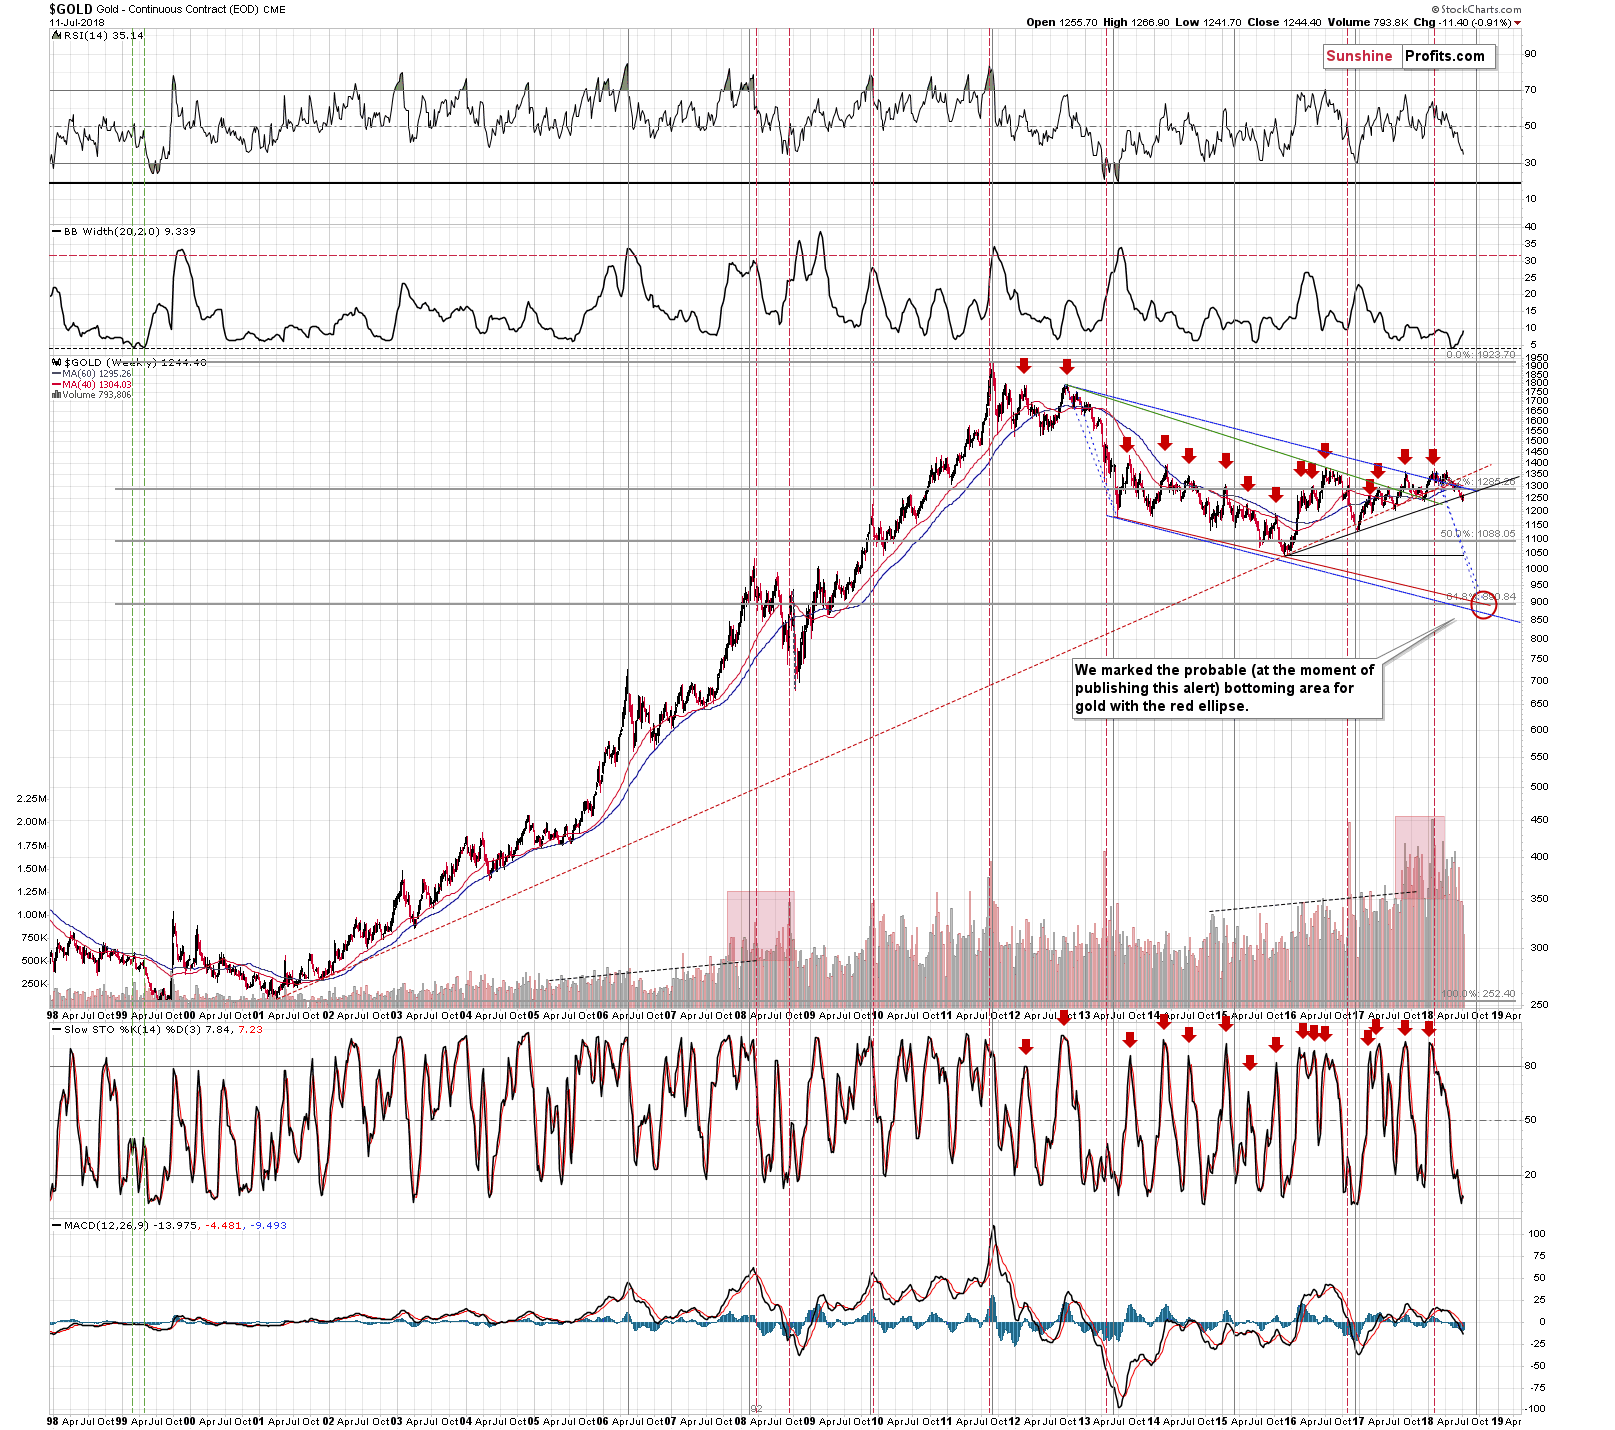
That’s the only nearby support of medium- / long-term significance. With this level out of the way, there’s very little that can prevent gold’s decline until much lower prices. Given the USD’s bullish medium-term outlook and in light of gold’s weakness relative to it, it seems that gold is now ready to truly slide.
The next strong support is close to $1,140 – at the late 2016 low. The next one is at the late 2015 low (about $1,050) and then the final support – and the final target price – is at $890, as confirmed by the 61.8% Fibonacci retracement level based on the entire bull market, the declining red support line, the analogy to the 2012-2013 decline and the very long-term turning point for gold.
Gold’s RSI Close to 30 - Implications
But the daily RSI for gold is close to 30 – isn’t shorting gold in such environment dangerous?
That’s a very good question. Some may definitely say that is dangerous or even stupid. But, is this really the case? If one wants to make money in the market, one needs to go beyond the regular rules of thumb and dig deep into a given market and verify how it is really affected by certain signals. Plus, one needs to be sure that they are applying the tools where they should be used. For instance, forks are very useful for many things. But, not for eating soup, writing an essay, or chopping wood.
The RSI is an excellent tool for detecting tops and bottoms in gold during a horizontal (sideways) trend and it’s also quite useful during a steady rally. This has been confirmed by multiple cases in the past.
But, this is not the case during the medium-term downtrends, especially the more volatile ones. Let’s take one more look at gold’s medium-term chart. This time let’s focus on the previous huge downswing (late 2016).
The biggest part of the downswing took place in November 2016 and in the early part of December. Why is this significant?
The RSI moved below 30 based on the November 11, 2016 session, which is when gold closed at $1,224. Even though it was after a decline, it was a great shorting opportunity. Gold bottomed about a month later at $1,130 – almost $100 lower.
One may say that this was just a one-time development and that it’s just a single exception that doesn’t change the rule. But that’s simply not the case. There was just one huge decline, so it’s no wonder that there was only one case when gold moved lower after the RSI moved below 30.
But there were other major declines that we can discuss. Due to many similarities it seems that the comparison to the 2012-2013 decline will be most useful.
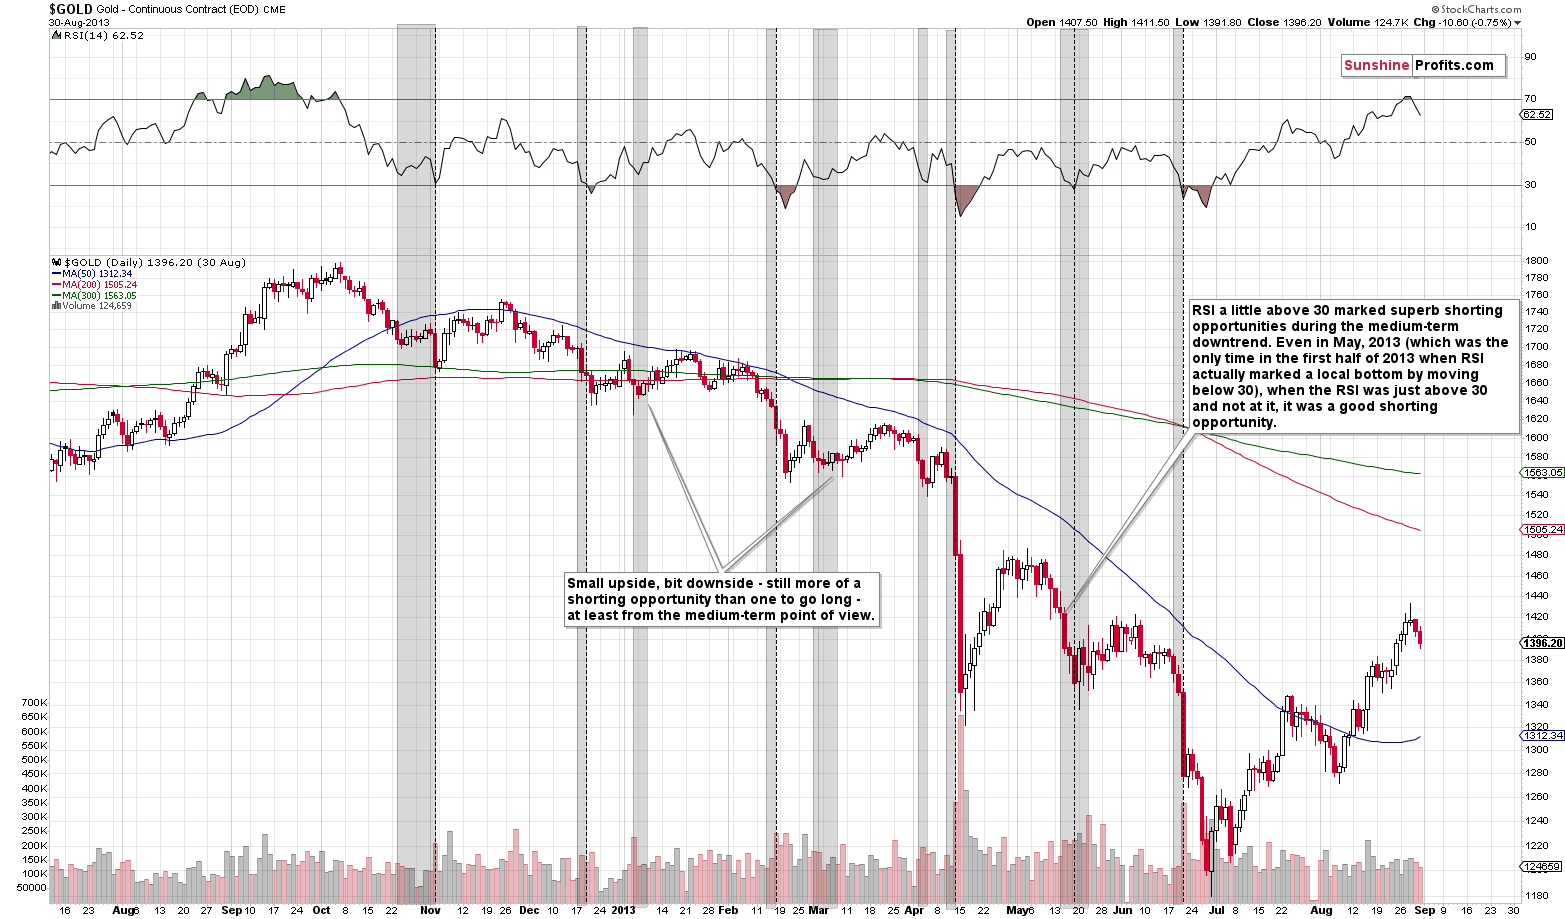
The vertical dashed lines represent times when the RSI broke below the 30 level and the gray areas mark the times when the RSI was close to 30. What kind of action in gold did we see on those occasions?
In the first case, at the beginning of November 2012 (when gold was still trading sideways rather than declining), the RSI’s move to 30 marked the local bottom.
In mid-December 2012, an analogous signal was seen right before the bottom - not at it. Gold’s post-bottom rally took the yellow metal only a bit higher than gold had been trading when the RSI moved below 30, so it was hardly a buying opportunity. Considering what took place in the following months, it was much more of a shorting opportunity.
In mid-February the RSI’s move below 30 was immediately followed by lower prices and after a nearby bottom, gold only moved to the price level that we saw when the signal had been seen. This makes it a great shorting opportunity, also in light of what followed in the months to come.
In mid-April the RSI moved below 30 after the first day of the decline and right before the biggest daily (over $100) decline that we have on the above chart. That was an excellent shorting opportunity, not a time to buy.
In mid-May, the RSI marked a local bottom, but it was followed by a relatively small rally and a relatively big decline. Was this a buying opportunity or a shorting one? From the short-term point of view, it was a buying one, but being realistic, it might have been difficult to exit at the local top that followed and waiting things out would have resulted in missing the profits from the entire big downswing, not to mention losses that holding onto a long position would have caused.
In mid-June we saw something similar – gold moved only a bit higher after the RSI’s move below 30 only to decline shortly thereafter. From the signal to the intraday bottom - gold declined about $100. Again, a great shorting opportunity.
Summing up, almost all classic buy signals from the RSI seen during a medium-term downswing were good shorting opportunities.
But, let’s consider the times when the RSI was just close to 30, like what we have right now – the areas marked in gray.
The late-October 2012 area preceded the early November bottom and we then saw a move higher, but not a significant one. It’s a tough call to say if that was a good buying or shorting opportunity – it depends on one’s approach too much.
The mid-December area was clearly preceding a bottom and it was a good shorting opportunity.
The January 2013 area was followed by a rally that was rather limited, but overall, one could say that the implications were bullish.
The mid-February 2013 area was a clear shorting opportunity.
The early March 2013 area was followed by a small rally that ultimately was followed by a huge slide. It was somewhat bullish for the short term, though.
The early April area was a good shorting opportunity in the very short term and in terms of the next few weeks.
The mid-April area was the best shorting opportunity of the year, and perhaps a decade.
The mid-May area was a good shorting opportunity as well.
Finally, the mid-June area was once again a great shorting opportunity.
Summing up, once again, during the medium-term downtrend, the RSI close to 30 marked great shorting opportunities much more often than it marked buying opportunities. Moreover, the buying opportunities that it did mark were rather weak, and the shorting opportunities that it marked were profound and very profitable.
Additionally, two biggest downswings (April and June 2013) included a “buy” signal from the daily RSI close to the middle of the move. In the first case it was followed by a slide and of about $140 in the second case by about a $100 one.
If we take into account the times when the RSI was a bit above 30, but not at it, then we can see that both extreme declines in gold were followed by this kind of “buy signal”. The same goes for many smaller (but still significant) declines, like the February 2013 one.
It’s also true to say that in 2013there was no huge decline in gold without the RSI close to 30 before. Consequently, with gold in a medium-term downtrend, refusing to open short positions based on the RSI being close to 30 seems to be very effective way to miss out on all big slides.
What does it mean in plain terms? It means that if gold is in a strong medium-term downswing, expecting the RSI based on daily prices to indicate a bottom in a classic way is like trying to chop a tree using a fork.
Consequently, it all comes down to the question if gold is in a medium-term downtrend? The reply is quite straightforward - of course it is due to multiple bearish signals that we discussed previously and the recent breakdown below the rising medium-term support line and its verification serve as a strong confirmation.
But, it seems that we wrote enough about gold for today. Let’s move to silver.
Confirmation of Silver’s Breakdown
In yesterday’s Alert, we wrote the following:
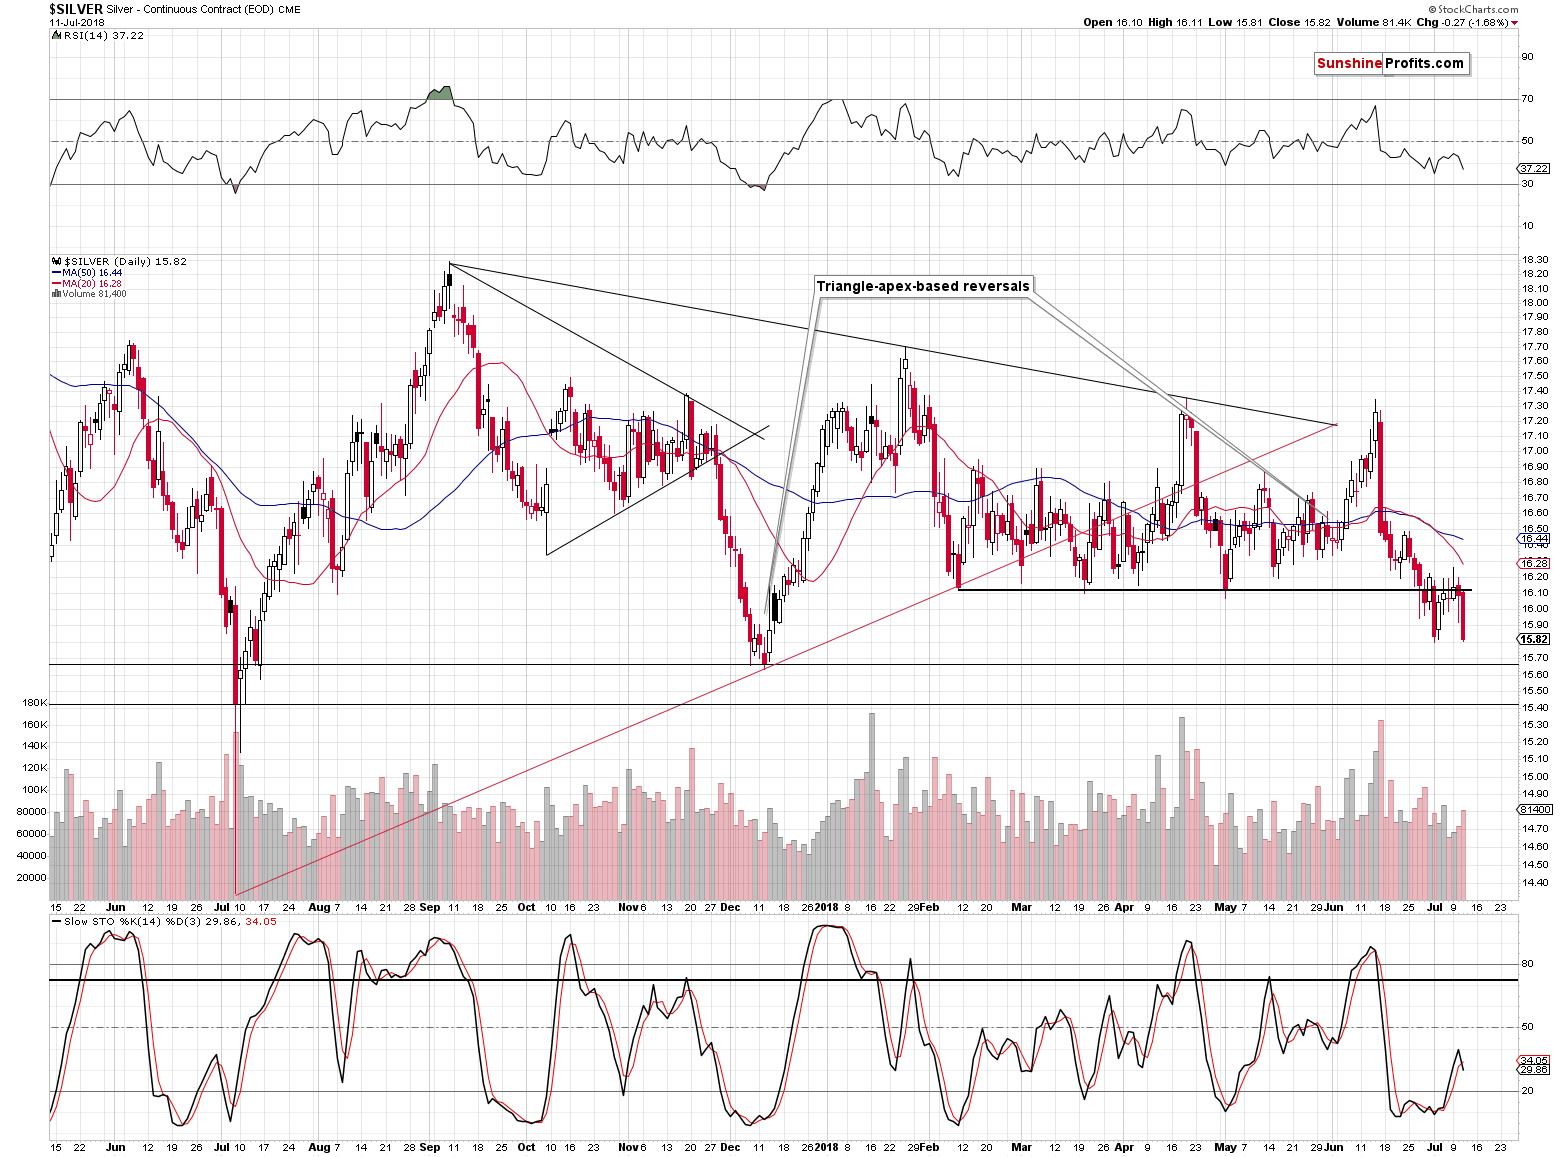
Silver moved back up after the overnight decline, but it closed the session below the previous day’s closing price. What’s really important is that silver closed the day below the previous lowest close of the year ($16.13). This means that – in analogy to gold – silver broke below an important support level (previous 2018 lows) and the recent rally was just a verification of the breakdown.
In general, it’s one of the best trading (here: shorting) opportunities when a market is after a breakdown and then it confirms it by moving back to the previous support and verifies it as resistance. That’s what just happened in gold and what happened in silver.
Both precious metals had good technical reasons to rally back above the mentioned support/resistance levels – but they didn’t manage to do so. This indicates that the short-term outlook can no longer be described as bullish.
The above remains up-to-date. In fact, it’s more than just that. Yesterday’s slide and a daily close below the previous 2018 low is a strong bearish confirmation. Consequently, the outlook is more bearish than it was after Tuesday’s session.
Speaking of bearish confirmations, let’s take a look at the gold miners and their ratio to gold.
Gold Stocks and their Ratio to Gold
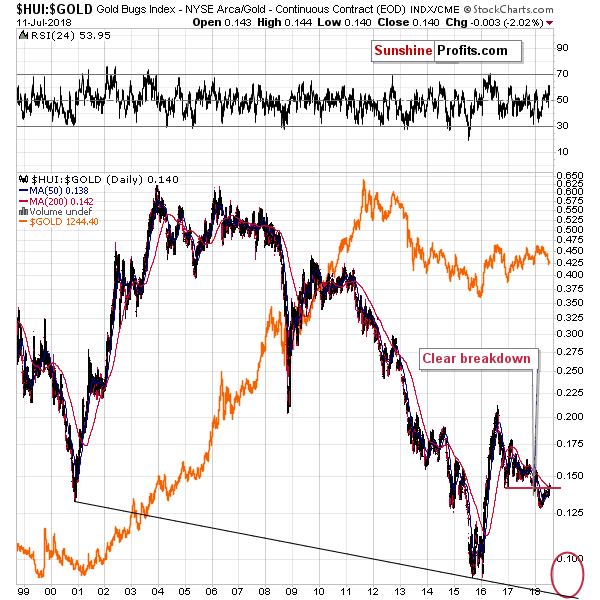
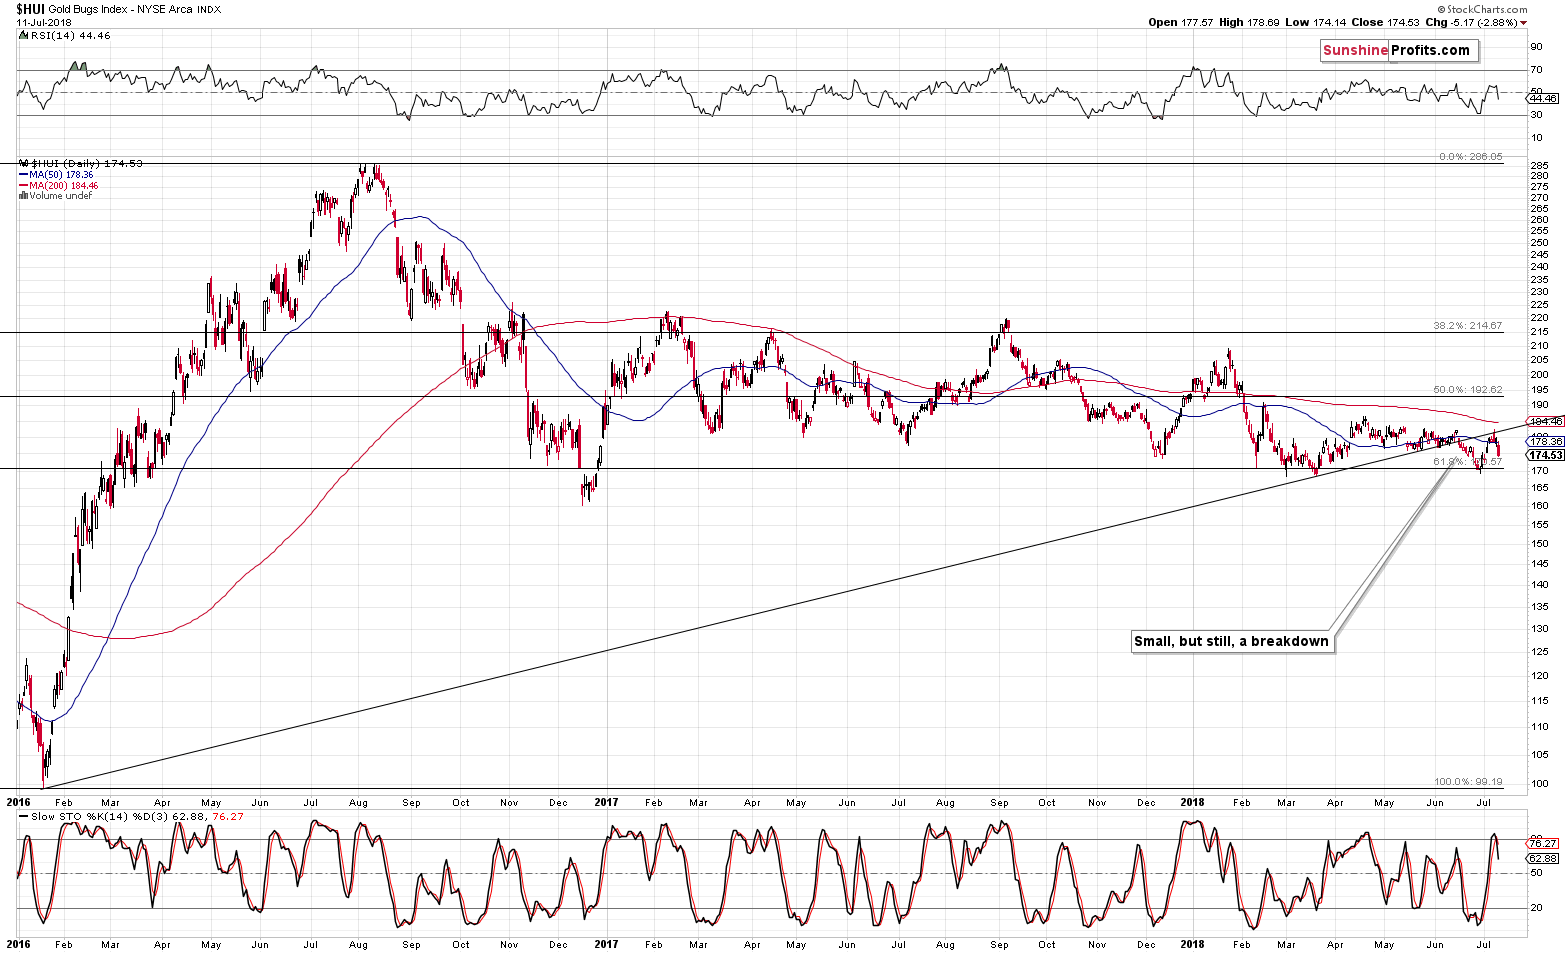
You know very well that the gold stocks to gold ratio is after a breakdown below its late-2016 low and the most recent rally was just a verification of this breakdown. But, there are also other bearish signals that are visible once we zoom in.
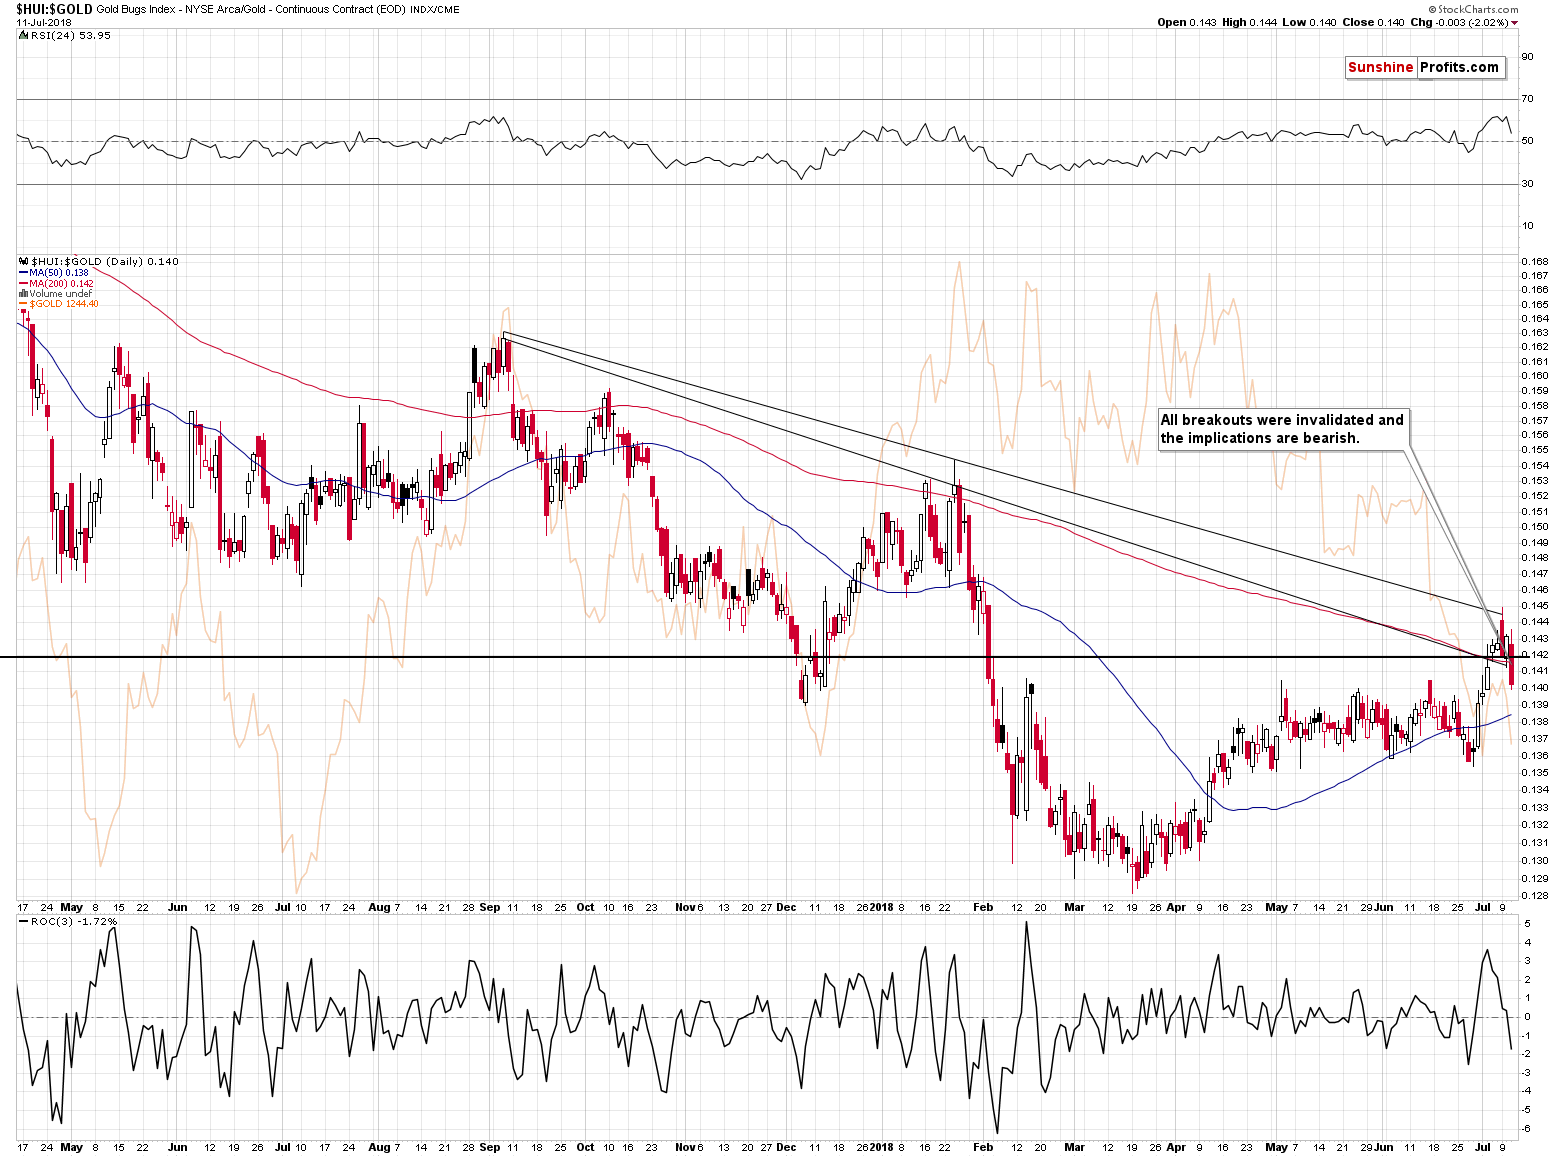
The HUI to gold ratio also moved above a bit above the declining medium-term resistance lines and these small breakouts were invalidated. Invalidations of breakdowns are generally bearish signs, and the above is not an exception.
We can see the same thing in the case of the GDX ETF.
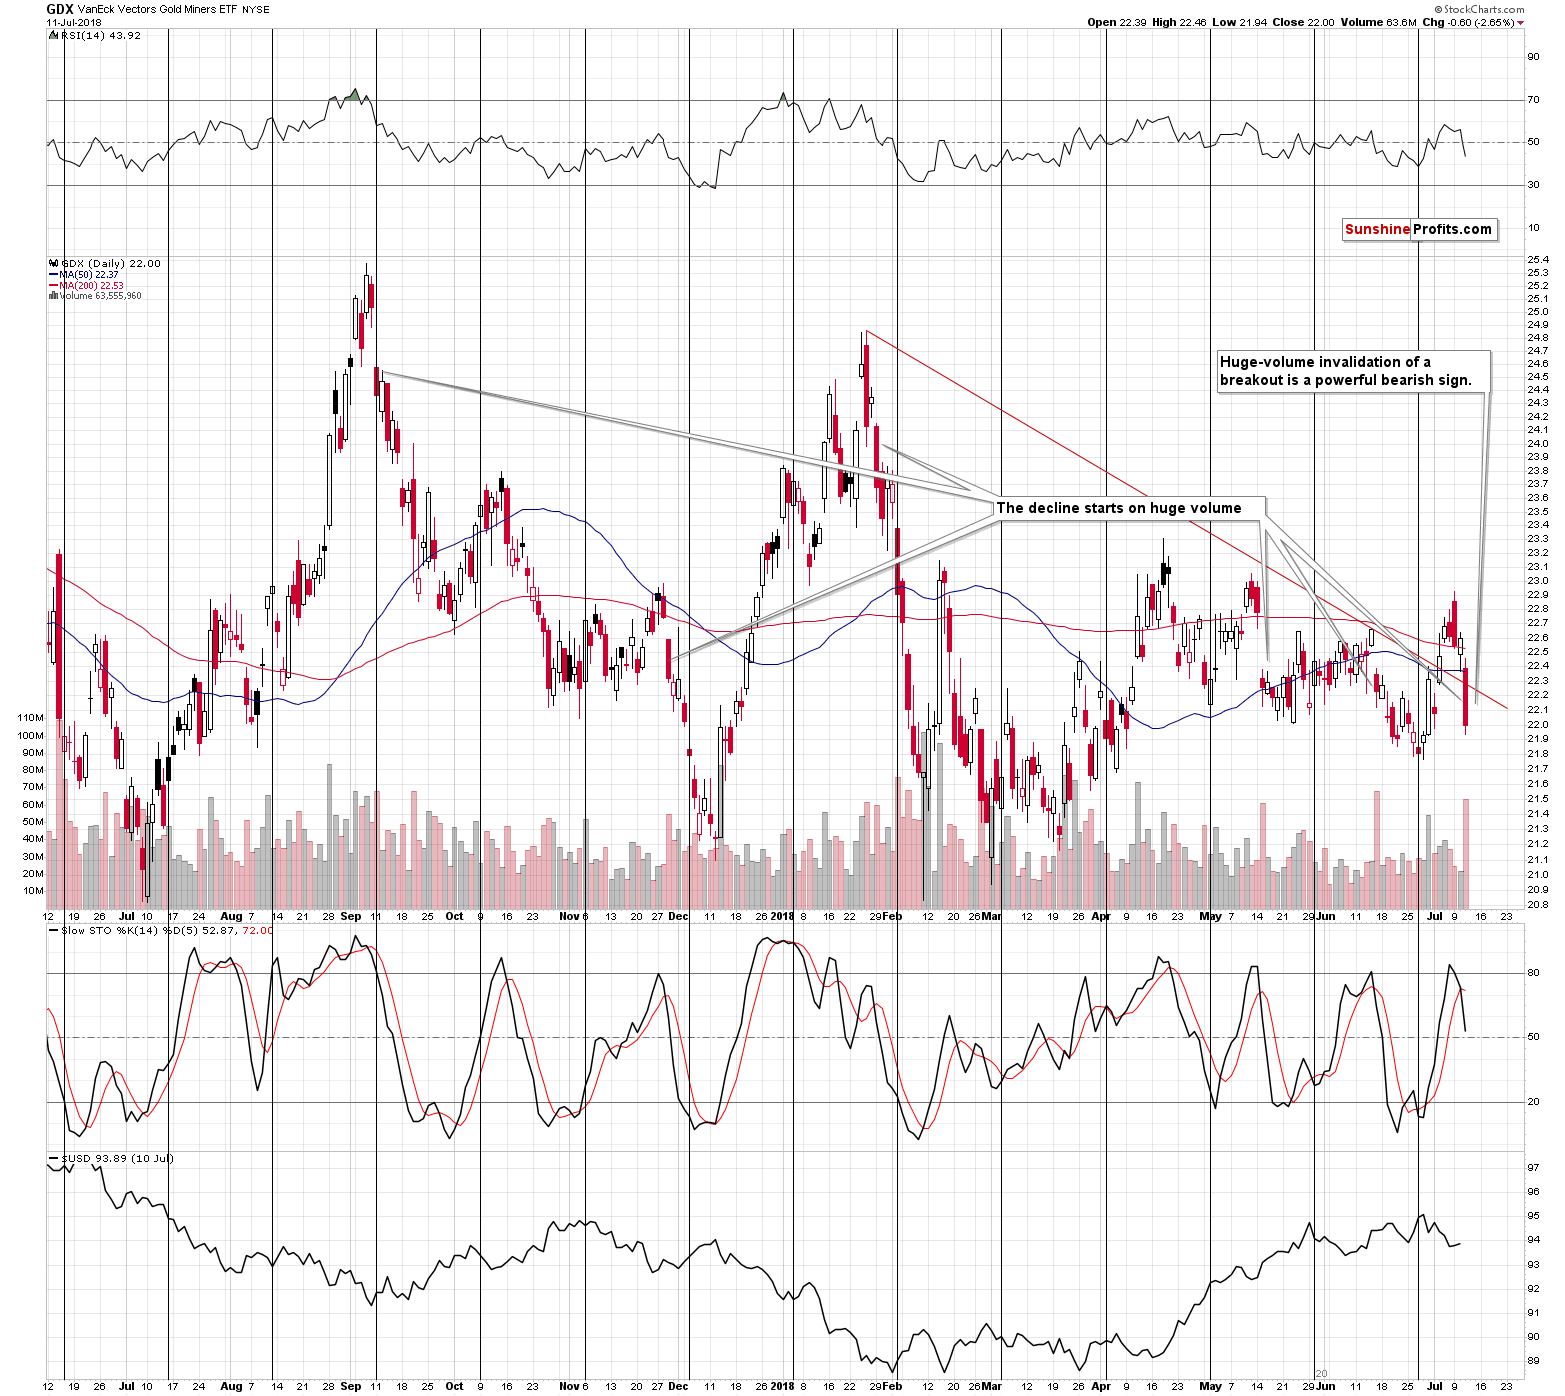
Mining stocks invalidated the breakout above the declining red resistance line, which has bearish implications. They did so on huge volume, which suggests that the decline has only begun. We marked several other cases, when big slides started in this way.
Moreover, we saw a clear sell sign from the Stochastic indicator.
We can see the same sell sign in the case of the Stochastic based on the HUI Index, so we can say that the signal is confirmed. Again, the implications are bearish.
Summary
Summing up, due to several new developments, the outlook for the precious metals market in no longer only bearish, but extremely bearish. The verification of breakdowns in gold and silver, the invalidation of breakouts in mining stocks and mining stocks ratio, the breakdowns in the Japanese yen and a good chance of seeing the key one, the relative strength of PMs to the USD Index, and many other smaller signs all point to lower precious metals prices in the following weeks and days. Nobody can guarantee any kind of performance, but it seems that the risk to reward ratio continues to favor sizable short positions in the precious metals sector. It seems that the quick profits that they generated will greatly increase in the coming days and weeks.
As always, we’ll keep you – our subscribers – informed.
To summarize:
Trading capital (supplementary part of the portfolio; our opinion): Full short positions (200% of the full position) in gold, silver and mining stocks are justified from the risk/reward perspective with the following stop-loss orders and initial target price levels:
- Gold: initial target price: $1,142; stop-loss: $1,272; initial target price for the DGLD ETN: $63.96; stop-loss for the DGLD ETN $46.38
- Silver: initial target price: $14.42; stop-loss: $16.46; initial target price for the DSLV ETN: $32.97; stop-loss for the DSLV ETN $24.07
- Mining stocks (price levels for the GDX ETF): initial target price: $19.12; stop-loss: $23.64; initial target price for the DUST ETF: $37.97; stop-loss for the DUST ETF $20.87
In case one wants to bet on junior mining stocks' prices (we do not suggest doing so – we think senior mining stocks are more predictable in the case of short-term trades – but if one wants to do it anyway, we provide the details), here are the stop-loss details and initial target prices:
- GDXJ ETF: initial target price: $28.10; stop-loss: $34.82
- JDST ETF: initial target price: $74.83 stop-loss: $42.78
Long-term capital (core part of the portfolio; our opinion): No positions (in other words: cash)
Insurance capital (core part of the portfolio; our opinion): Full position
Important Details for New Subscribers
Whether you already subscribed or not, we encourage you to find out how to make the most of our alerts and read our replies to the most common alert-and-gold-trading-related-questions.
Please note that the in the trading section we describe the situation for the day that the alert is posted. In other words, it we are writing about a speculative position, it means that it is up-to-date on the day it was posted. We are also featuring the initial target prices, so that you can decide whether keeping a position on a given day is something that is in tune with your approach (some moves are too small for medium-term traders and some might appear too big for day-traders).
Plus, you might want to read why our stop-loss orders are usually relatively far from the current price.
Please note that a full position doesn’t mean using all of the capital for a given trade. You will find details on our thoughts on gold portfolio structuring in the Key Insights section on our website.
As a reminder – “initial target price” means exactly that – an “initial” one, it’s not a price level at which we suggest closing positions. If this becomes the case (like it did in the previous trade) we will refer to these levels as levels of exit orders (exactly as we’ve done previously). Stop-loss levels, however, are naturally not “initial”, but something that, in our opinion, might be entered as an order.
Since it is impossible to synchronize target prices and stop-loss levels for all the ETFs and ETNs with the main markets that we provide these levels for (gold, silver and mining stocks – the GDX ETF), the stop-loss levels and target prices for other ETNs and ETF (among other: UGLD, DGLD, USLV, DSLV, NUGT, DUST, JNUG, JDST) are provided as supplementary, and not as “final”. This means that if a stop-loss or a target level is reached for any of the “additional instruments” (DGLD for instance), but not for the “main instrument” (gold in this case), we will view positions in both gold and DGLD as still open and the stop-loss for DGLD would have to be moved lower. On the other hand, if gold moves to a stop-loss level but DGLD doesn’t, then we will view both positions (in gold and DGLD) as closed. In other words, since it’s not possible to be 100% certain that each related instrument moves to a given level when the underlying instrument does, we can’t provide levels that would be binding. The levels that we do provide are our best estimate of the levels that will correspond to the levels in the underlying assets, but it will be the underlying assets that one will need to focus on regarding the signs pointing to closing a given position or keeping it open. We might adjust the levels in the “additional instruments” without adjusting the levels in the “main instruments”, which will simply mean that we have improved our estimation of these levels, not that we changed our outlook on the markets. We are already working on a tool that would update these levels on a daily basis for the most popular ETFs, ETNs and individual mining stocks.
Our preferred ways to invest in and to trade gold along with the reasoning can be found in the how to buy gold section. Additionally, our preferred ETFs and ETNs can be found in our Gold & Silver ETF Ranking.
As a reminder, Gold & Silver Trading Alerts are posted before or on each trading day (we usually post them before the opening bell, but we don't promise doing that each day). If there's anything urgent, we will send you an additional small alert before posting the main one.
=====
Latest Free Trading Alerts:
The U.S. unemployment rate rose in June. But this is good for the economy. What? Good? How is that?
The S&P 500 index retraced some of its recent advance yesterday, as investors reacted to overnight trade tariffs announcement. Is this a new downtrend? Or just a downward correction before another leg higher? There are still two possible medium-term scenarios.
Stocks Trying to Break Higher Again, Will They?
=====
Hand-picked precious-metals-related links:
PRECIOUS-Gold steady but lacks upside momentum despite trade war fears
South African Gold Output Falls Most Since February 2017 in May
=====
In other news:
U.S. Yield Curve to Invert in Mid-2019, Morgan Stanley Says
China Plays for Time in Trade War With Subtle Shift in Rhetoric
It’s not wage rises that are a problem for the economy – it’s the lack of them
Bitcoin Looks More Like Gold Than a Currency
Copper price plunges to 1-year low
The U.S. Could Soon Reclaim the World's Oil Crown
Oil rallies as IEA warns of output capacity limits
=====
Thank you.
Sincerely,
Przemyslaw Radomski, CFA
Founder, Editor-in-chief, Gold & Silver Fund Manager
Gold & Silver Trading Alerts
Forex Trading Alerts
Oil Investment Updates
Oil Trading Alerts

