

Briefly: in our opinion, full (200% of the regular size of the position) speculative short positions in gold, silver and mining stocks are justified from the risk/reward perspective at the moment of publishing this alert.
The USD Index seems to have topped as it’s already more than one index point below this week’s high and gold’s reaction was… Less than spectacular to say it politely. To be precise – gold did almost nothing and the reaction was very boring. No action = no implications? Wrong. The above tells us quite a lot.
In short, it tells us that what we wrote yesterday about the gold-USD link and the mechanics behind the recent changes was correct. The exciting part is that it means that we shouldn’t really fear a temporary decline in the USD Index even if it is underway. Let’s quote the appropriate part of yesterday’s alert:
If it was the increased risk regarding the Eurozone that actually caused both: gold’s rally and USD’s rally, then subsiding risk could be negative for both: USD and gold. Consequently, while the USD Index is currently likely to move lower, it may not translate into much higher prices of precious metals and mining stocks. In fact, the USD index is down by 0.34 today and gold is basically flat, not responding to what should be a bullish factor.
Naturally, there will be immediate-term moves (like an hourly rally or so) that cause gold to move higher when the USD declines, but over time it could be the case that gold doesn’t really rally. For instance, we could have a situation, in which gold moves higher by $4 when USD declines by 0.4, but then a move $7 lower in gold while the USD goes back up by 0.2. If you repeat this several times, you’ll get lower gold and USD prices even though on an immediate-term basis it will seem like gold is responding to USD’s moves.
That’s more or less what we saw. Gold was reacting to USD’s very small movements, but overall it didn’t really react. Let’s take a closer look at both: gold and the USD for details.
Gold vs. the USD Index
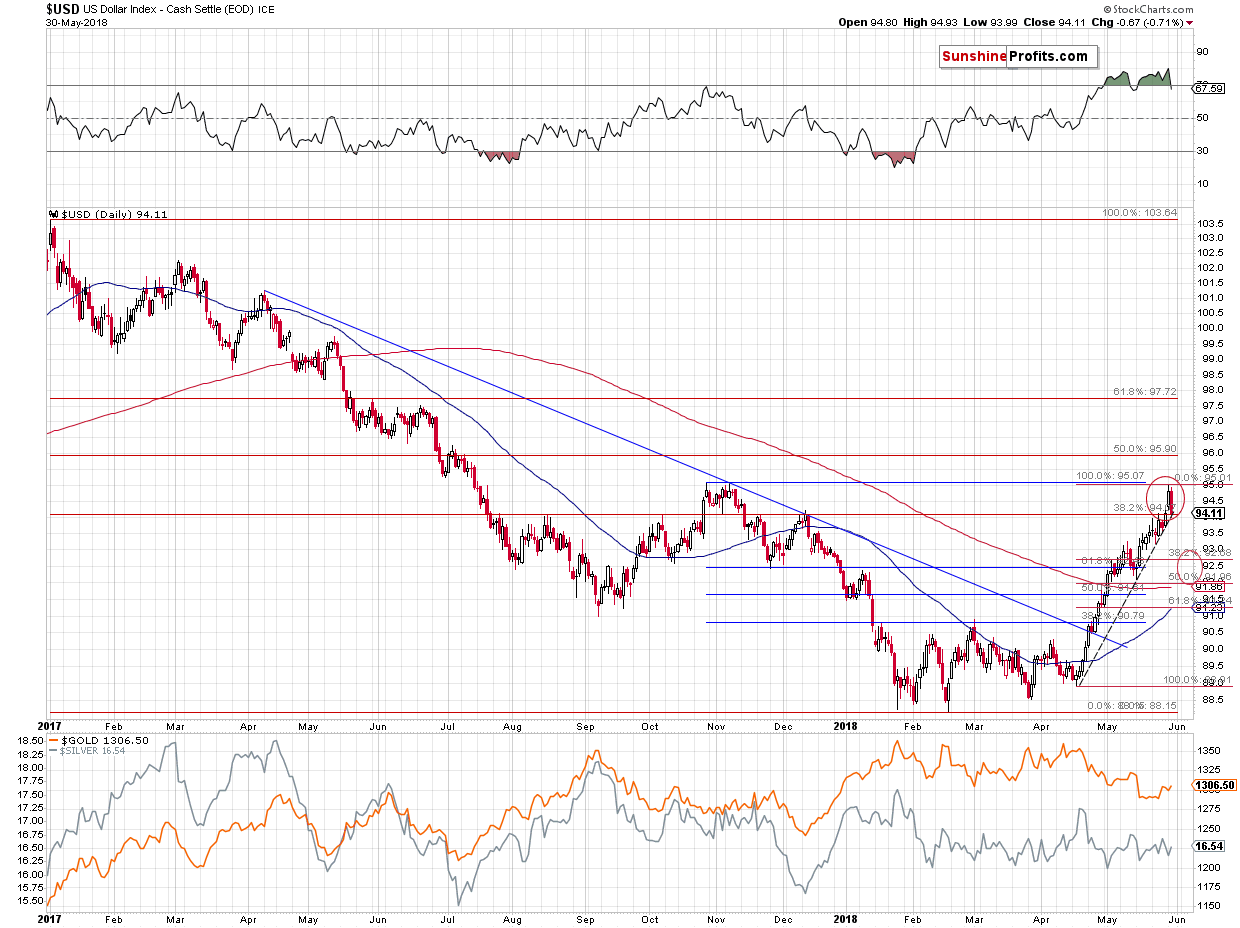
The USD Index declined to 94.11 in a rather sharp manner, stopping at the rising support line. So far the decline is analogous to what we saw earlier this month and RSI’s reaction is also alike.
Let’s look at gold’s reaction.
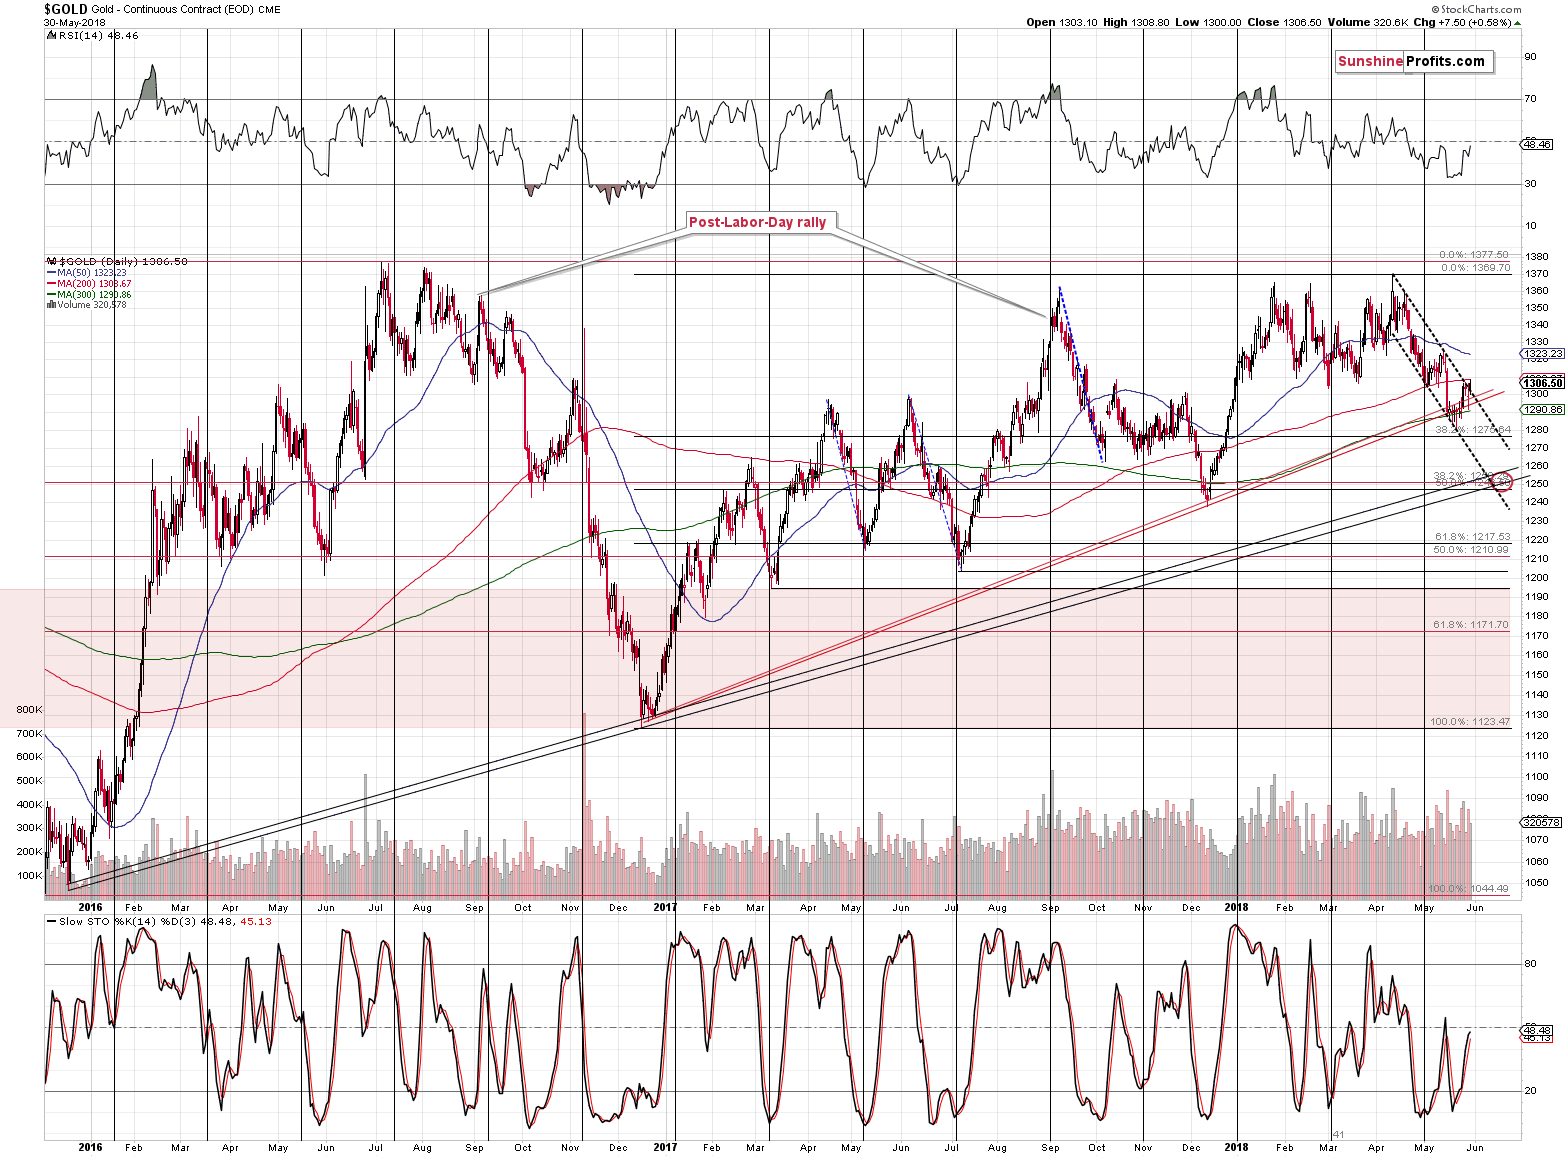
On the above chart it looks like gold actually showed some strength by moving $7.50 higher, but that seems to have been just a glitch in the data processing.
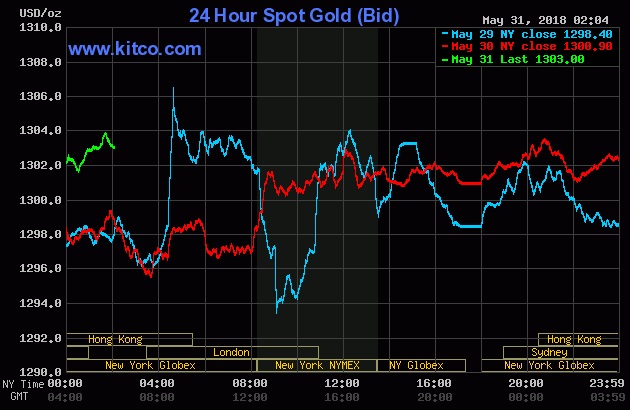
The intraday gold chart reveals that gold moved back and forth within the extremes of the previous session and it ended only about $2 higher. Comparing to a 0.67 decline in the USD Index, it’s truly next to nothing.
And if gold is not willing to react to USD’s weakness then it shouldn’t change much if the USD Index keeps on correcting for a few days.
Why just a few days?
Because the current upswing is very similar to what we saw in 2008, 2009-2010, and in 2014-2015 and in all these cases, the corrections were rather quick. They were not very significant either. The late2008 decline is an exception, but it was preceded by an extremely sharp upswing and thus it’s not that surprising that we had seen it.
The most recent analogy to a given price move is usually most informative, as the world in which both price moves are taking place is most similar (less changed since 2014 than since 2008). The late-2014 pullback was very brief, it took form of a verification of the breakout above the previous highs. The rally that preceded the pullback was also bigger than what we saw so far this year. We marked the previous move with a thin, purple line and we copied it into the current situation. If the early part of the big rally is to be similar, then we could see a rally to 97 or so, before the bigger pullback starts.
In other words, we may have a very tiny decline in the USD at this time and something bigger (yet still relatively small) once the USD moves closer to 97.
If (and that’s a big if) the USDX does indeed decline more from here and confirms the breakdown below the rising short-term support line (seen on the first USD chart), then the short-term downside target will be between 92 and 92.7.
Does this mean that gold could soar shortly? Not really – gold just showed that it doesn’t have to rally if USD declines and thus if USD keeps declining, gold’s reaction could continue to be muted.
It seems that the only thing that the above will do is to delay the start of the next big move for a few days.
Why just a few days?
Silver’s Upcoming Reversal
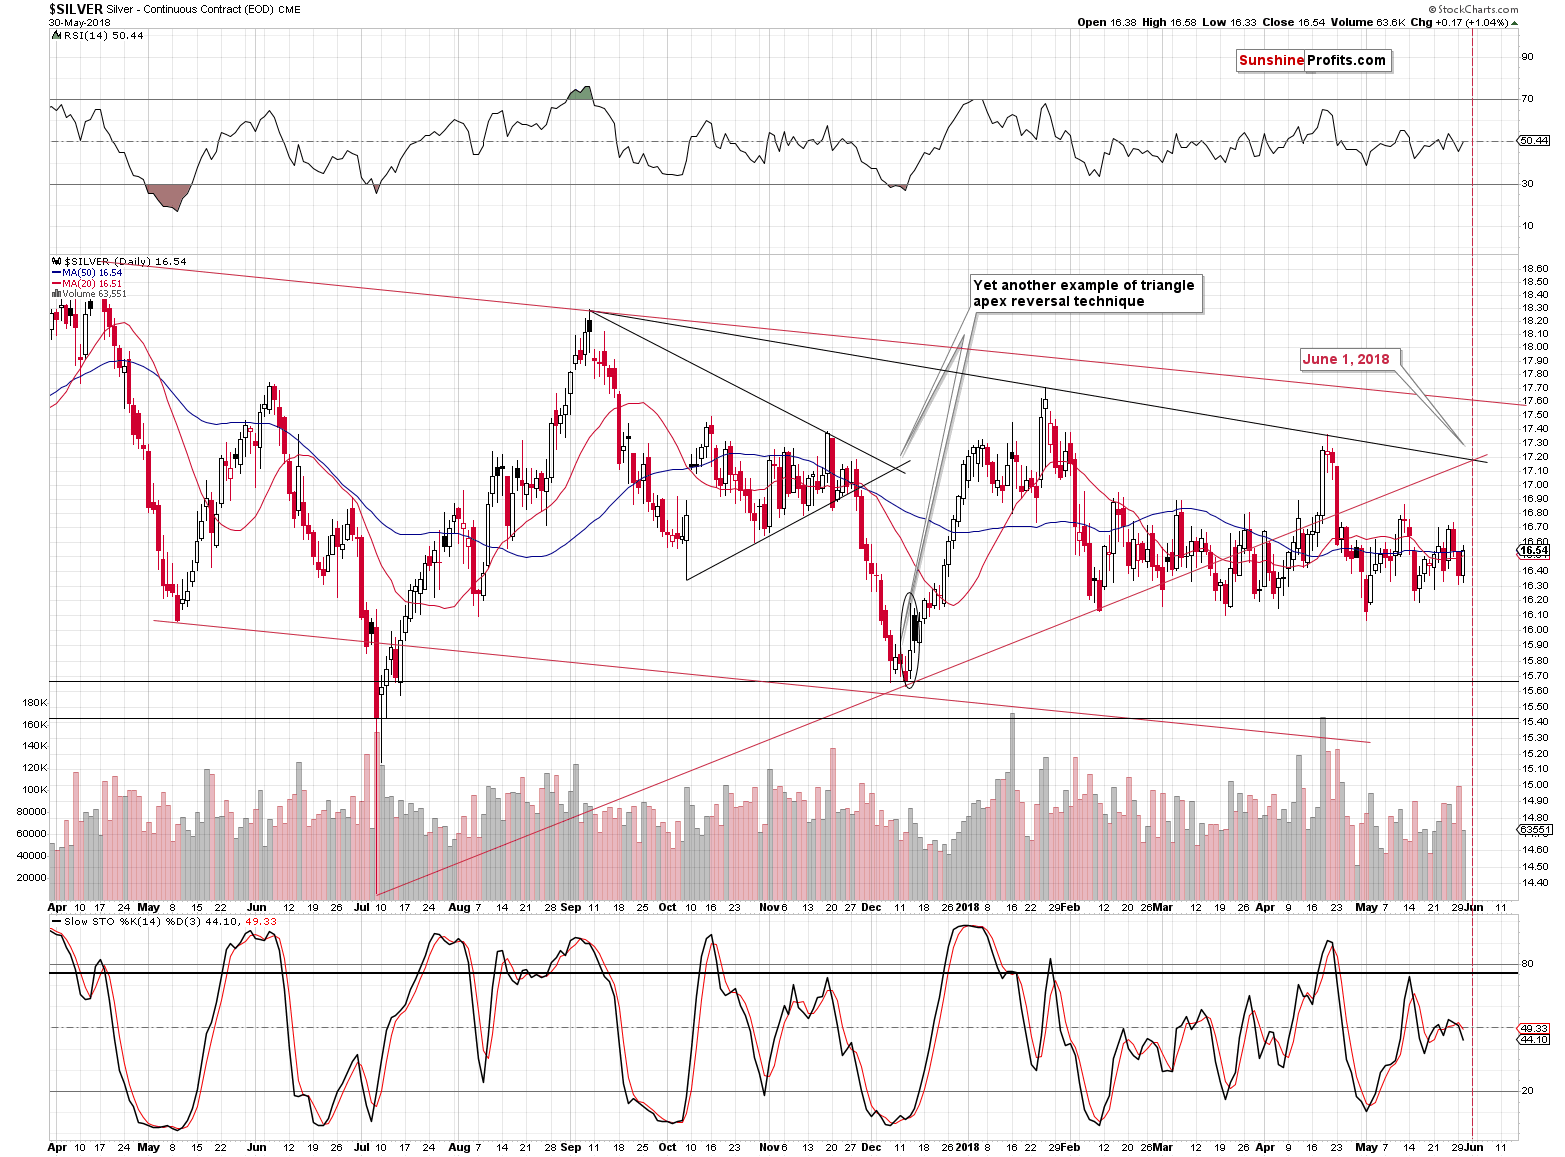
In yesterday’s alert, we wrote the following:
Silver’s back and forth movement around the $16.50 level continues. We could see some action shortly based on the apex-based turning point. Precisely, we’re likely to see some kind of reversal on June the 1st (Friday) or very close to it. Will that be a bottom or a top? Before this week, it was very likely that it will be a bottom after a bigger decline. However, since PMs moved higher on geopolitical events, it could be the case that they will stay afloat for a few more days and decline in early June.
On the other hand silver just declined on volume that was biggest this month, which seems to confirm the bearish outlook for the near term. Overall, it currently seems best to focus on a bigger move instead of trying to time the daily ones.
We know it’s tiring to watch the markets move back and forth, but knowing that periods of very low volatility often precede the greatest volatility makes the waiting and paying attention to the seemingly boring market worth it.
The above clearly remains up-to-date. Unless we keep seeing new (!) bullish news, precious metals prices are likely to turn south. Most likely gold would have already been trading at $1,250 or much lower if it wasn’t for the new geopolitical risks.
While we’re at it, we would like to explain how the main sentiment-driven stage, technical factors, and news relate to each other.
Sentiment, Technicals, and News
The fundamentals and sentiment drive the big moves. The precious metals market is likely to move much lower in order to form a true bottom based on the latter. The true bottom was most likely not formed in 2015, because back then gold investors were predicting higher gold prices (there were surveys) instead of running for the hills and writing hateful comments toward the metals. That’s what the true long-term bottom should look like and that wasn’t the case. Therefore, the overall trend remains down.
The long-term technical factors can confirm or invalidate the above if we have enough of them in place. After all, everyone can be wrong, and looking at the long-term technical is a way of detecting that error. At this time, the long-term technical factors support lower PM prices in the following months.
The short-term technical factors like cycles and apex-based reversals are pointing to the likely way in which the market is going to move in tune with its bigger trend.
The news are the factors that disrupt the above patterns in a more or less random way. The more short-term trend / development, the easier it is to disrupt it. Sometimes the technical signal doesn’t work at all in light of a given piece of news, sometimes it works more profoundly than it should and sometimes, the reaction is simply delayed.
It seems that we currently have the latter type of reaction – gold wants to move lower, but it can’t do so while we have bullish news. It will likely decline anyway, but at a bit later date (perhaps in a few days).
Having said that, let’s take a look at the mining stocks.
Mining Stocks’ Low-volume Rally
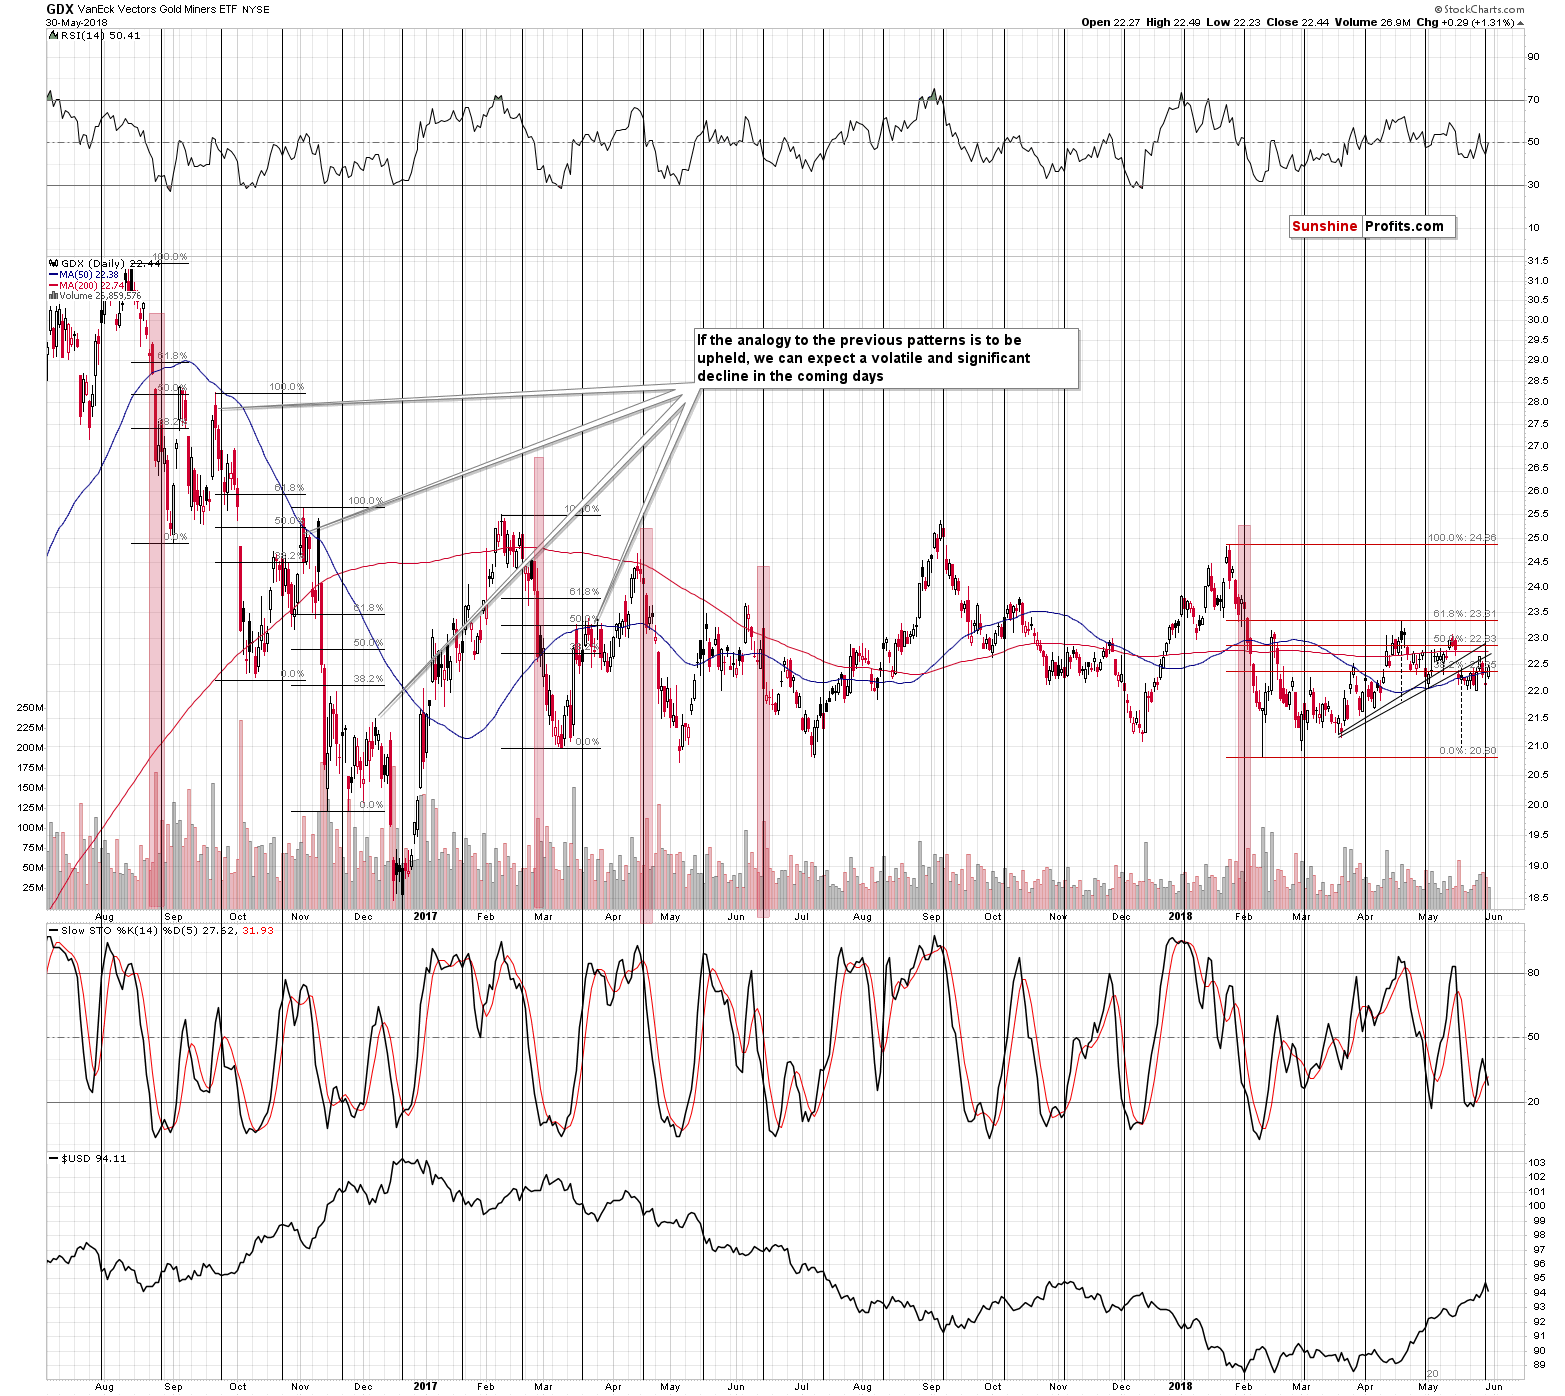
In yesterday’s alert, we wrote the following:
The volume on which GDX declined last Friday was higher than the one on which it had rallied last Thursday, which means that the overall implications of that session were bearish. The true move appears to be down and the correction was to the upside. Yesterday’s session definitely confirms it, as miners declined to the previous May lows even though gold is still close to its last week’s highs.
The volume on which GDX moved higher yesterday was much lower than what we saw during the previous two days when GDX had declined. This emphasizes that the real direction in which the market wants to move is down and that upswings are just temporary pauses.
Summary
Summing up, the USD Index seems to have formed the short-term top, and since gold and silver are not responding strongly, USD’s pullback (if it continues at all) is not a major threat to gold’s decline. While we may see higher PM prices in the very short term, it doesn’t seem that the rally would be anything to call home about. In light of multiple medium-term bearish factors and the likelihood that the pullback in the USD may be over or very close to being over, it seems best to keep the speculative short positions intact.
As always, we will keep you – our subscribers – informed.
To summarize:
Trading capital (supplementary part of the portfolio; our opinion): Full short positions (200% of the full position) in gold, silver and mining stocks are justified from the risk/reward perspective with the following stop-loss orders and initial target price levels:
- Gold: initial target price: $1,251; stop-loss: $1,382; initial target price for the DGLD ETN: $48.88; stop-loss for the DGLD ETN $37.48
- Silver: initial target price: $15.73; stop-loss: $18.06; initial target price for the DSLV ETN: $27.58; stop-loss for the DSLV ETN $19.17
- Mining stocks (price levels for the GDX ETF): initial target price: $21.03; stop-loss: $23.54; initial target price for the DUST ETF: $28.88; stop-loss for the DUST ETF $21.16
In case one wants to bet on junior mining stocks' prices (we do not suggest doing so – we think senior mining stocks are more predictable in the case of short-term trades – but if one wants to do it anyway, we provide the details), here are the stop-loss details and initial target prices:
- GDXJ ETF: initial target price: $30.62; stop-loss: $36.14
- JDST ETF: initial target price: $59.68 stop-loss: $40.86
Long-term capital (core part of the portfolio; our opinion): No positions (in other words: cash)
Insurance capital (core part of the portfolio; our opinion): Full position
Important Details for New Subscribers
Whether you already subscribed or not, we encourage you to find out how to make the most of our alerts and read our replies to the most common alert-and-gold-trading-related-questions.
Please note that the in the trading section we describe the situation for the day that the alert is posted. In other words, it we are writing about a speculative position, it means that it is up-to-date on the day it was posted. We are also featuring the initial target prices, so that you can decide whether keeping a position on a given day is something that is in tune with your approach (some moves are too small for medium-term traders and some might appear too big for day-traders).
Plus, you might want to read why our stop-loss orders are usually relatively far from the current price.
Please note that a full position doesn’t mean using all of the capital for a given trade. You will find details on our thoughts on gold portfolio structuring in the Key Insights section on our website.
As a reminder – “initial target price” means exactly that – an “initial” one, it’s not a price level at which we suggest closing positions. If this becomes the case (like it did in the previous trade) we will refer to these levels as levels of exit orders (exactly as we’ve done previously). Stop-loss levels, however, are naturally not “initial”, but something that, in our opinion, might be entered as an order.
Since it is impossible to synchronize target prices and stop-loss levels for all the ETFs and ETNs with the main markets that we provide these levels for (gold, silver and mining stocks – the GDX ETF), the stop-loss levels and target prices for other ETNs and ETF (among other: UGLD, DGLD, USLV, DSLV, NUGT, DUST, JNUG, JDST) are provided as supplementary, and not as “final”. This means that if a stop-loss or a target level is reached for any of the “additional instruments” (DGLD for instance), but not for the “main instrument” (gold in this case), we will view positions in both gold and DGLD as still open and the stop-loss for DGLD would have to be moved lower. On the other hand, if gold moves to a stop-loss level but DGLD doesn’t, then we will view both positions (in gold and DGLD) as closed. In other words, since it’s not possible to be 100% certain that each related instrument moves to a given level when the underlying instrument does, we can’t provide levels that would be binding. The levels that we do provide are our best estimate of the levels that will correspond to the levels in the underlying assets, but it will be the underlying assets that one will need to focus on regarding the signs pointing to closing a given position or keeping it open. We might adjust the levels in the “additional instruments” without adjusting the levels in the “main instruments”, which will simply mean that we have improved our estimation of these levels, not that we changed our outlook on the markets. We are already working on a tool that would update these levels on a daily basis for the most popular ETFs, ETNs and individual mining stocks.
Our preferred ways to invest in and to trade gold along with the reasoning can be found in the how to buy gold section. Additionally, our preferred ETFs and ETNs can be found in our Gold & Silver ETF Ranking.
As a reminder, Gold & Silver Trading Alerts are posted before or on each trading day (we usually post them before the opening bell, but we don't promise doing that each day). If there's anything urgent, we will send you an additional small alert before posting the main one.
=====
Latest Free Trading Alerts:
The Italian title of today’s Gold News Monitor means “goodbye gold, dollar is strong”. Is that really true? Let’s analyze the implications of the recent Italian turmoil for the gold market.
Arrivederci Gold, Forte Dollaro
=====
Hand-picked precious-metals-related links:
PRECIOUS-Gold prices rise on weaker dollar, trade tension
=====
In other news:
U.S. to slap tariffs on steel, aluminum from EU on Thursday: sources
Spanish PM's future in balance as no-confidence debate starts
Euro-Area Inflation Accelerates to Fastest in More Than a Year
Soros View on Global Crisis Is ‘Ridiculous,’ Morgan Stanley CEO Says
As U.S. Jobs Go Begging, Forget Those Monthly Gains of 200,000
U.S., North Korea enter second day of nuclear talks
Italy awaits decision on last-ditch deal to avoid snap elections
=====
Thank you.
Sincerely,
Przemyslaw Radomski, CFA
Founder, Editor-in-chief, Gold & Silver Fund Manager
Gold & Silver Trading Alerts
Forex Trading Alerts
Oil Investment Updates
Oil Trading Alerts

