

Briefly: In our opinion, full (150% of the regular full position) speculative short positions in gold, silver and mining stocks are justified from the risk/reward perspective at the moment of publishing this alert.
In our Thursday’s alert, we discussed the downside potential of the silver market and we argued that the bearish analogy to the previous cases in silver is very likely intact, but it hasn’t played out yet due to the declining USD. Interestingly, it doesn’t seem that a rally in the latter is necessary for the decline to really start – it seems that all that is required is that the USD stops declining. On Friday, the USD Index moved sharply higher and silver responded with a big decline, just as we had expected. What’s next?
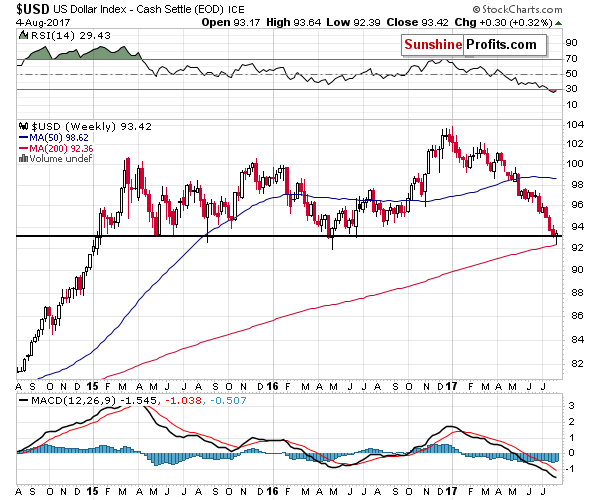
Let’s start with the USD Index chart (chart courtesy of http://stockcharts.com).
In the last Monday’s alert, we wrote the following:
The USD Index closed the week in tune with the 2015 and 2016 bottoms. Both previous bottoms took place close to the middle of the year, so the timing for the current move lower also supports that reversal theory.
The USD Index reached the previous weekly bottoms and it suggests that the bottom is in – in weekly terms. In other words, this week’s closing price is very likely to be higher than 93.11. What the above does not say is how the USD Index will perform before the end of the week – even if we saw a temporary downswing to about 92 and then a big comeback (just like the one we saw in 2016 after the weekly bottom), it would still not invalidate the bullish implications or the analogy in general.
The situation developed exactly as described above – there was an intra-week move lower, but the USD Index reversed and after all it ended the week higher. At this time, the reversal theory is even more credible and the fact that the USD Index almost touched its 200-week moving average and that it formed a weekly reversal candlestick only add to its credibility. It appears that we will see higher USD Index values in the coming weeks.
Naturally, the implications for the precious metals market are bearish. Quoting our Thursday’s alert:
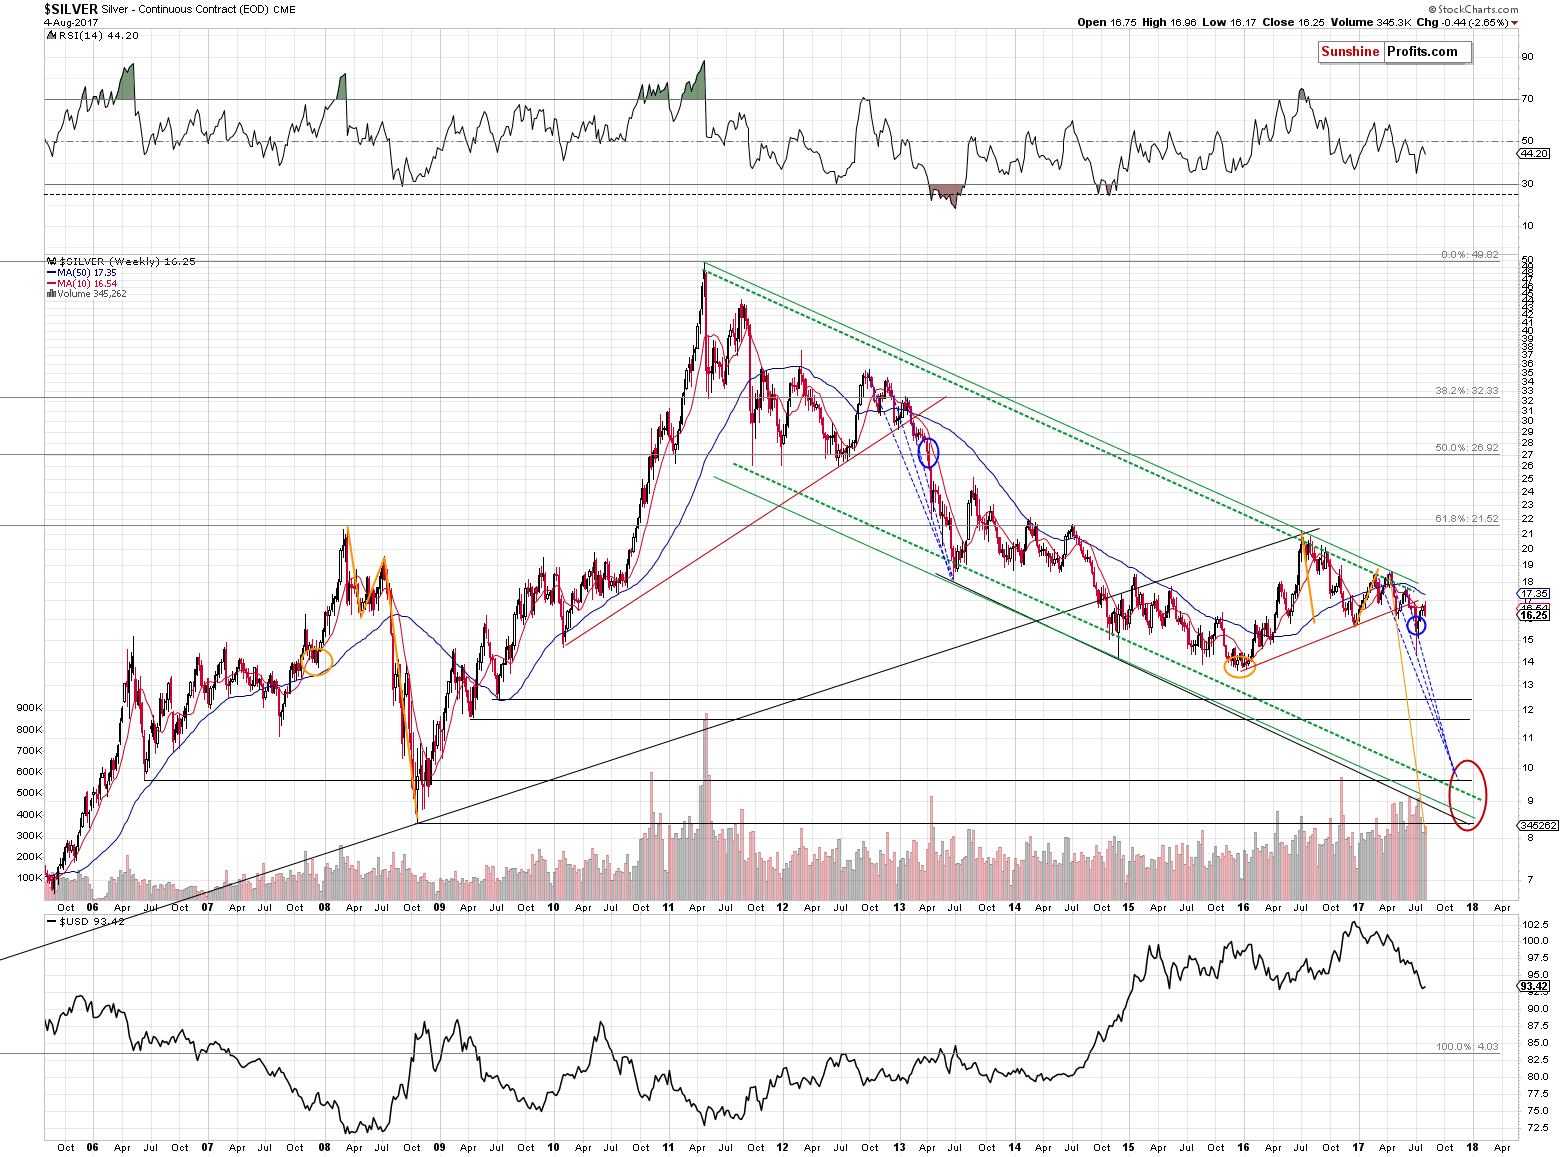
On a daily basis, silver may seem to respond to the action in the USD Index, but from the bigger point of view, the link is much more bearish – the USD Index is about 10 index points lower than it was at the beginning of this year and silver is more or less at the same price level (more or less the same is the case with silver stocks). If silver was able to ignore such a huge slide in the USD, then it’s very likely to respond to the USD’s rebound. In fact, it seems that even a stop in the USD’s decline would be enough to trigger a decline in silver.
Moving back to the question in the title of today’s analysis – was the bearish analogy in silver invalidated? No, silver visibly “wants to” decline, just as it’s likely to based on the analogies that we described previously, however, it is not able to do so given the continuously declining USD Index. The USD Index just reached very important support levels, so the end of the decline could be near. This means that silver could be very close to unfolding the bearish potential that it’s been holding for many weeks.
Given the sizable reversal in the USD and other bullish points regarding it that we made above, it does really seem that the end of the decline was already seen and that higher prices will follow. As discussed above, this is very bearish for silver and the rest of the precious metals market.
Silver’s decline is not really surprising given the proximity of its turning point. We previously wrote that silver’s turning point was just around the corner and in all three previous cases, the major top (followed by a sharp decline) had been seen right before the turning point and thus consequently, seeing a top shortly appeared very likely.
It seems that we have seen one, and the huge volume along with the sell signal from the Stochastic indicator confirm it.
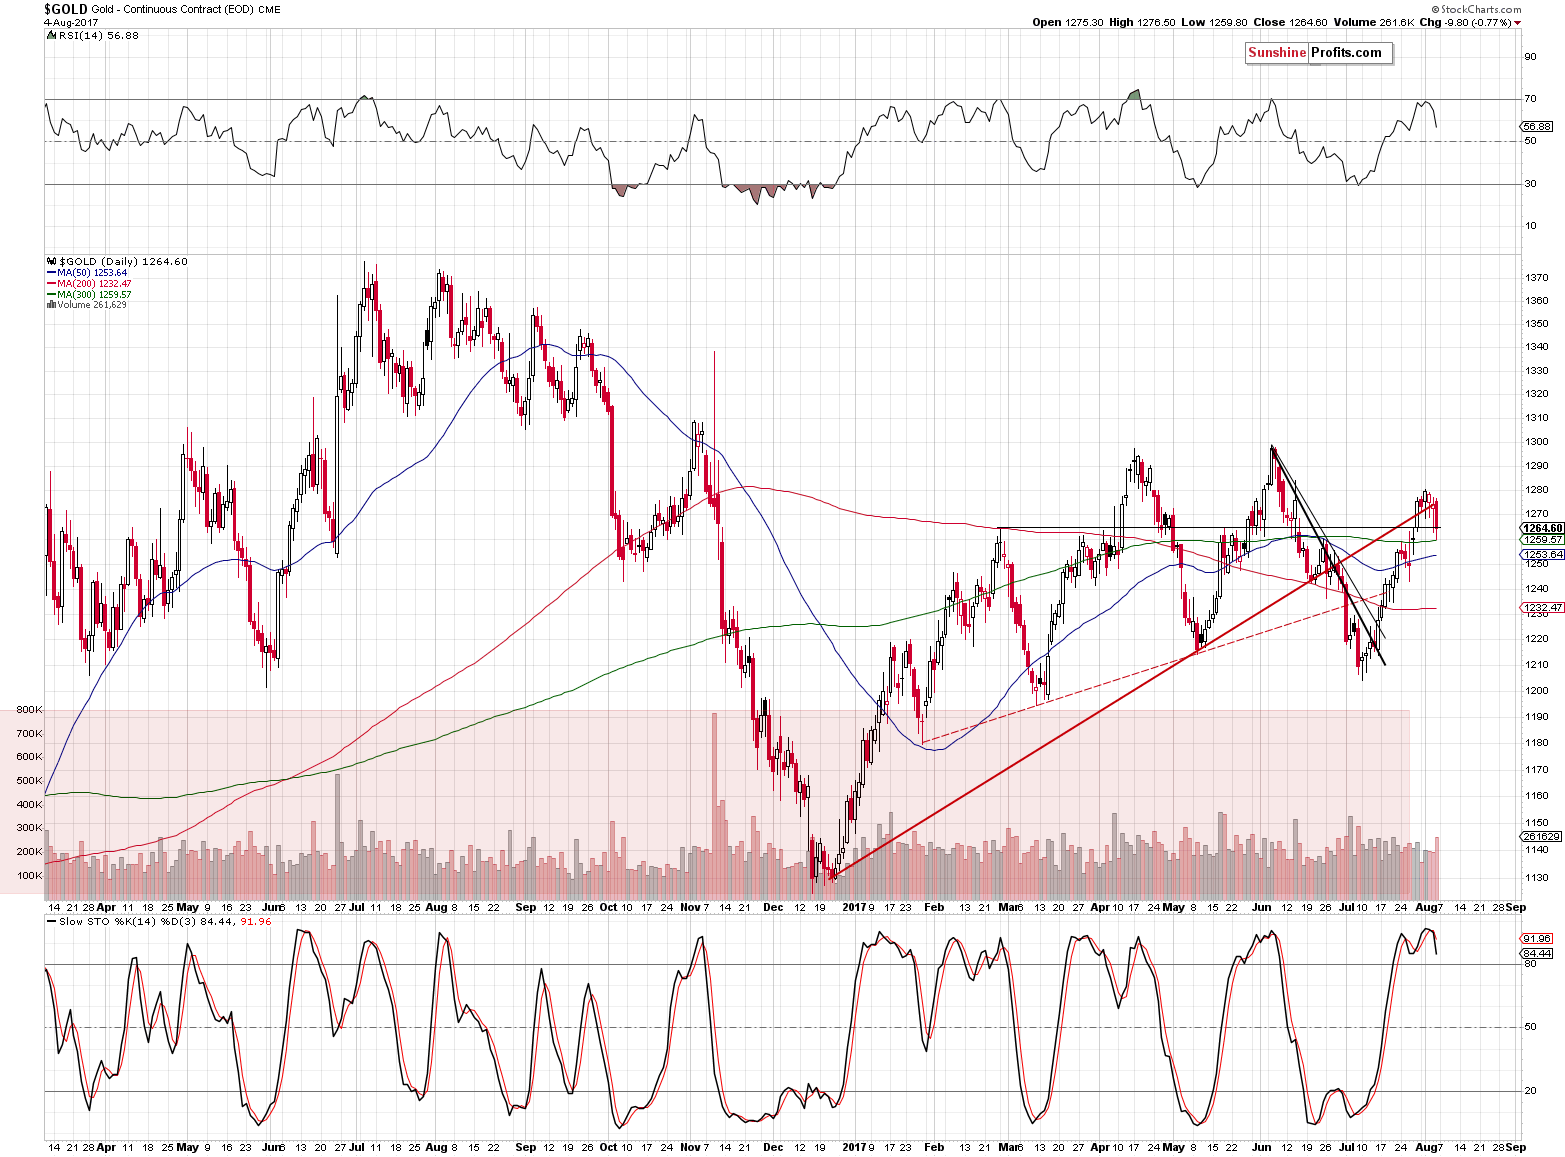
Gold moved lower on significant volume after we saw the RSI very close to the 70 level and we also saw a sell signal from the Stochastic indicator. Moreover, the small breakout above the rising red support/resistance line was invalidated and the same goes for the move above the February high (the price of gold is $1,257 at the moment of writing these words). It seems that the top in gold is in.
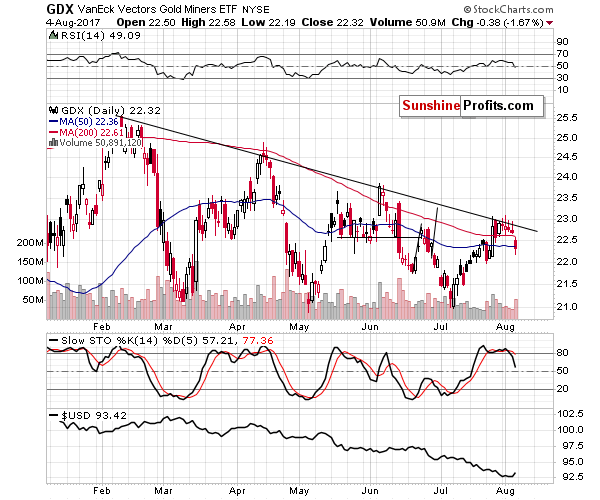
Mining stocks moved lower as well, moving back below their 50-day moving average. This level served as support quite a few times, so a day or two of sideways trading before the decline resumes would be quite natural here.
Please note how bad miners performed given the decline in the USD Index (lower part of the chart). The GDX ETF trades below the levels at which it traded in the second half of March, while the USD Index is about 7 index points lower. Silver is not the only part of the precious metals market that seems to be waiting for a rally in the USD or at least the end of the decline.
Summing up, the situation developed in tune with our expectations regarding the movement in the USD Index and in the case of silver’s reaction. Still, it seems that it’s just the beginning of a much bigger move and that the most interesting and profitable part of the move is still ahead. It’s quite likely that the current situation is the beginning of the end of the long decline in the precious metals market that started several years ago.
As always, we will keep you – our subscribers – informed.
To summarize:
Trading capital (supplementary part of the portfolio; our opinion): Short positions (150% of the full position) in gold, silver and mining stocks are justified from the risk/reward perspective with the following stop-loss orders and initial target price levels / profit-take orders:
- Gold: initial target price level: $1,063; stop-loss: $1,317; initial target price for the DGLD ETN: $81.88; stop-loss for the DGLD ETN $44.57
- Silver: initial target price: $13.12; stop-loss: $19.22; initial target price for the DSLV ETN: $46.18; stop-loss for the DSLV ETN $17.93
- Mining stocks (price levels for the GDX ETF): initial target price: $9.34; stop-loss: $26.34; initial target price for the DUST ETF: $143.56; stop-loss for the DUST ETF $21.37
In case one wants to bet on junior mining stocks' prices (we do not suggest doing so – we think senior mining stocks are more predictable in the case of short-term trades – if one wants to do it anyway, we provide the details), here are the stop-loss details and initial target prices:
- GDXJ ETF: initial target price: $14.13; stop-loss: $45.31
- JDST ETF: initial target price: $417.04; stop-loss: $43.12
Long-term capital (core part of the portfolio; our opinion): No positions (in other words: cash)
Insurance capital (core part of the portfolio; our opinion): Full position
Important Details for New Subscribers
Whether you already subscribed or not, we encourage you to find out how to make the most of our alerts and read our replies to the most common alert-and-gold-trading-related-questions.
Please note that the in the trading section we describe the situation for the day that the alert is posted. In other words, it we are writing about a speculative position, it means that it is up-to-date on the day it was posted. We are also featuring the initial target prices, so that you can decide whether keeping a position on a given day is something that is in tune with your approach (some moves are too small for medium-term traders and some might appear too big for day-traders).
Plus, you might want to read why our stop-loss orders are usually relatively far from the current price.
Please note that a full position doesn’t mean using all of the capital for a given trade. You will find details on our thoughts on gold portfolio structuring in the Key Insights section on our website.
As a reminder – “initial target price” means exactly that – an “initial” one, it’s not a price level at which we suggest closing positions. If this becomes the case (like it did in the previous trade) we will refer to these levels as levels of exit orders (exactly as we’ve done previously). Stop-loss levels, however, are naturally not “initial”, but something that, in our opinion, might be entered as an order.
Since it is impossible to synchronize target prices and stop-loss levels for all the ETFs and ETNs with the main markets that we provide these levels for (gold, silver and mining stocks – the GDX ETF), the stop-loss levels and target prices for other ETNs and ETF (among other: UGLD, DGLD, USLV, DSLV, NUGT, DUST, JNUG, JDST) are provided as supplementary, and not as “final”. This means that if a stop-loss or a target level is reached for any of the “additional instruments” (DGLD for instance), but not for the “main instrument” (gold in this case), we will view positions in both gold and DGLD as still open and the stop-loss for DGLD would have to be moved lower. On the other hand, if gold moves to a stop-loss level but DGLD doesn’t, then we will view both positions (in gold and DGLD) as closed. In other words, since it’s not possible to be 100% certain that each related instrument moves to a given level when the underlying instrument does, we can’t provide levels that would be binding. The levels that we do provide are our best estimate of the levels that will correspond to the levels in the underlying assets, but it will be the underlying assets that one will need to focus on regarding the signs pointing to closing a given position or keeping it open. We might adjust the levels in the “additional instruments” without adjusting the levels in the “main instruments”, which will simply mean that we have improved our estimation of these levels, not that we changed our outlook on the markets. We are already working on a tool that would update these levels on a daily basis for the most popular ETFs, ETNs and individual mining stocks.
Our preferred ways to invest in and to trade gold along with the reasoning can be found in the how to buy gold section. Additionally, our preferred ETFs and ETNs can be found in our Gold & Silver ETF Ranking.
As a reminder, Gold & Silver Trading Alerts are posted before or on each trading day (we usually post them before the opening bell, but we don't promise doing that each day). If there's anything urgent, we will send you an additional small alert before posting the main one.
=====
Latest Free Trading Alerts:
The U.S. economy added 209,000 jobs in July. What does it mean for the gold market?
S&P 500 index gained 0.2% on Friday, as investors reacted to monthly jobs data release. Will uptrend continue? Or is this some topping pattern before downward reversal?
Mixed Expectations As Stocks Trade Along Record Highs
On Friday, light crude moved higher and gained 1.12%, which resulted in a comeback above the previously-broken 200-day moving average. Is it enough to encourage oil bulls to act in the coming week?
Crude Oil - Important Levels to Watch
=====
Hand-picked precious-metals-related links:
PRECIOUS-Gold steady as dollar holds gains made after U.S. jobs data
FinMin rejects Commerce Ministry pitch for lower gold import duty
Top gold fund SPDR marks steepest monthly fall in more than 4 years
Randgold reports 53% rise in H1 profit, cash pile mounts
Lonmin to sell surplus platinum capacity to raise cash
Goldcorp closing 107-year-old Dome mine
South Africa’s mines minister withdraws plan to suspend rights
=====
In other news:
Stocks reach new peak in world full of surprises
BlackRock, Vanguard Say Bond Market's Got This Trade All Wrong
Euro Shrugs Off German Data to Rise; Crude Drops: Markets Wrap
Electric Car Boom Drives Rush to Mining's $90 Billion Hub
This New Bitcoin Cash Has Already Skyrocketed in Price
Bitcoin Soars to Record as Buyers Look Beyond Miners' Split
=====
Thank you.
Sincerely,
Przemyslaw Radomski, CFA
Founder, Editor-in-chief, Gold & Silver Fund Manager
Gold & Silver Trading Alerts
Forex Trading Alerts
Oil Investment Updates
Oil Trading Alerts

