

Briefly: in our opinion, full (200% of the regular size of the position) speculative short positions in gold, silver and mining stocks are justified from the risk/reward perspective at the moment of publishing this alert.
We just saw another specific divergence on the precious metals market. Part thereof – silver – visibly rallied once again (especially on an intraday basis), while both key proxies for mining stocks – another important part of the PM sector – HUI Index and GDX ETF, were down. Investors wanting to check what’s really going on are looking at gold for guidance. They aren’t getting any, as gold didn’t really change (which seems bearish compared to silver’s rally), but at the same time, it’s above the declining trend channel, which may appear bullish. What should one make of all this?
The same thing that one made yesterday out of Wednesday’s signals, as what happened yesterday had practically identical implications, but with an additional exclamation mark. Consequently, today’s Alert is going to be a repeat of yesterday’s analysis to a considerable degree. We’ll update you on the changes, but since situation and implications are generally unchanged, most of what we wrote yesterday remains up-to-date.
In short, one should keep in mind what is usually happening after situations in which silver is strongly outperforming, while the rest of the precious metals sector is not doing much. These are usually the final calls to enter short positions as the slide is about to unfold.
Let’s take a closer look at the charts.
Inconsequential Breakout in Gold
In the previous alerts, we wrote the following:
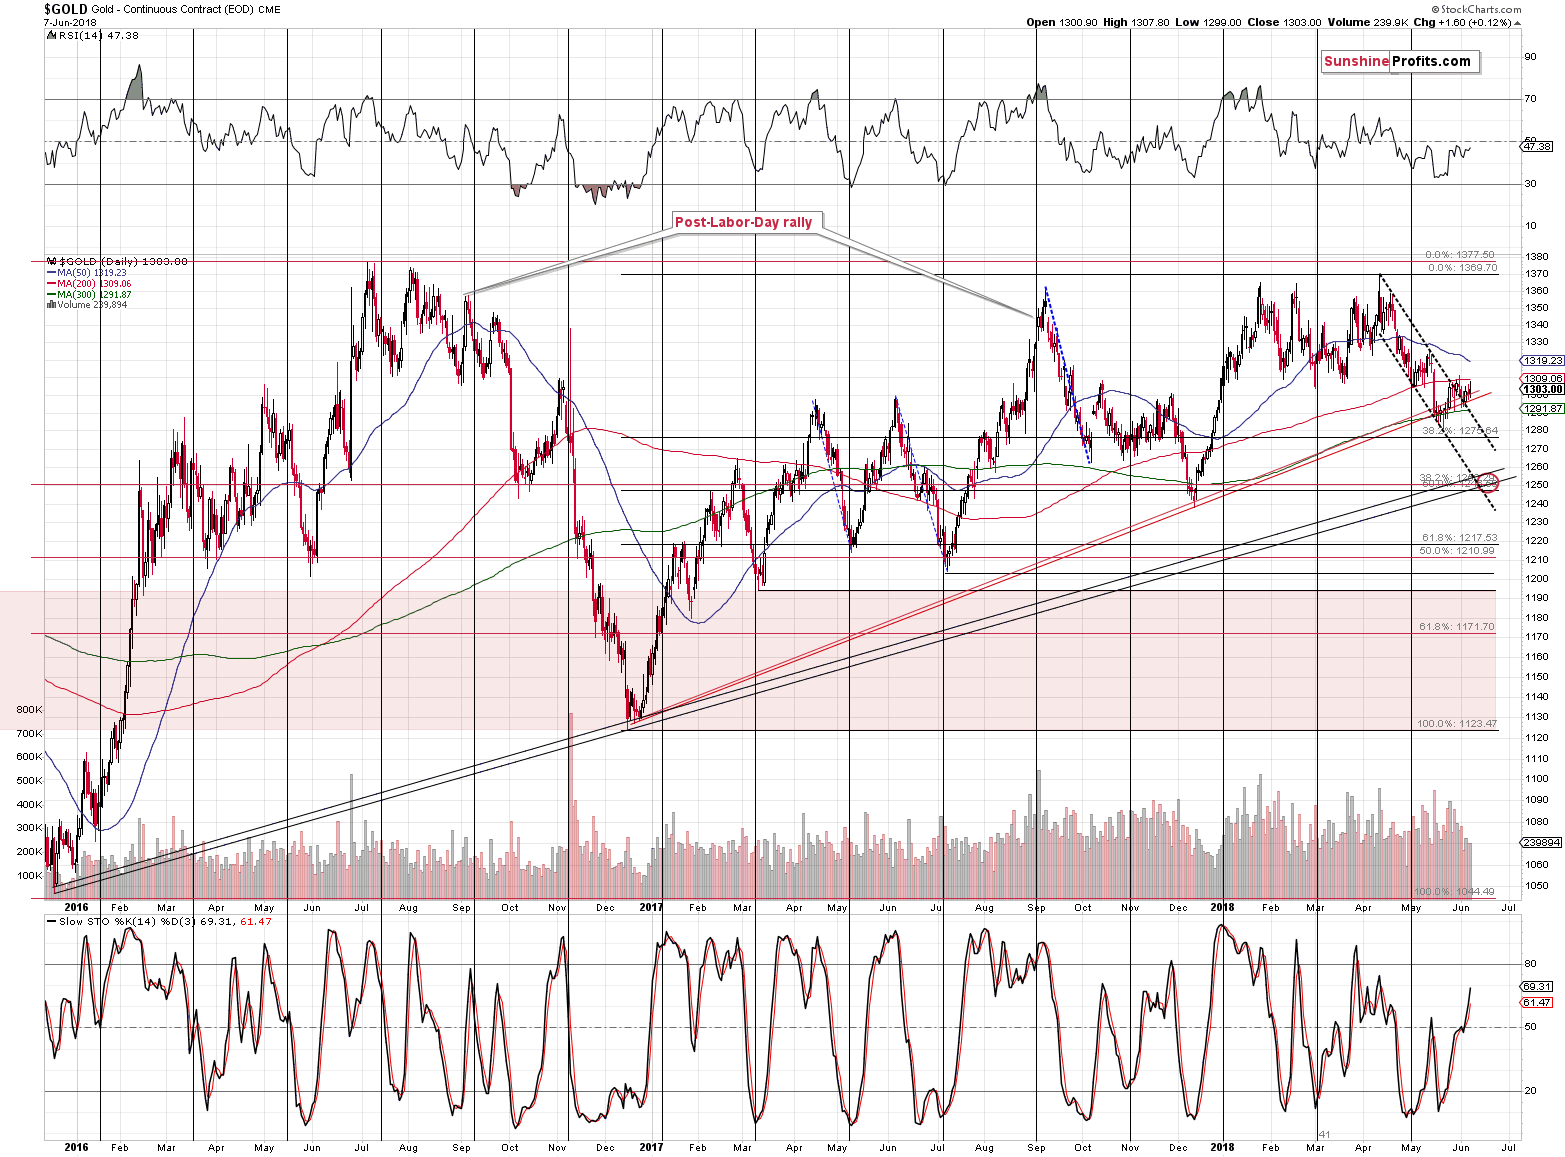
Breakouts need to be confirmed, before they can be viewed as important. If they are not, and are invalidated instead, they become bearish signs. We have just seen an example of this phenomenon in the gold market, and this should make us particularly suspicious to another attempt of gold to move above the declining resistance. This is especially the case since gold moved higher on low volume. Yesterday’s breakout did not represent a fierce battle between bears and bulls that was won by the latter. It was more of a pause during which both sides were hesitating. Consequently, there are no bullish implications of yesterday’s upswing in gold.
Since nothing really happened in gold yesterday, we can say that the above remains up-to-date. Gold is only a bit above the declining trend channel and it didn’t move much above it even when it had a good reason to. After all, the USD Index moved lower yesterday, so gold “should have” used this trigger to rally, if the outlook was really bullish. But it didn’t; and so the breakout is not confirmed so far.
The entire above paragraph applies also to yesterday’s upswing. Gold hasn’t really done anything and that’s bearish in light of USD Index’s decline. The breakout was technically verified by three consecutive daily closes above the resistance line, but in light of gold’s weakness relative to USD, weak volume, miners’ underperformance, and silver’s outperformance, we don’t think one should follow this signal.
Silver’s Not-so-subtle Outperformance
In the previous alerts, we wrote the following about the above and below charts:
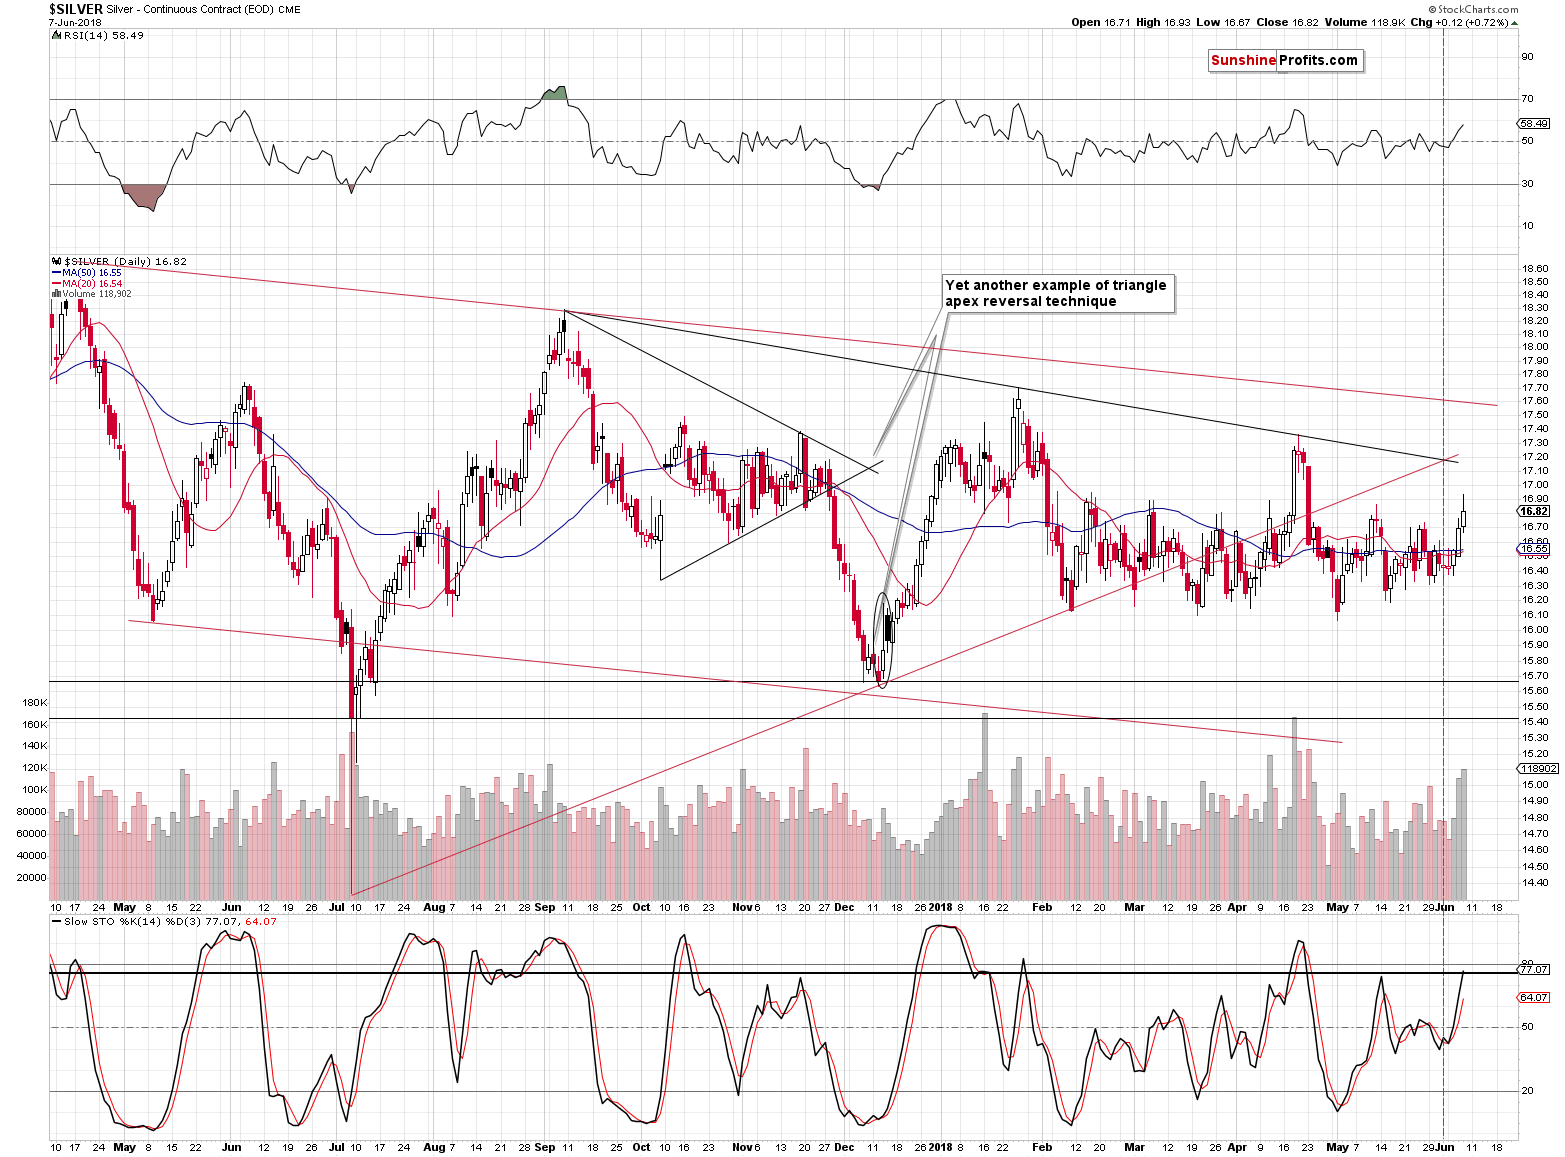
The size of the silver rally doesn’t seem significant at first sight, but the size of the volume in silver suggests that we may have seen something important. It’s not spectacular, but it is big if we compare it to the size of the volume in gold. The yellow metal moved higher on low volume, but what we see above is rather average. Could it be the case that the silver price action is somehow meaningful in relation to gold?
To answer this question, let’s take a look at the chart that features them both at the same time.
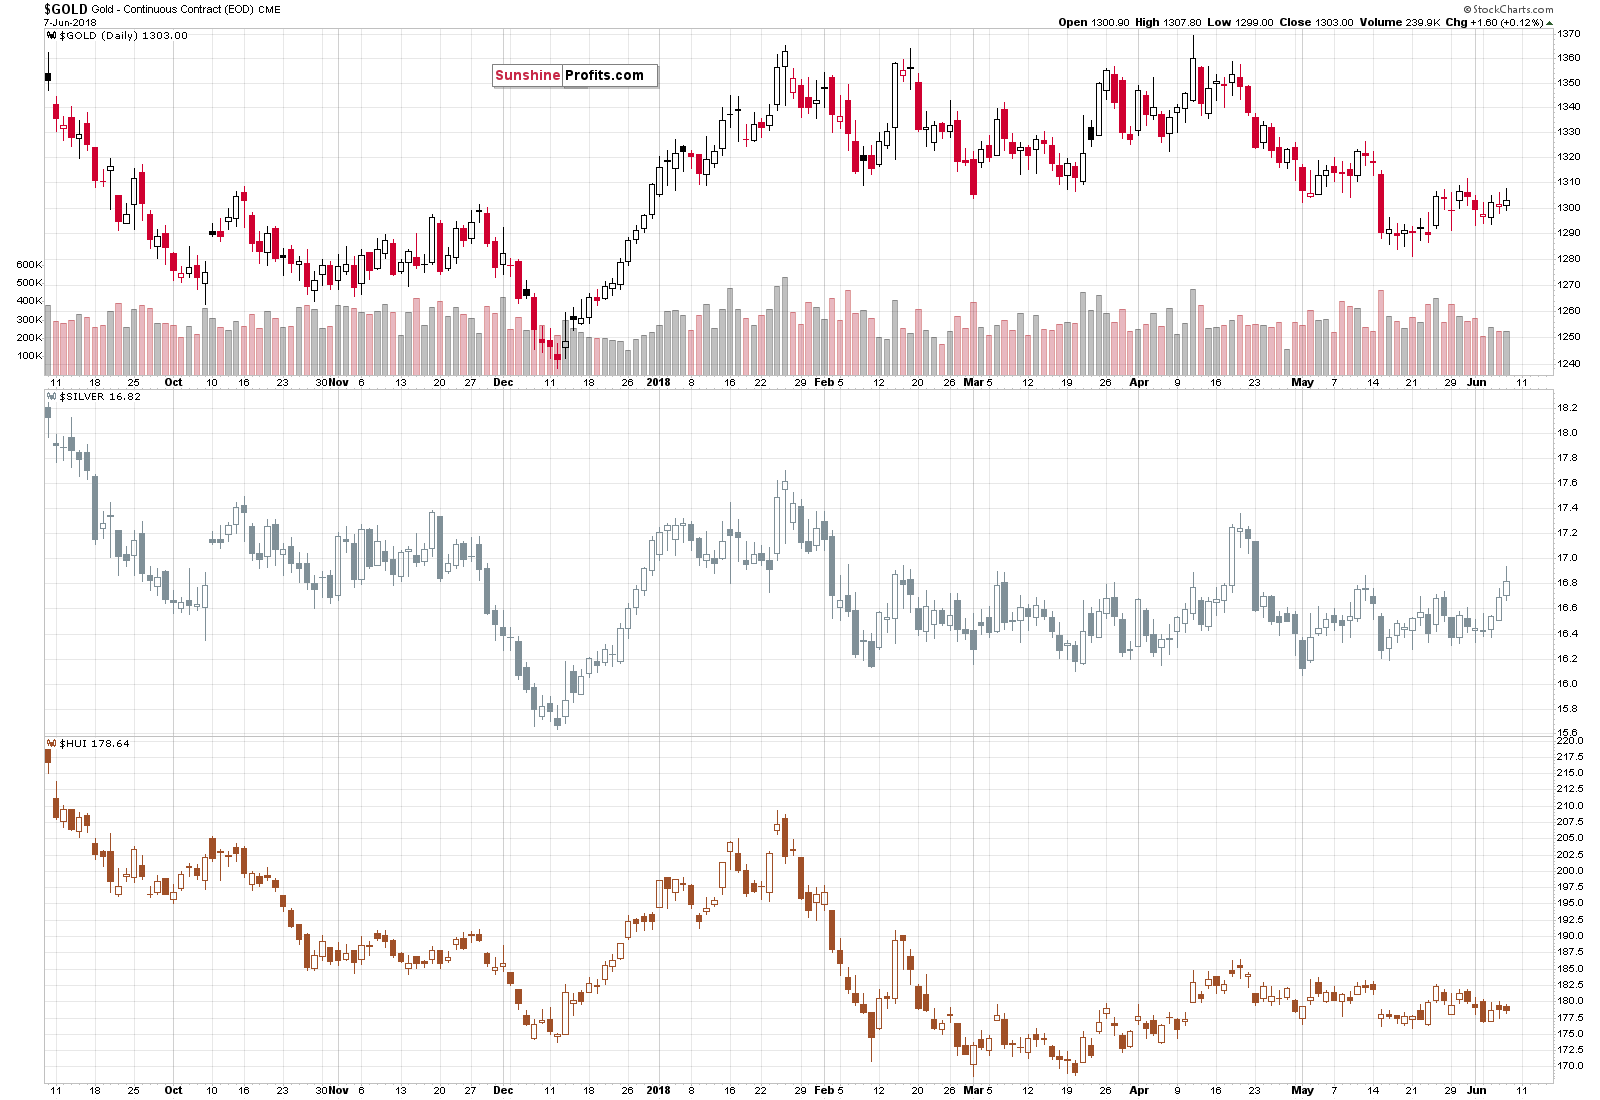
On a day-to-day basis, it may not appear significant, but if we consider the last 5 trading days, we’ll see that gold is lower than it was, gold stocks are lower than there were and that they underperformed gold, whereas silver is more or less where it was before.
This means that silver has indeed outperformed gold, while gold stocks underperformed. The signal is not as clear as if we had seen this kind of outperformance and underperformance on a single day, but it’s definitely meaningful.
As a reminder, silver’s outperformance and mining stocks’ underperformance is something that we usually see right before declines.
Interestingly, we just saw a daily confirmation of the 5-day pattern. It was as clear as it gets. Silver rallied, while gold and miners practically didn’t move. The implications are very bearish for the short term. In fact, as odd as it may sound, they are much more bearish than they were before silver’s rally.
As we’ve often stated, just because a price moved higher, it doesn’t mean that it’s likely to move higher again. This seems to be the most natural way of viewing the market by the beginning investors and traders, but the reality is much more complex. As simple fact that negates the above is that in order to make profits, one needs to buy low and sell high. The price is high after a rally, so based on the above approach alone, one would never be able to sell at or close to a top.
The opposite – viewing rallies as bearish – is only a little better and but it’s still wrong overall. The key is to look at the context and only make a decision whether a move is bullish or bearish, once it’s been properly analyzed.
Moving back to silver, some may say that given the above tendency of the white metal to outperform, silver could rally for much longer and thus we should close the trading positions right away and re-enter them after silver already declines, proving that the top is already in.
This sounds good in theory, but in practice, the sharp upswings are very often followed by even sharper declines and it’s very difficult to get a better price during a decline and so ultimately the above strategy is more likely to decrease profits instead of increasing them.
In short, silver repeated its Wednesday’s rally despite lack of thereof in gold and miners, which further confirms the bearish implications.
If we consider different source of data, we see that silver actually reversed before the end of the day and closed the session only a few cents higher.
Some may say that the above implies that after all there was no outperformance yesterday. Indeed, overall, there was none, but there was clear outperformance during the intraday rally and that’s enough to serve as a confirmation of the previous days’ bearish signals and further emphasis of their importance.
Since silver actually reversed yesterday, it should be particularly useful to look at the volume levels, as big volume levels confirm the bearish nature of a reversal, while weak volume invalidates it. As you have seen on the previous chart, the silver volume was huge. The last time when we saw silver rally on such significant volume, was in late April 2018. Yes, that was practically right at the top (it was top in terms of daily closes, but the price moved a bit higher on an intraday basis on the following day). Big slide followed shortly, so the implications here are also very bearish.
But maybe that was just a coincidence? What about other big-volume daily rallies?
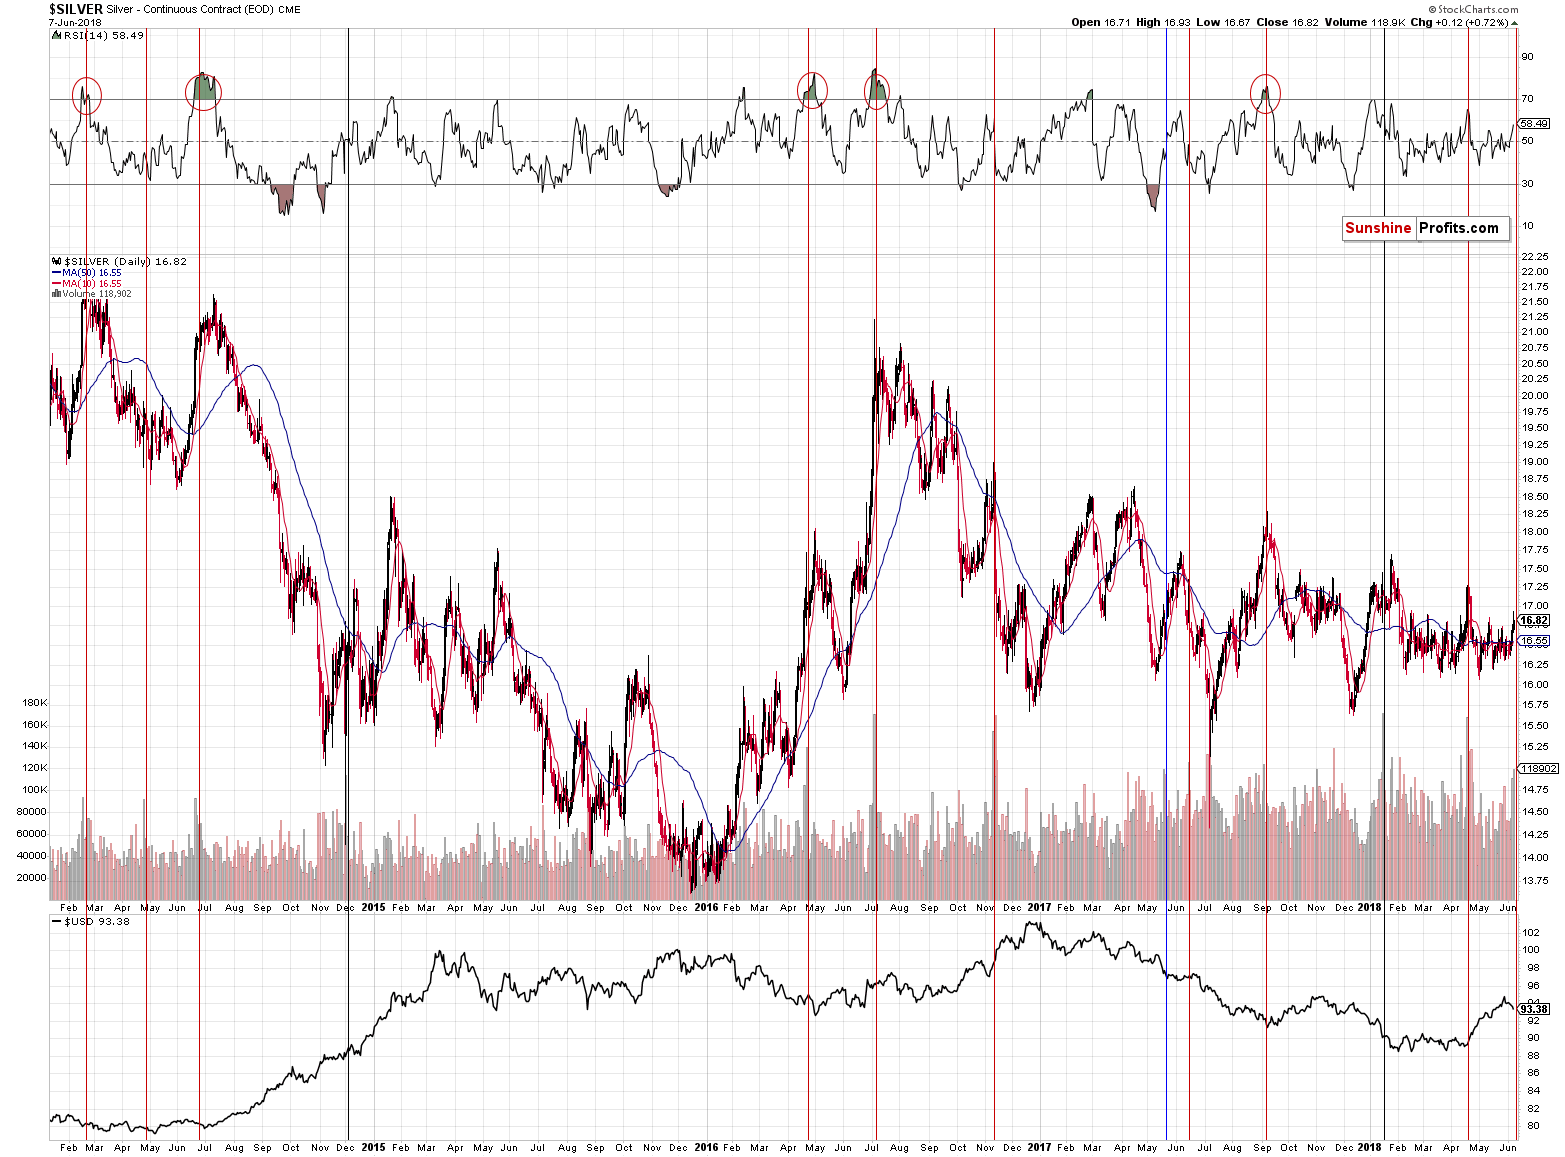
In 9 out of 12 recent cases, big volume during daily rallies meant excellent shorting opportunities (marked with red). In 2 cases it was unclear whether it was an opportunity to go short or long (marked with black), but in both cases entering a short position at that time and keeping it for about 3 weeks would have been profitable. In the remaining case that we marked with blue, silver moved higher but only for 2 weeks – it declined then and if one simply kept the short position intact, for a few more weeks, they would have made sizable gains.
Overall, the implications of a volume spike during a daily rally are clearly bearish… And this doesn’t even take into account the outperformance factor or the shape of the session, which (based on Kitco’s data) was a reversal. Factoring in both makes the outlook for the next weeks even more bearish.
GDX’s Rally vs. HUI’s Apathy: HUI Won
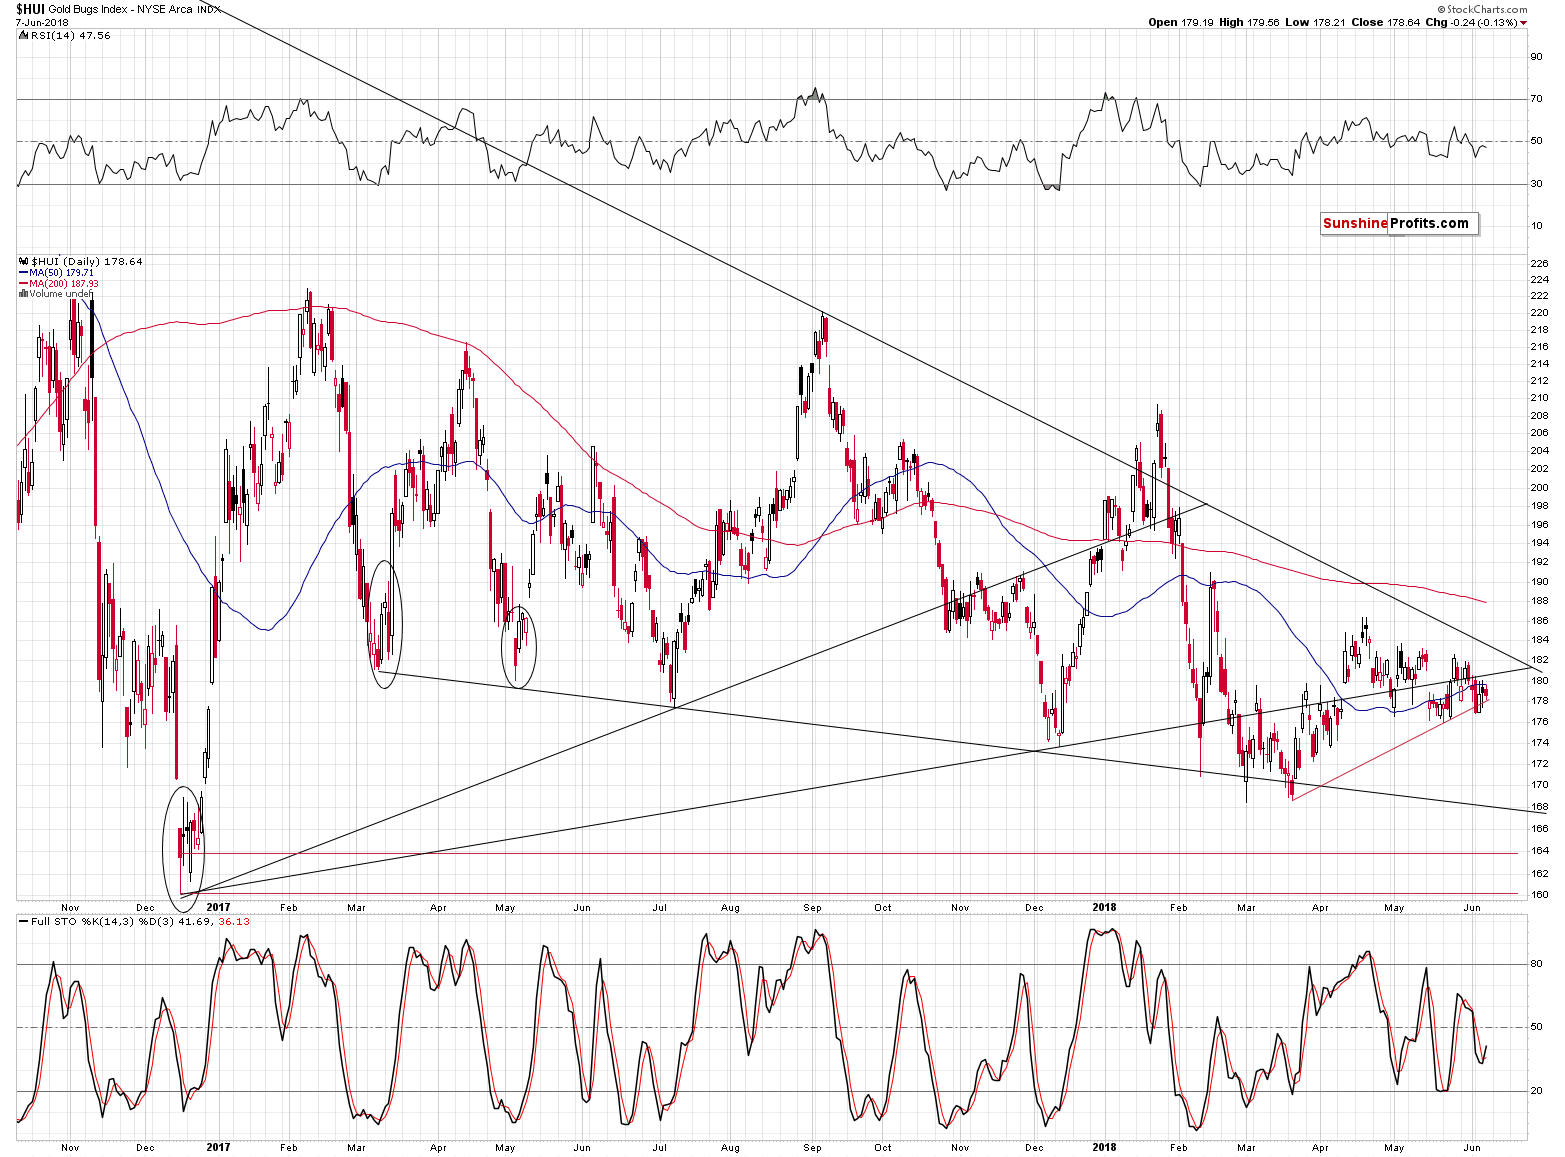
In yesterday’s alert, we wrote that there were different signals coming from various proxies for the mining stocks. This divergence is no longer present as GDX declined, giving in to the pressure from other proxies: HUI and XAU indices. Therefore, any bullish implications that the previous strength might have had, are gone.
At the same time, the pattern that we discussed previously remains up-to-date:
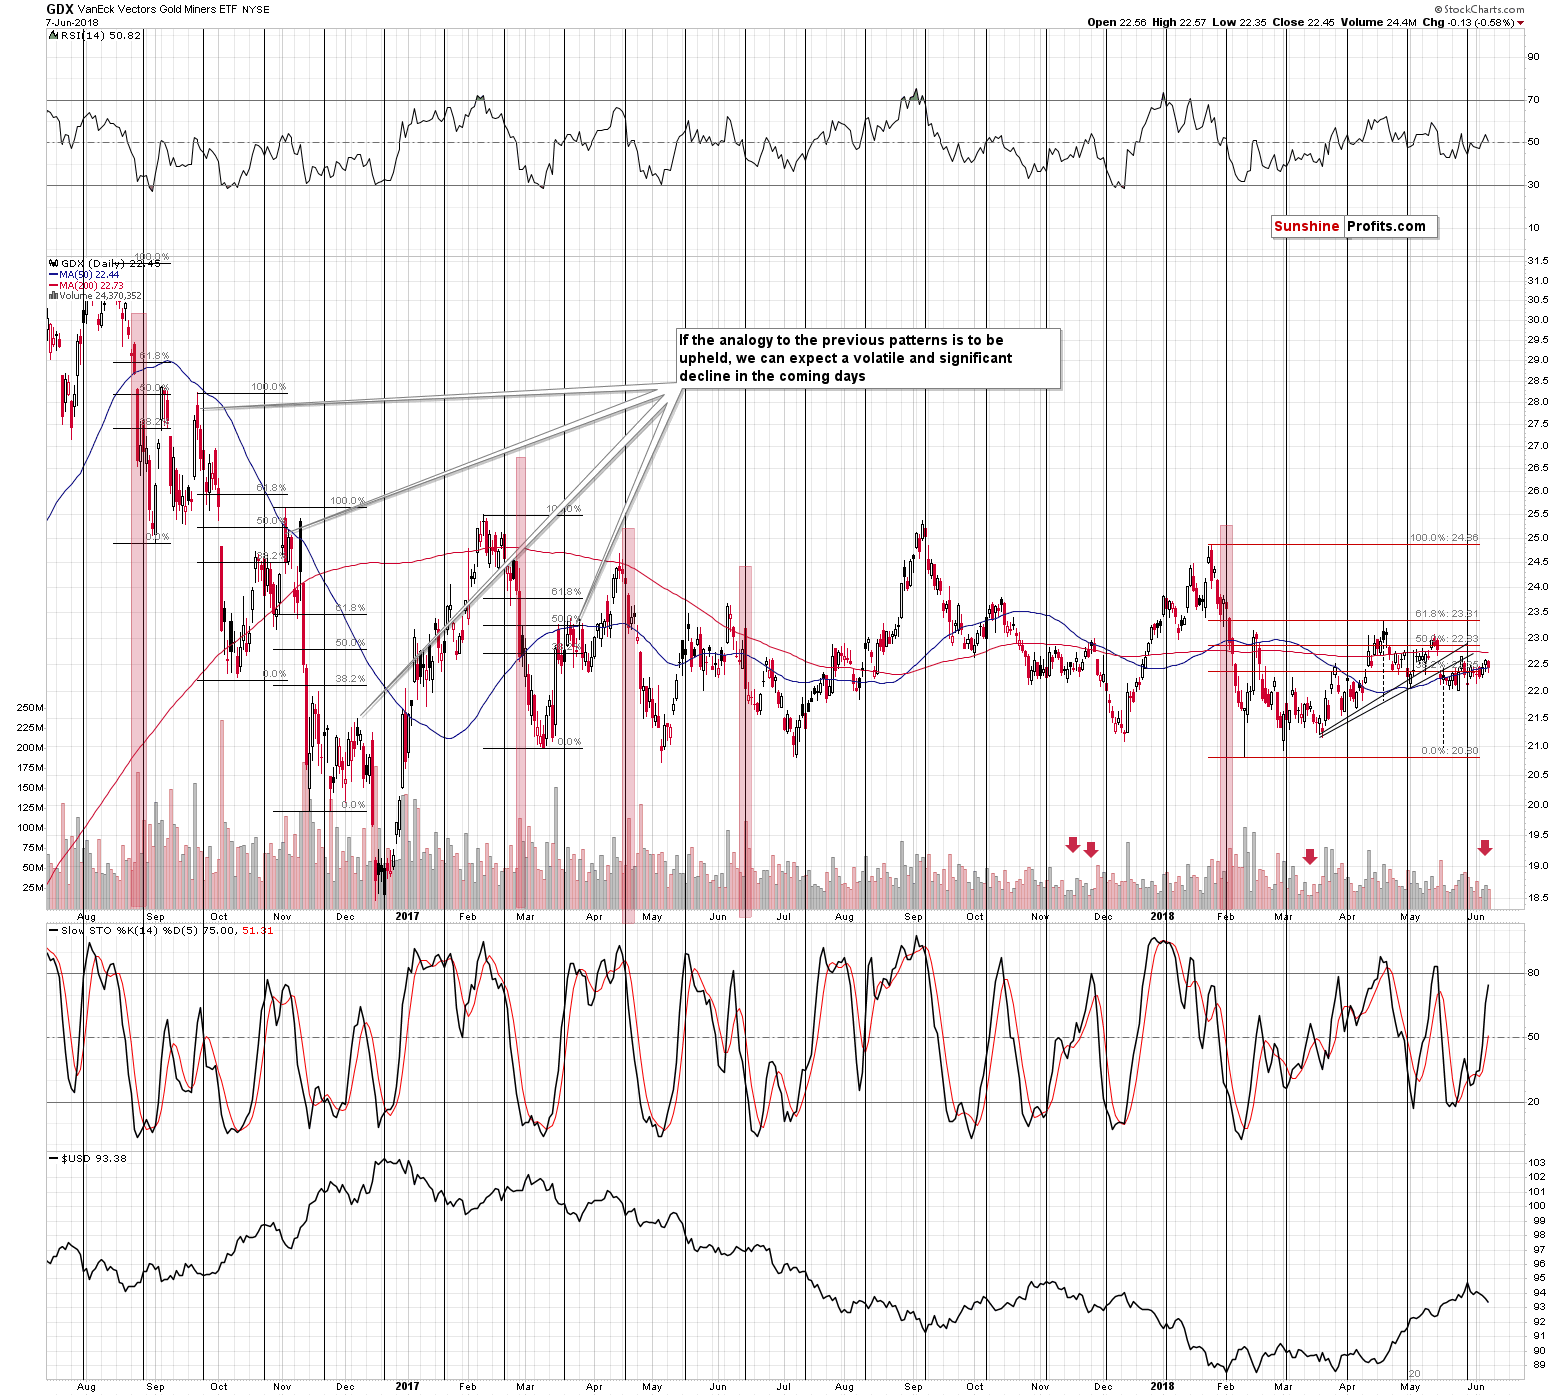
After each short-term downswing that was particularly volatile, GDX moved back up a few times before the decline continued. The early 2018 decline was definitely very volatile, so we shouldn’t be surprised to see this kind of consolidation. It’s longer than the previous ones, but in terms of the prices that were reached, the 2016 price moves and the 2018 ones seem quite similar. The implication here is that once mining stocks break below their previous 2018 low, the following slide is likely to be volatile, just like the declines in 2016 were. In the light of the above, one might expect GDX to reach its late 2016 lows after such breakdown.
On a more short-term note, please note that mining stocks were also trying to break above the rising resistance line based on the March and early May lows, which is also the neck level of the bearish head-and-shoulders formation. Since there was no invalidation, the implications of this formation remain in place. Namely, GDX is likely to move at least to the mid-February 2018 lows rather sooner than later.
All in all, the short-term outlook for the precious metals mining stocks is bearish and it seems that it may become even more bearish later this month, after GDX breaks to the new 2018 lows.
The USD Correction
In yesterday’s alert, we wrote the following:
In the previous alerts, we discussed that the USD Index was likely to correct after (almost) reaching the resistance at the level of 95. That’s what happening and the question is when and at what price levels is the corrective downswing likely to end. To answer this question, let’s start with looking at the context.
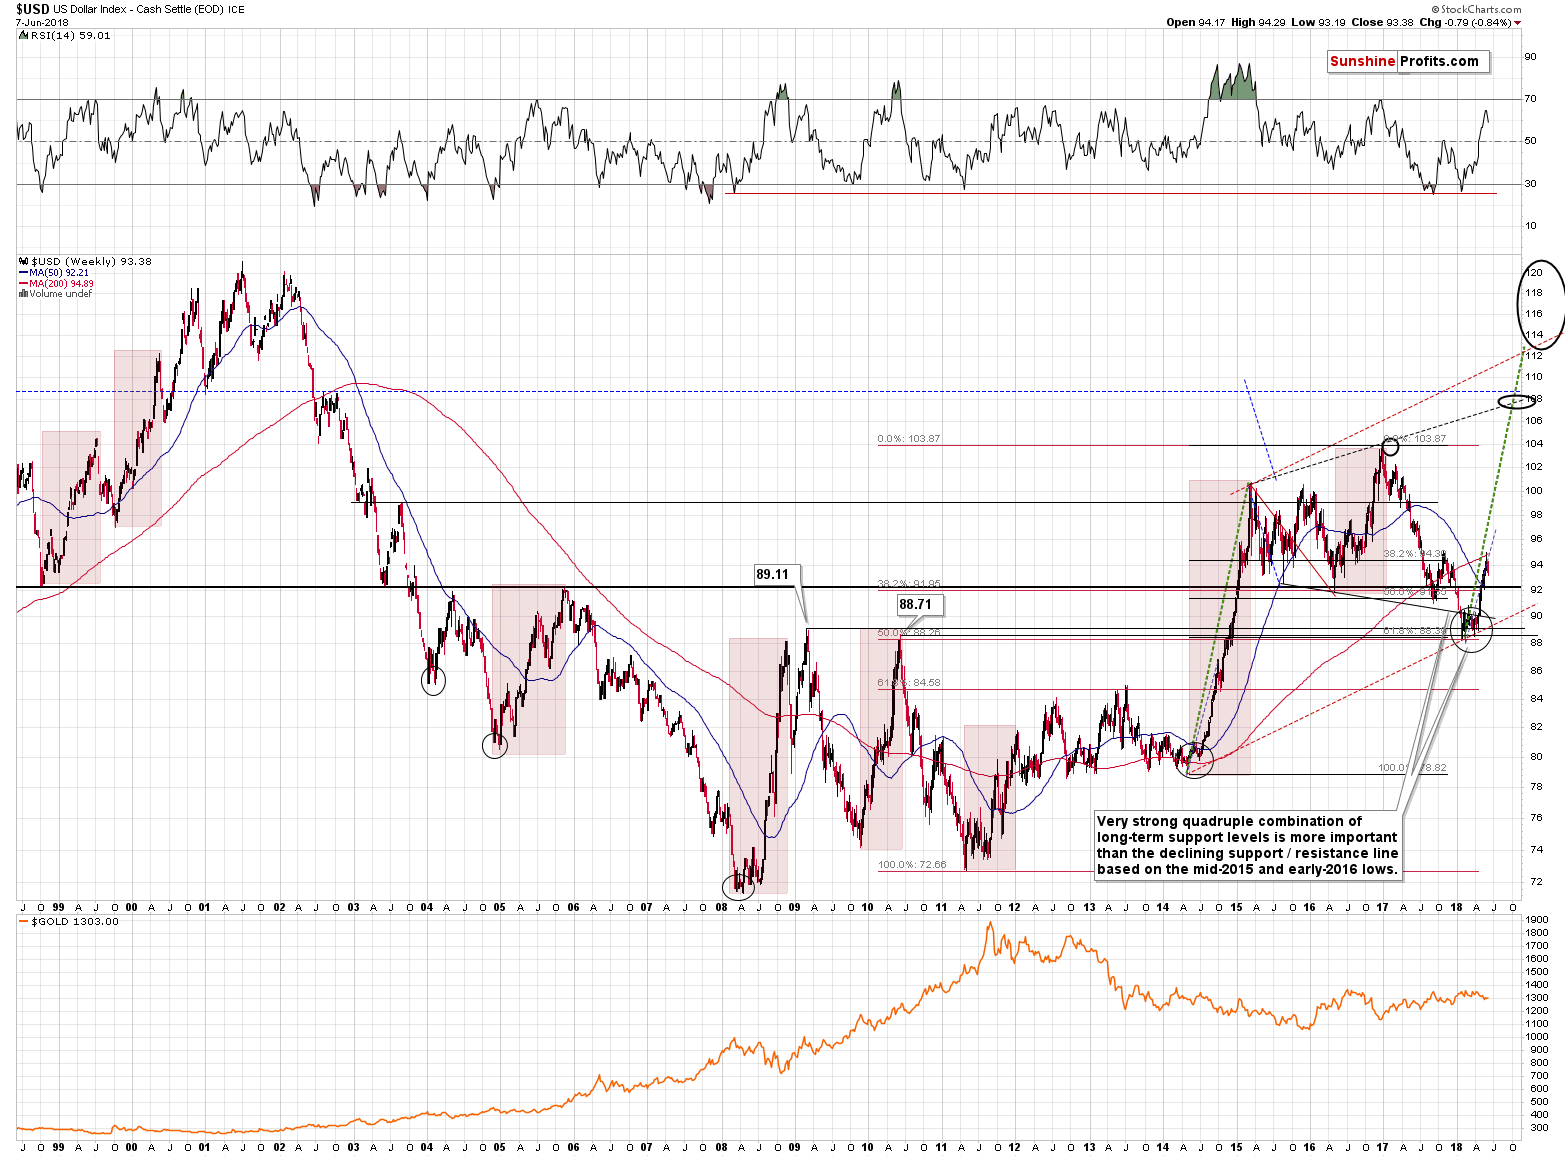
The key context is that the USD Index is soaring just as it did in 2014, 2008, and 2010. If there was very significant similarity for weeks, then one should expect to see similarity in the future, at least in the next few weeks. On a side note, the self-similar patterns are a great tool, but their limitation is that it’s hard to predict when the price moves stop being aligned. Consequently, while the near-term predictions based on it are very useful, making very long-term calls can be less effective. There’s simply more time for the patterns to diverge, so the chance for it increases. That’s why we are not married to the idea of USDX reaching 113 or so based on the similarity to the 2014-2015 rally and we view a move to 107 or so, or even to 118-120 as possible. Since all these outcomes mean substantial gains, the medium-term outlook is bullish either way.
But, moving back to the short-term implications, there’s also the issue of recency that one should take into account. What happened last week is easier to recall than what happened several weeks before. For instance, your Editor practiced smithing (it turns out that arrow heads make quite nice pendants) a few weeks ago and while it all seemed familiar a few days later, it no longer does.
In case of the capital markets, the above effect means that what happened more recently is more likely to be similar to what happens currently. Investors recall the recent events more easily whether that is done consciously or subconsciously. To a small extent, their emotional reactions are also more likely to be aligned with what happened recently than with what happened a long time ago. On the fundamental front, the current developments are also more similar to what happened recently than to what happened many years ago.
Therefore, it seems justified to attribute greater importance to the analogy to what happened recently than to what happened some time ago. In case of the above USD Index chart, this means that the analogy to 2014-2015 seems more important than the analogies to 2008 and 2010.
Consequently, let’s see what happened in the former period in order to see what’s likely to happen now.
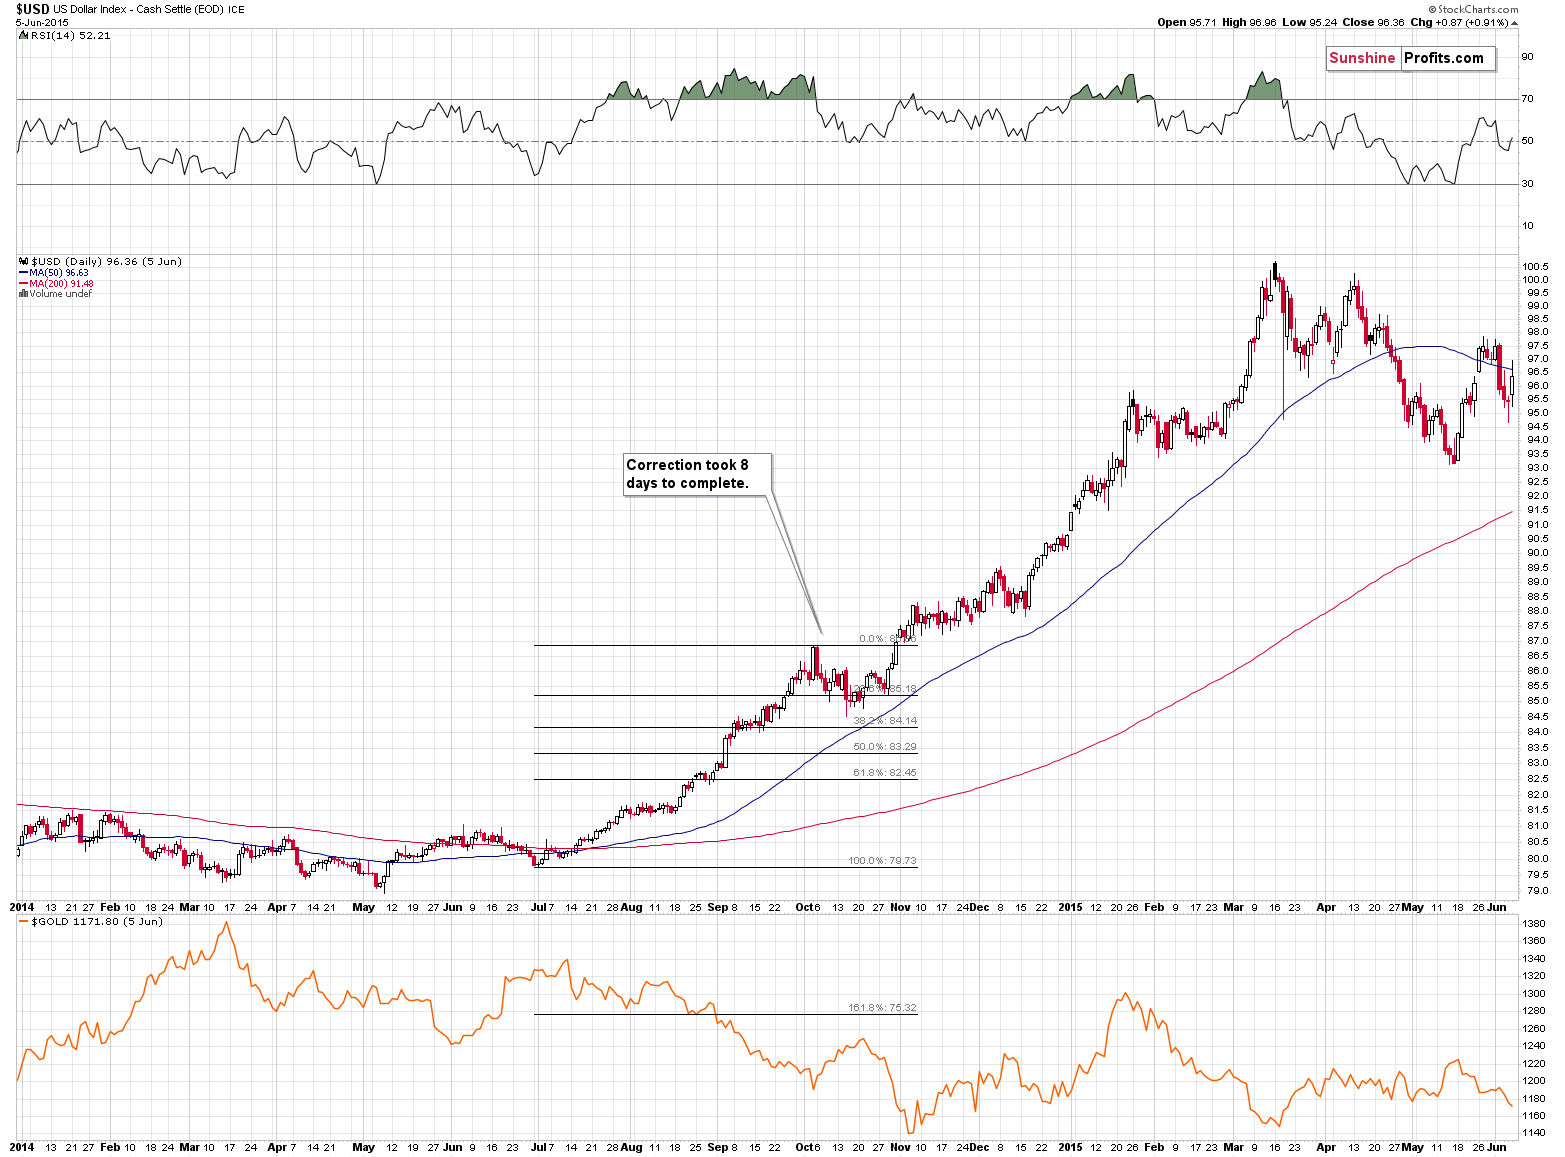
The first correction that we saw during the above big rally took place in October 2014 and it took 8 trading days.
During this correction, the USD moved to about the 23.6% Fibonacci retracement (not the most popular retracement, but it can work during the strongest bull markets). Precisely, USD moved below it on an intraday basis, and closed the session very close to it.
Now, the USD Index is after 6 days of correction and today is the 7th day. During yesterday’s trading, the USDX moved to the 23.6% Fibonacci retracement. Precisely, USD moved below it on an intraday basis, and close the session very close to it. Sounds familiar? Indeed, it’s what ended the correction in 2014 and started another powerful upswing.
It was only 6 days this time, not 8, but the preceding rally was also quicker than in 2014, so it all seems to fit quite well.
Therefore, while the above chart features a target area that we view as the maximum of the likely downside targets (maximum meaning the furthest price drop), it seems more likely that the bottom for this corrective downswing was reached yesterday or that it will be reached this week.
Yesterday’s silver outperformance suggests that the bottom in the USD is already in (assuming that both: USDX and PMs are going to turn around at the same time).
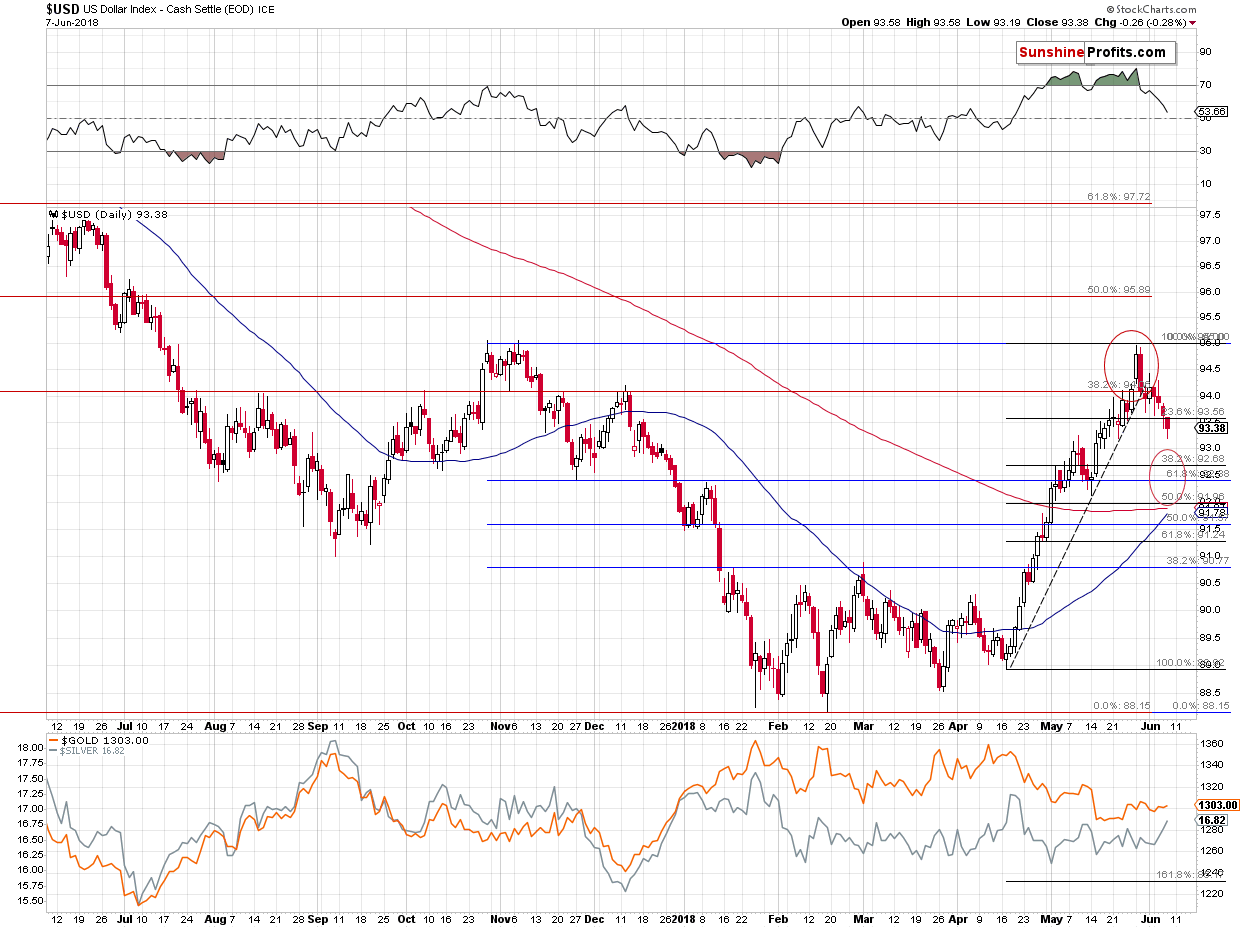
Just as silver’s performance was repeated and bearish implications for this market are even stronger than they were before, the indications for the USD Index were repeated and implications are even stronger than they were before. The USD Index declined for another day, meaning that it’s been correcting for 7 trading days, which makes the correction even more similar to the 2014 one. Moreover, back in 2014, the final bottom took place when USD closed the session a bit below the 23.6% Fibonacci retracement and that was exactly the case yesterday.
While it may appear that yesterday’s decline invalidated the bullish implications that we discussed previously, it actually made them even stronger.
It seems that the USD upswing will resume any day now.
Still, before summarizing, we would like to examine the situation in the two biggest components of the USD Index. The latter is the weighted average of currency exchange rates and the two biggest components are the euro and the yen.
The Euro Index
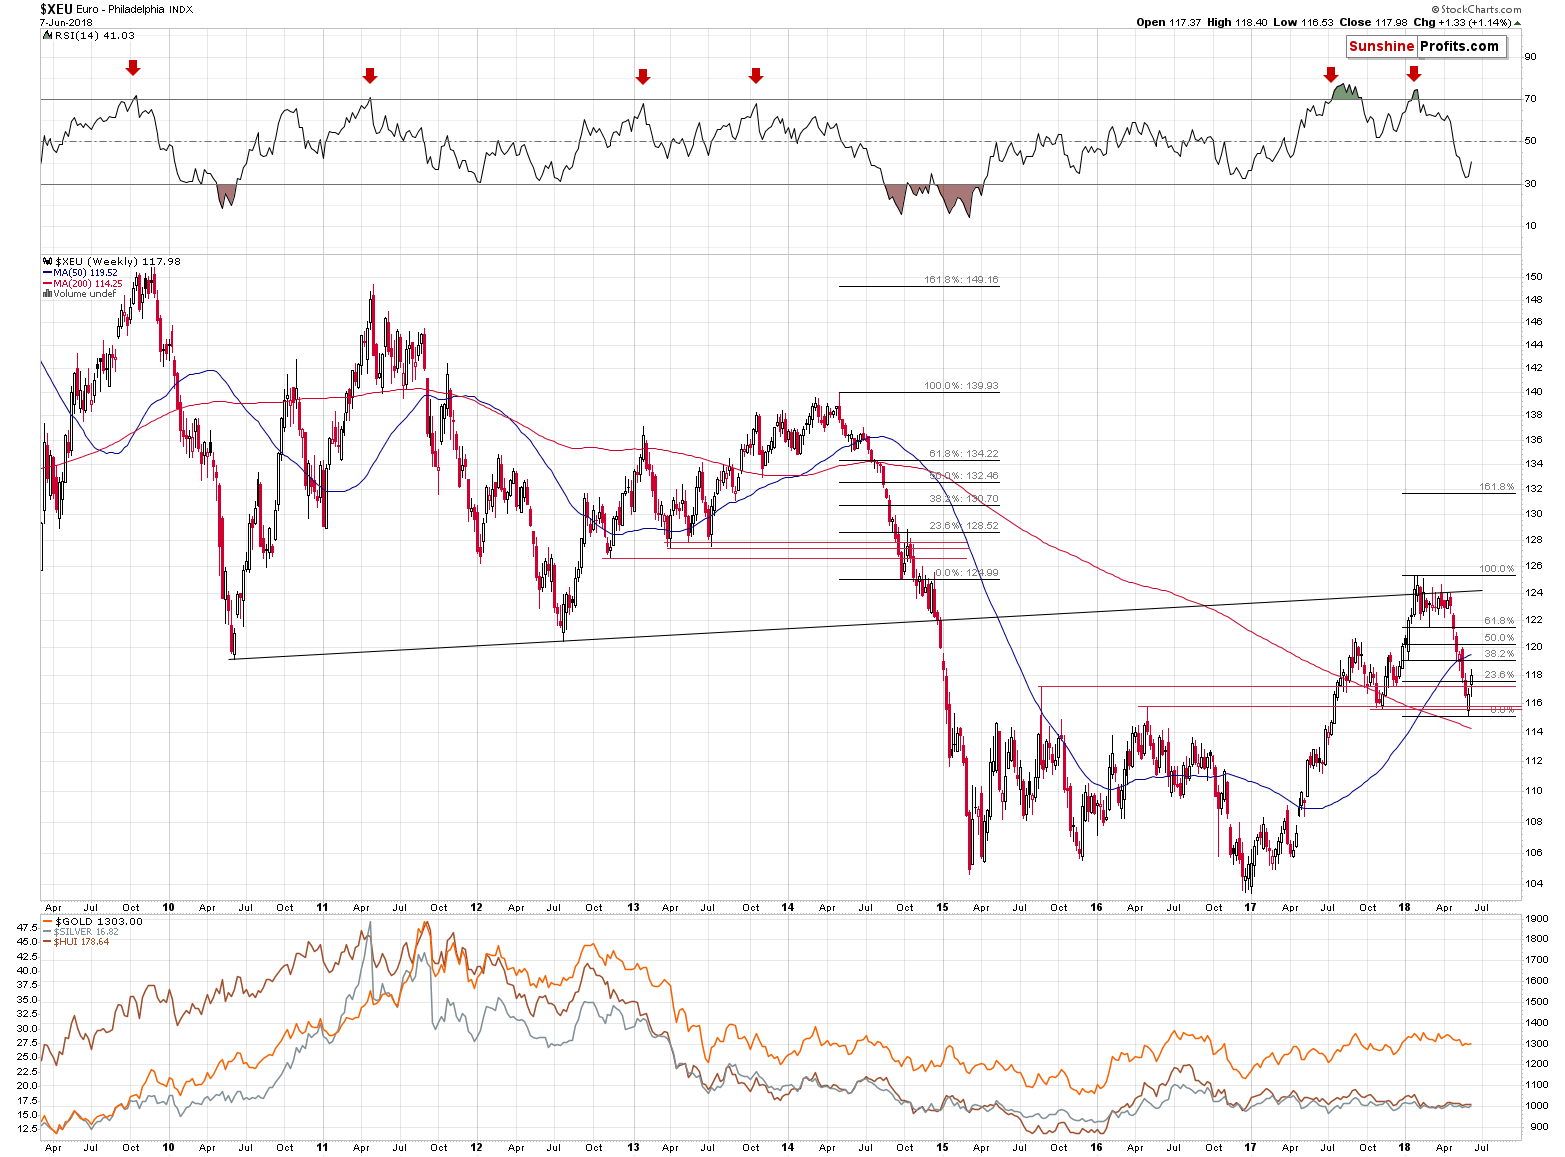
EUR/USD’s weight in the index is over 50%, so it’s no wonder that the two move in tandem at practically all times. It’s also no wonder that just as the 2014 move in the USDX is similar to what happened recently, it’s also similar in case of the euro. The analysis of the latter actually provides us with some additional confirmations.
Similarly to the USDX, the euro corrected a bit above the 23.6% Fibonacci retracement before turning south again, but there is actually another similarity. The correction that we saw in the late 2014 started when euro moved below the previous lows and the correction ended once the European currency moved back above them. We marked the support levels created by the previous lows with red.
The same thing happened recently – euro started its brief upswing once it moved below the late-2017 low and both: 2015 and 2016 highs. It’s now back above them.
The history tends to rhyme and in case of the euro the current verse appears very bearish.
The Japanese Yen
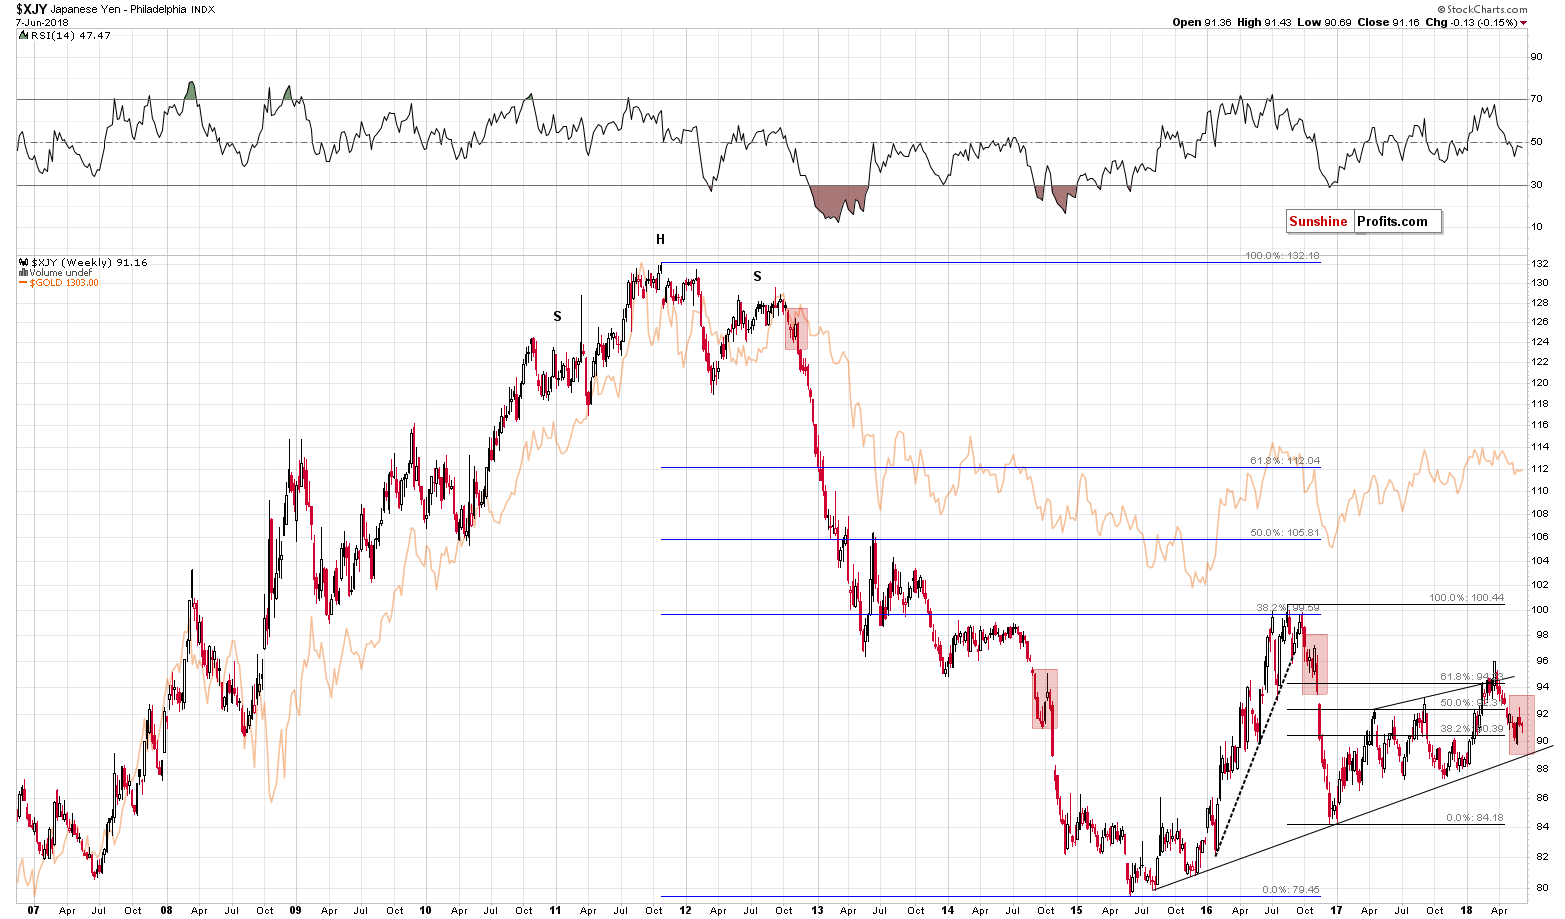
The link to what happened in 2014 is visible in case of the Japanese currency, but it’s not as clear as in case of the euro. But, there is something else that makes the outlook bearish for the following weeks and – possibly – months. The way that the yen corrected after sizable, short-term declines is quite similar to what we already saw previously.
The key is when we saw it. In late 2012, in late 2014 and in late 2016. In all these cases a big decline followed shortly thereafter, and by big, we mean enormous. These were the three biggest declines of the past decade and if this analogy is not bearish, then we don’t know what is.
Also, while it’s not late 2018 yet, the current year still seems in tune with the pattern in which yen slides every other year since 2012.
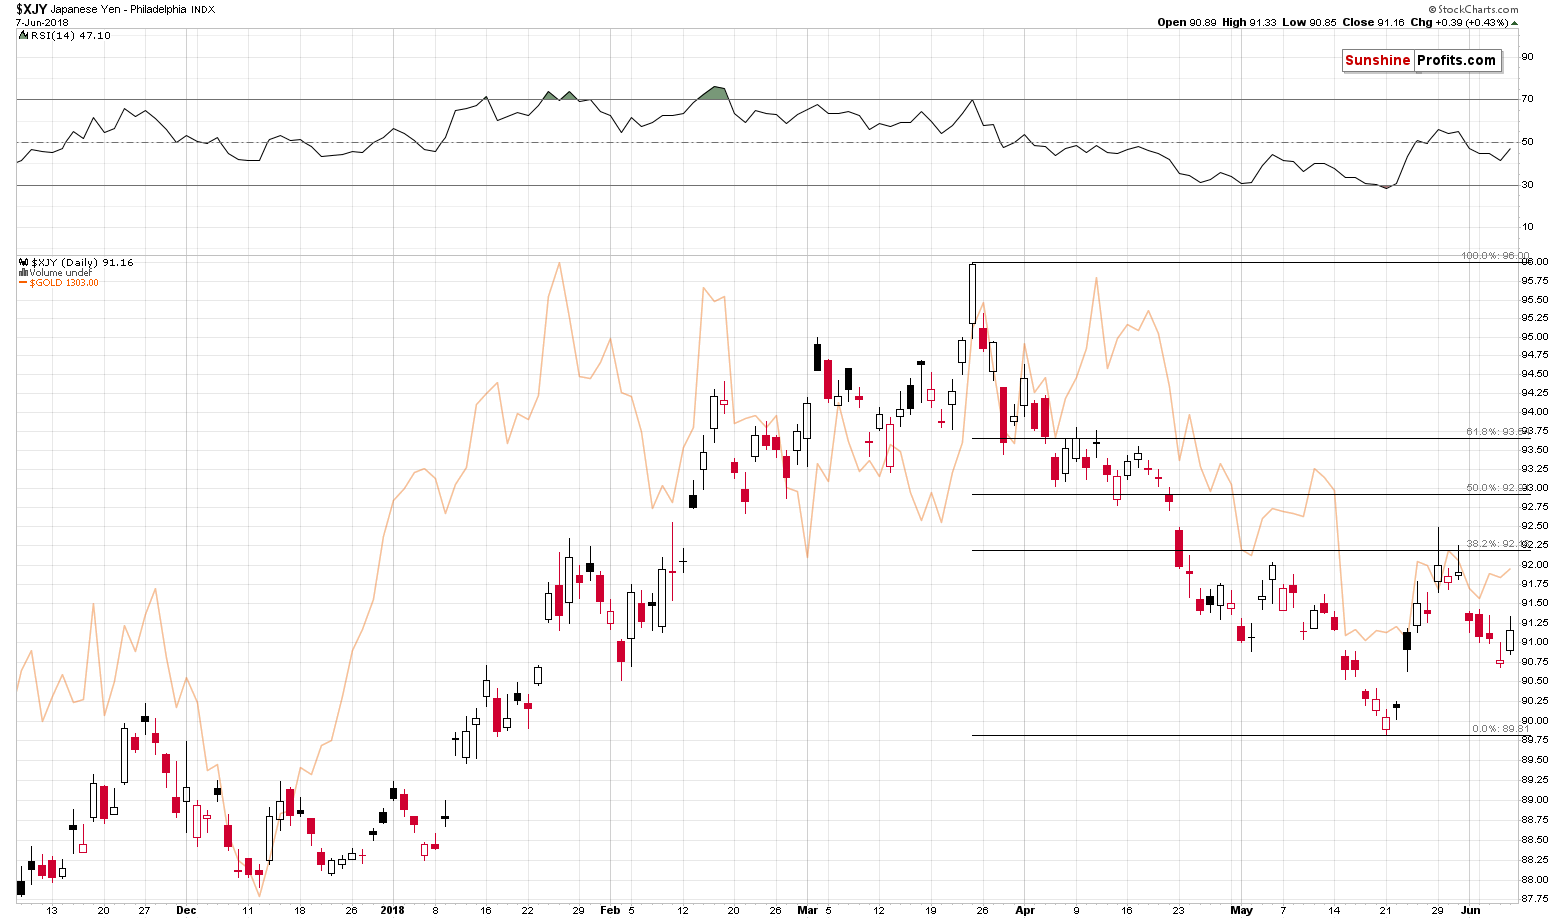
From the short-term point of view, the corrective rally in the yen appears to be over as the currency moved to its 38.2% Fibonacci retracement in late May and failed to break above it. That’s a perfectly natural reaction of a market that declined quite fast but remains in a strong downtrend. If the downtrend was not as strong, the price would have likely corrected to 50% or even 61.8% Fibonacci retracement – but it didn’t.
What does it all mean? That the Japanese yen may be ready for another downswing and if it moves below its May low, it’s likely to slide very fast, just as it did in 2012, 2014, and 2016. This means higher USD and likely lower precious metals prices.
The following week will be hot as there will be Fed, European Central Bank, and Bank of Japan meetings, so we may see some short-term volatility. If it wasn’t for them, we would most likely be writing about opening trading positions on the forex market today.
On an administrative note, as you’ve noticed, today’s alert included quite a lot of forex details, which are normally part of the Forex Trading Alerts. For the next several days, your Editor will be providing the crude oil and forex analysis and we thought that it would be a pleasant surprise to include the latter right into our Gold & Silver Trading Alerts. So, while we’re not going to include forex trading positions into the normal summary of positions for this type of alert as it might be confusing for some subscribers, we will provide additional information regarding any positions in the forex sections, just like we did today, saying that we would have opened trading positions and are not doing so only in light of possible news-driven volatility next week. Naturally, as you’ve read in the previous alerts and as you’ve noticed yourself, the precious metals sector is currently not really replying to forex market’s moves, so it seems that keeping the position in the PMs intact is the way to go, especially given the bearish confirmations from silver.
Summary
Summing up, yesterday’s upswing in silver – just like the one that we had seen on Wednesday – was not a bullish sign, but a bearish one and together with the signal from the USD Index and True Seasonal patterns for this month, we get a very bearish picture for the short- and medium term. Moreover, let’s keep in mind that the analogies to what happened in gold and silver when the market was just as boring as it’s been recently suggest that if we get another very short-term and small move higher, it may be the final one before the move to the final bottom begins. The outlook for the precious metals sector remains bearish.
As always, we’ll keep you – our subscribers – informed.
To summarize:
Trading capital (supplementary part of the portfolio; our opinion): Full short positions (200% of the full position) in gold, silver and mining stocks are justified from the risk/reward perspective with the following stop-loss orders and initial target price levels:
- Gold: initial target price: $1,251; stop-loss: $1,382; initial target price for the DGLD ETN: $48.88; stop-loss for the DGLD ETN $37.48
- Silver: initial target price: $15.73; stop-loss: $18.06; initial target price for the DSLV ETN: $27.58; stop-loss for the DSLV ETN $19.17
- Mining stocks (price levels for the GDX ETF): initial target price: $21.03; stop-loss: $23.54; initial target price for the DUST ETF: $28.88; stop-loss for the DUST ETF $21.16
In case one wants to bet on junior mining stocks' prices (we do not suggest doing so – we think senior mining stocks are more predictable in the case of short-term trades – but if one wants to do it anyway, we provide the details), here are the stop-loss details and initial target prices:
- GDXJ ETF: initial target price: $30.62; stop-loss: $36.14
- JDST ETF: initial target price: $59.68 stop-loss: $40.86
Long-term capital (core part of the portfolio; our opinion): No positions (in other words: cash)
Insurance capital (core part of the portfolio; our opinion): Full position
Plus, you might want to read why our stop-loss orders are usually relatively far from the current price.
Important Details for New Subscribers
Whether you already subscribed or not, we encourage you to find out how to make the most of our alerts and read our replies to the most common alert-and-gold-trading-related-questions.
Please note that the in the trading section we describe the situation for the day that the alert is posted. In other words, it we are writing about a speculative position, it means that it is up-to-date on the day it was posted. We are also featuring the initial target prices, so that you can decide whether keeping a position on a given day is something that is in tune with your approach (some moves are too small for medium-term traders and some might appear too big for day-traders).
Plus, you might want to read why our stop-loss orders are usually relatively far from the current price.
Please note that a full position doesn’t mean using all of the capital for a given trade. You will find details on our thoughts on gold portfolio structuring in the Key Insights section on our website.
As a reminder – “initial target price” means exactly that – an “initial” one, it’s not a price level at which we suggest closing positions. If this becomes the case (like it did in the previous trade) we will refer to these levels as levels of exit orders (exactly as we’ve done previously). Stop-loss levels, however, are naturally not “initial”, but something that, in our opinion, might be entered as an order.
Since it is impossible to synchronize target prices and stop-loss levels for all the ETFs and ETNs with the main markets that we provide these levels for (gold, silver and mining stocks – the GDX ETF), the stop-loss levels and target prices for other ETNs and ETF (among other: UGLD, DGLD, USLV, DSLV, NUGT, DUST, JNUG, JDST) are provided as supplementary, and not as “final”. This means that if a stop-loss or a target level is reached for any of the “additional instruments” (DGLD for instance), but not for the “main instrument” (gold in this case), we will view positions in both gold and DGLD as still open and the stop-loss for DGLD would have to be moved lower. On the other hand, if gold moves to a stop-loss level but DGLD doesn’t, then we will view both positions (in gold and DGLD) as closed. In other words, since it’s not possible to be 100% certain that each related instrument moves to a given level when the underlying instrument does, we can’t provide levels that would be binding. The levels that we do provide are our best estimate of the levels that will correspond to the levels in the underlying assets, but it will be the underlying assets that one will need to focus on regarding the signs pointing to closing a given position or keeping it open. We might adjust the levels in the “additional instruments” without adjusting the levels in the “main instruments”, which will simply mean that we have improved our estimation of these levels, not that we changed our outlook on the markets. We are already working on a tool that would update these levels on a daily basis for the most popular ETFs, ETNs and individual mining stocks.
Our preferred ways to invest in and to trade gold along with the reasoning can be found in the how to buy gold section. Additionally, our preferred ETFs and ETNs can be found in our Gold & Silver ETF Ranking.
As a reminder, Gold & Silver Trading Alerts are posted before or on each trading day (we usually post them before the opening bell, but we don't promise doing that each day). If there's anything urgent, we will send you an additional small alert before posting the main one.
=====
Hand-picked precious-metals-related links:
PRECIOUS-Gold edges up ahead of G7, but dollar recovery caps gains
Russia's Polyus big step closer to building world's largest new gold mine
Scotiabank to scrap half its metals business- sources
=====
In other news:
Emerging Markets Surprise But the Fed Isn’t Blinking: Economy Week
Bernanke Says U.S. Economy Faces a ‘Wile E. Coyote’ Moment in 2020
ECB should curb bank access to cash as it exits crisis mode, Mersch says
Exclusive: Iran slams U.S. for seeking Saudi oil output hike, says OPEC won’t comply
Money Markets See Biggest Inflows Since 2013 in Dash for Cash
=====
Thank you.
Sincerely,
Przemyslaw Radomski, CFA
Founder, Editor-in-chief, Gold & Silver Fund Manager
Gold & Silver Trading Alerts
Forex Trading Alerts
Oil Investment Updates
Oil Trading Alerts

