

Briefly: in our opinion, full (300% of the regular position size) speculative short positions in mining stocks are justified from the risk/reward point of view at the moment of publishing this Alert.
Let's begin today's analysis with a quote from Friday's Alert:
Gold is trading below the upper of the rising support lines and given USD's invalidation, it seems that the yellow metal will attempt to break below the lower support line shortly. This line is currently at about $1,800, so a decisive move below this level is likely to lead to increased selling and decline's acceleration.
Please note that we might also see a verification of the upcoming breakdown below the lower one of the rising support lines, but it's not certain that we'd see it.
Moreover, on a very temporary basis, we still can't rule out a situation, in which gold moves higher to once again verify the more short-term rising support line (the upper one), kind of "kissing it goodbye". In this case, we don't expect gold to move beyond the $1,825 mark and - most importantly - such a move would likely be very temporary.
Fast forward to the current situation.
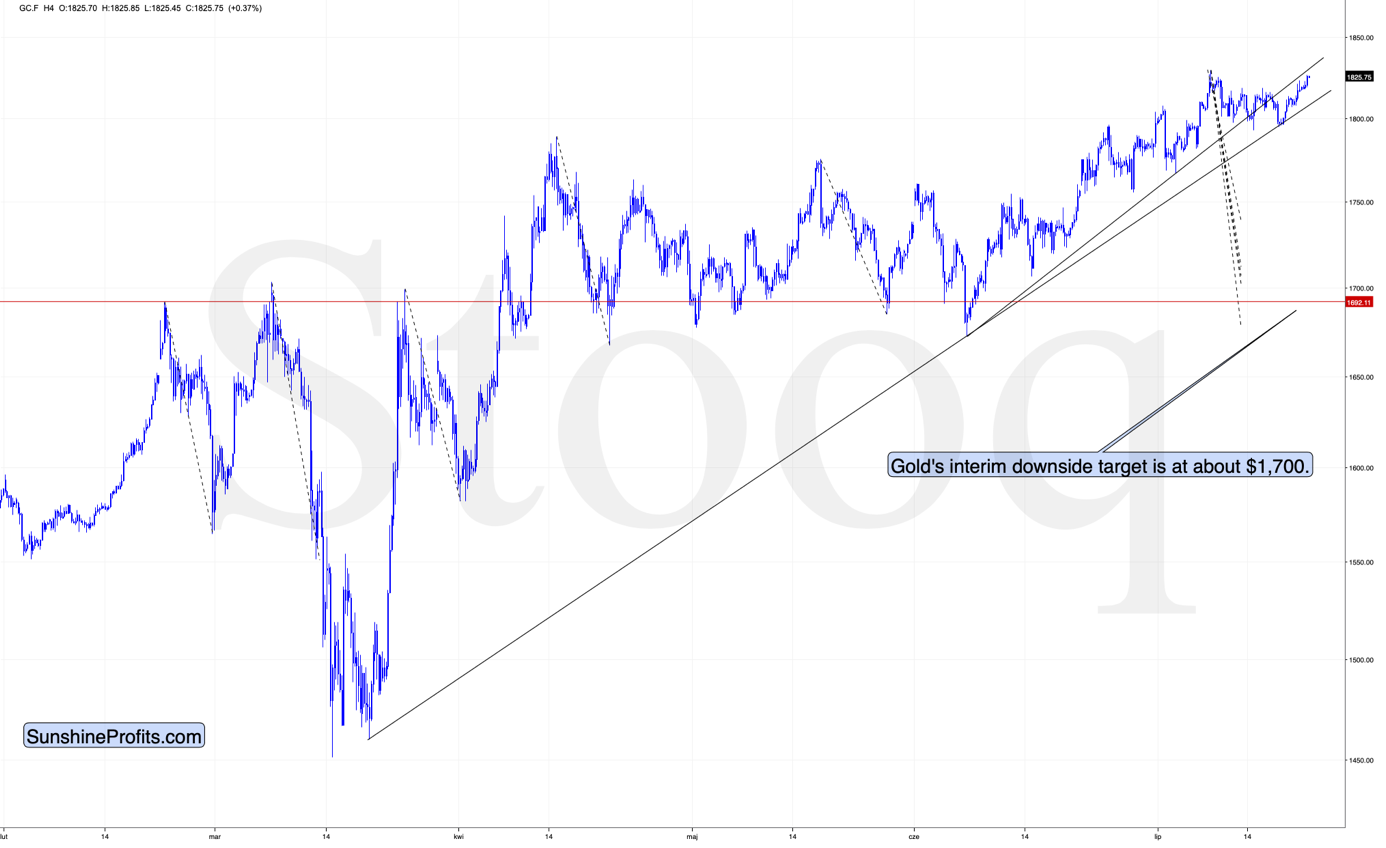
Gold slightly overcame the above-mentioned mark of $1,825 and it's still trading very close to it at the moment of writing these words. Since the previously broken rising support line was not yet touched, we might see a move slightly higher - perhaps to the previous high of about $1,830 that is then followed by the decline, about which we've been writing for days.
Consequently, while the most recent upswing in gold might seem to be a game-changer - it isn't.
Silver shot up yesterday and also in today's pre-market trading, greatly outperforming gold on a very short-term basis - and that's exactly what tends to happen at the tops and right before significant price slides. That's one of the reasons we don't have a short position in silver right now.
The mining stocks' performance also falls in line with what we wrote previously. Quoting yesterday's analysis:
Today, we would like to dig deeper into the analogy to the 2016 top. There are more similarities than just the most-extreme reading from the Gold Miners Bullish Percent Index.
In order to do that, let's zoom in.
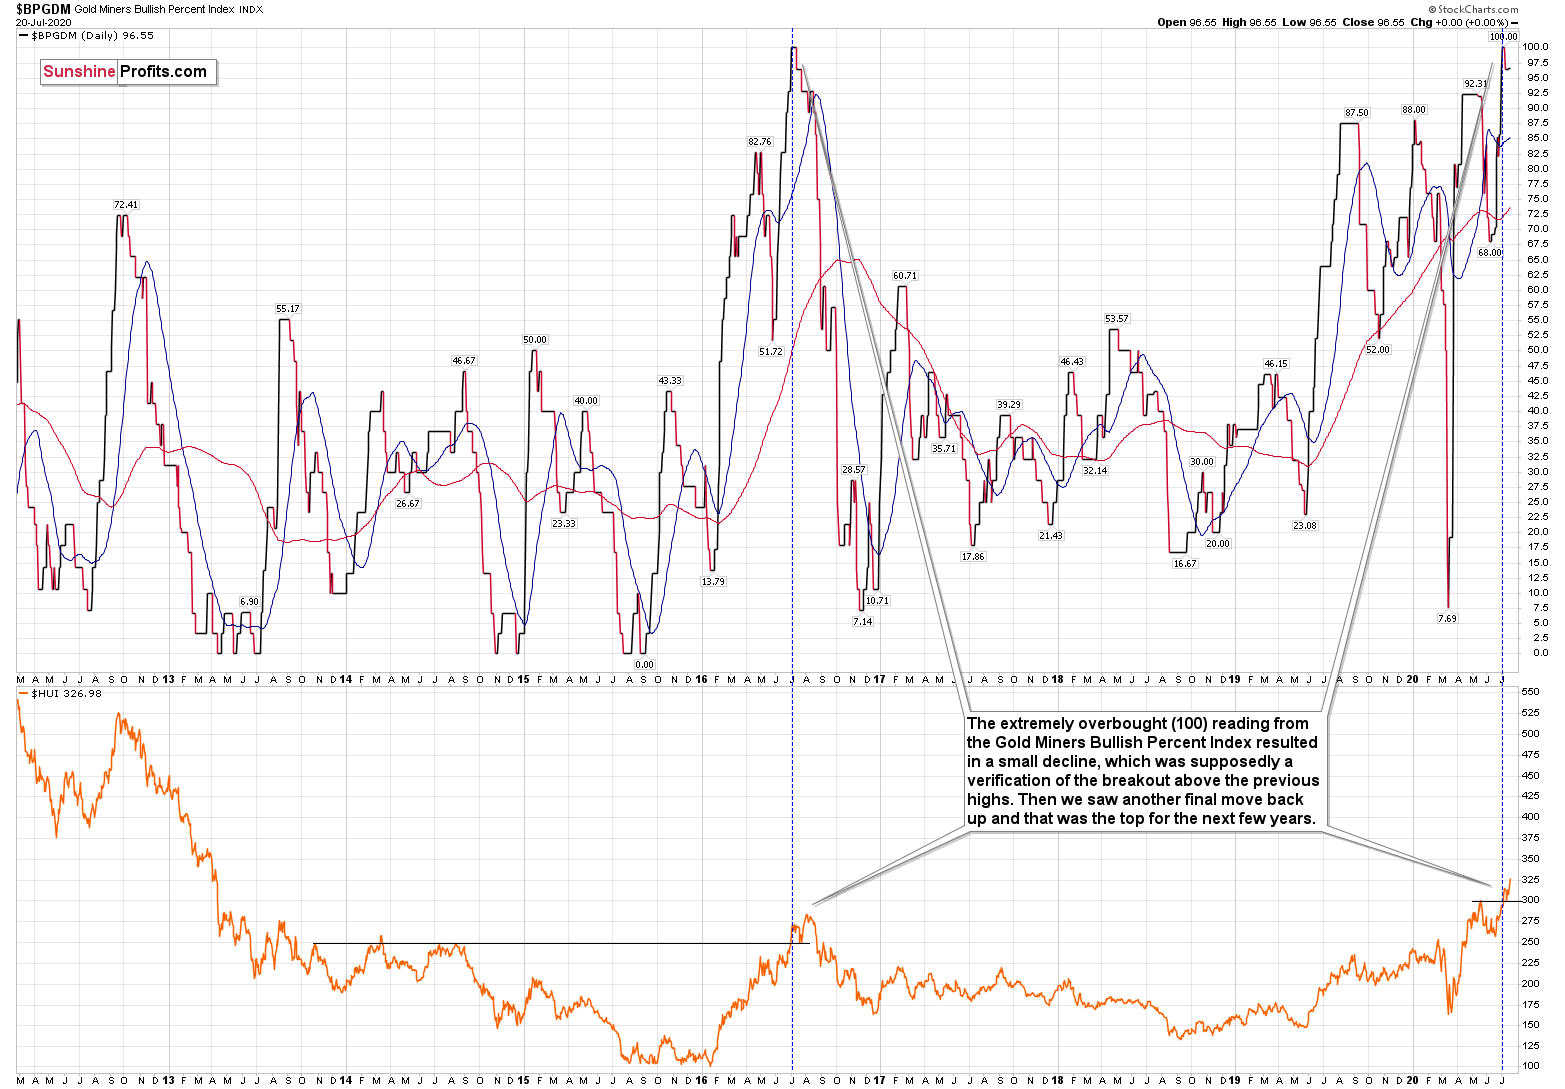
Back in 2016, the extremely overbought (100) reading from the Gold Miners Bullish Percent Index resulted in a small decline, which was supposedly a verification of the breakout above the previous (2013 and 2014) highs. Then we saw another final move back up and that was the top for the next few years.
What happened recently? The extremely overbought reading resulted in a decline back to the previous 2020 high and then another move higher. This is very similar to what we saw in 2016.
What happened in the GDX ETF with regard to its own technical indications?
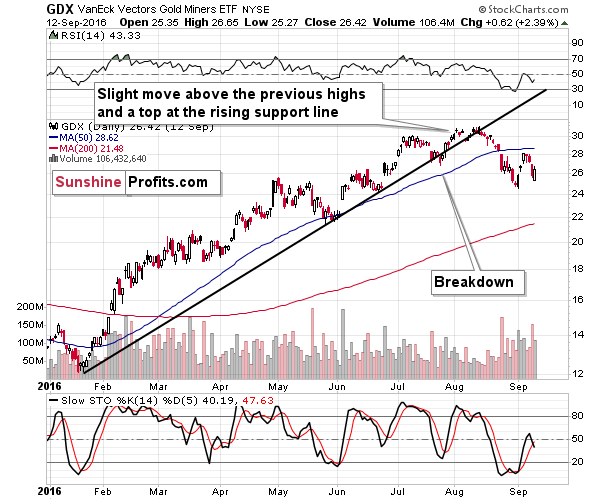
Well, shortly after the extremely-overbought reading, the GDX ETF moved lower and broke below the rising medium-term support line. It then moved back up and topped slightly above the previous highs. When the rising support line was more or less at the same price level as the previous high, GDX broke below it and formed a top that was not exceeded for a few years.
And what happened recently in the GDX?
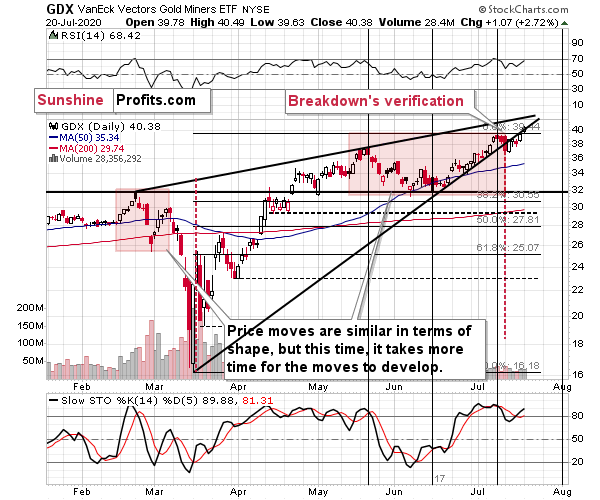
Pretty much the same thing. Shortly after we saw the extreme (100) reading from the Gold Miners Bullish Percent Index, GDX broke below its rising medium-term support line. It then moved back up, and while it didn't move to new intraday highs, Friday's closing price was slightly above the previous 2020 high.
The rising medium-term support line just moved to the previous high as well.
The history has been repeating to a very considerable (quite remarkable) extent, and if it continues to do so - which seems likely - we're likely to see a sizable decline shortly. In fact, Friday's high might have been the high for the next few months. If not, then such a high is very likely to form this week.
Miners moved higher yesterday, but they didn't invalidate the breakdown below the rising support line. It continues to serve as resistance. Since gold moved higher in today's pre-market trading and it didn't decline back so far today, it could be the case that gold miners will also move higher today. It could also be the case that gold reverses shortly after touching $1,830 or so, and that happens before the end of today's trading. This would likely result in a decline in miners after an initial upswing. Therefore, we might see an initial move higher - back above the rising resistance line, and then a slide below it, perhaps through a daily reversal pattern. Such a development would be a perfectly bearish confirmation of yesterday's big analysis.
Back in 2016, when the Gold Miners Bullish Percent Index moved to 100, the GDX ETF continue to move up for a few days and topped on July 6th. The exact top was about a week later - on July 11th the price was slightly higher, but the real initial top formed on July 6th. The GDX ETF closed at $29.87 on that day. Then it declined and formed the final top in August. The high in terms of the closing prices was formed on August 2, at $30.60. Consequently, GDX's final top in terms of the closing prices was 2.44% higher than the initial top.
If we made the same calculations for the intraday highs, we would see that the final top was ($31.06 / $30.02 - 1) 3.46% higher.
Now, the most recent high that accompanied the 100-level reading in the Gold Miners Bullish Percent Index was $38.96 in terms of the daily closing prices and $39.44 in terms of the intraday highs.
Assuming the analogous relative price increases this time, one could expect GDX to form a top at $39.91 in terms of the daily closing prices and to form the intraday high at $40.81.
The GDX ETF just closed at $40.38 and the intraday high was $40.49. These prices are between the above-mentioned prices, which means that so far the situation is developing very similarly as it developed in 2016, and that we can expect the final top to be in or to be formed very soon.
Before summarizing, we would like to reply to a few questions that we received recently:
Q: What is the downside target for the USDOLLAR INDEX?
A: In my opinion - PR here - it's probably bottoming more or less at the current levels. Even if it moves temporarily lower, I don't expect it to decline below the March low of 94.6. Again, I don't think it will move as low. Instead, it seems that the move below 96 right now is just a temporary phenomenon that will be invalidated shortly.
Q: In evaluating golds future, why do you NOT mention that volume in gold has been reduced to a trickle !? Could it be that there are very few buyers left to support gold ?
A: Yes, this could be the case, but it could be the case that given the largely unclear situation in all markets right now (and in the world in general) that people are hesitant to trading any asset right now - please note that the volume for crude oil is even lower on a relative basis. In my view, the most likely situation is that people get eventually scared back into cash, just like they did in March. While the economic implications are not yet dire, in my opinion they will get so, and people will realize that their optimism regarding the rebound was very exaggerated. When that comes, and it's more and more likely given the rising new daily Covid-19 cases, the markets could move significantly just as they did a quarter ago. The volatility was not huge before Feb 20 either...
Summary
Summing up, the extremely overbought reading from the Gold Miners Bullish Percent Index and the individual price moves make the current case very similar to the 2016 topping pattern, and other important indications (especially gold's and USD's long-term cycles) point to likely - sizable - decline in the following several weeks. Gold moved higher yesterday and today, but it didn't move below the previously broken support line or the previous highs, so it's still behaving in tune with what we wrote previously. Silver's very short-term outperformance very often precedes tops and big declines, so we shouldn't be concerned with its strength as far as the overall outlook for the precious metals is concerned.
Naturally, everyone's trading is their responsibility, but in our opinion, if there ever was a time to either enter a short position in the miners or to increase its size if it wasn't already sizable, it's now. We made money on the March decline and on the March rebound, and it seems that another massive slide is about to start. When everyone is on one side of the boat, it's a good idea to be on the other side, and the Gold Miners Bullish Percent Index literally indicates that this is the case with mining stocks.
After the sell-off (that takes gold below $1,400), we expect the precious metals to rally significantly. The final decline might take as little as 1-6 weeks, so it's important to stay alert to any changes.
Most importantly - stay healthy and safe. We made a lot of money on the March decline and the subsequent rebound (its initial part) price moves (and we'll likely make much more in the following weeks and months), but you have to be healthy to really enjoy the results.
As always, we'll keep you - our subscribers - informed.
To summarize:
Trading capital (supplementary part of the portfolio; our opinion): Full speculative short positions (300% of the full position) in mining stocks is justified from the risk to reward point of view with the following binding exit profit-take price levels:
Senior mining stocks (price levels for the GDX ETF): binding profit-take exit price: $10.32; stop-loss: none (the volatility is too big to justify a SL order in case of this particular trade); binding profit-take level for the DUST ETF: $231.75; stop-loss for the DUST ETF: none (the volatility is too big to justify a SL order in case of this particular trade)
Junior mining stocks (price levels for the GDXJ ETF): binding profit-take exit price: $9.57; stop-loss: none (the volatility is too big to justify a SL order in case of this particular trade); binding profit-take level for the JDST ETF: $284.25; stop-loss for the JDST ETF: none (the volatility is too big to justify a SL order in case of this particular trade)
For-your-information targets (our opinion; we continue to think that mining stocks are the preferred way of taking advantage of the upcoming price move, but if for whatever reason one wants / has to use silver or gold for this trade, we are providing the details anyway. In our view, silver has greater potential than gold does):
Silver futures downside profit-take exit price: $8.58 (the downside potential for silver is significant, but likely not as big as the one in the mining stocks)
Gold futures downside profit-take exit price: $1,382 (the target for gold is least clear; it might drop to even $1,170 or so; the downside potential for gold is significant, but likely not as big as the one in the mining stocks or silver)
Long-term capital (core part of the portfolio; our opinion): No positions (in other words: cash
Insurance capital (core part of the portfolio; our opinion): Full position
Whether you already subscribed or not, we encourage you to find out how to make the most of our alerts and read our replies to the most common alert-and-gold-trading-related-questions.
Please note that the in the trading section we describe the situation for the day that the alert is posted. In other words, it we are writing about a speculative position, it means that it is up-to-date on the day it was posted. We are also featuring the initial target prices, so that you can decide whether keeping a position on a given day is something that is in tune with your approach (some moves are too small for medium-term traders and some might appear too big for day-traders).
Plus, you might want to read why our stop-loss orders are usually relatively far from the current price.
Please note that a full position doesn't mean using all of the capital for a given trade. You will find details on our thoughts on gold portfolio structuring in the Key Insights section on our website.
As a reminder - "initial target price" means exactly that - an "initial" one, it's not a price level at which we suggest closing positions. If this becomes the case (like it did in the previous trade) we will refer to these levels as levels of exit orders (exactly as we've done previously). Stop-loss levels, however, are naturally not "initial", but something that, in our opinion, might be entered as an order.
Since it is impossible to synchronize target prices and stop-loss levels for all the ETFs and ETNs with the main markets that we provide these levels for (gold, silver and mining stocks - the GDX ETF), the stop-loss levels and target prices for other ETNs and ETF (among other: UGLD, DGLD, USLV, DSLV, NUGT, DUST, JNUG, JDST) are provided as supplementary, and not as "final". This means that if a stop-loss or a target level is reached for any of the "additional instruments" (DGLD for instance), but not for the "main instrument" (gold in this case), we will view positions in both gold and DGLD as still open and the stop-loss for DGLD would have to be moved lower. On the other hand, if gold moves to a stop-loss level but DGLD doesn't, then we will view both positions (in gold and DGLD) as closed. In other words, since it's not possible to be 100% certain that each related instrument moves to a given level when the underlying instrument does, we can't provide levels that would be binding. The levels that we do provide are our best estimate of the levels that will correspond to the levels in the underlying assets, but it will be the underlying assets that one will need to focus on regarding the signs pointing to closing a given position or keeping it open. We might adjust the levels in the "additional instruments" without adjusting the levels in the "main instruments", which will simply mean that we have improved our estimation of these levels, not that we changed our outlook on the markets. We are already working on a tool that would update these levels on a daily basis for the most popular ETFs, ETNs and individual mining stocks.
Our preferred ways to invest in and to trade gold along with the reasoning can be found in the how to buy gold section. Additionally, our preferred ETFs and ETNs can be found in our Gold & Silver ETF Ranking.
As a reminder, Gold & Silver Trading Alerts are posted before or on each trading day (we usually post them before the opening bell, but we don't promise doing that each day). If there's anything urgent, we will send you an additional small alert before posting the main one.
Thank you.
Sincerely,
Przemyslaw Radomski, CFA
Editor-in-chief, Gold & Silver Fund Manager

