
tools spotlight

-
The Booming US Economy Forces the Fed to Hit the Hawkish Gas
August 8, 2022, 7:37 AMWhile investors erroneously assumed that the Fed could ease monetary policy with 9%+ inflation, the crowd bought into the notion that the post-GFC playbook still holds. However, with unanchored inflation forcing the Fed to raise interest rates during recessions in the 1970s and 1980s, I warned on Aug. 5 that the consensus misses the forest through the trees. I wrote:
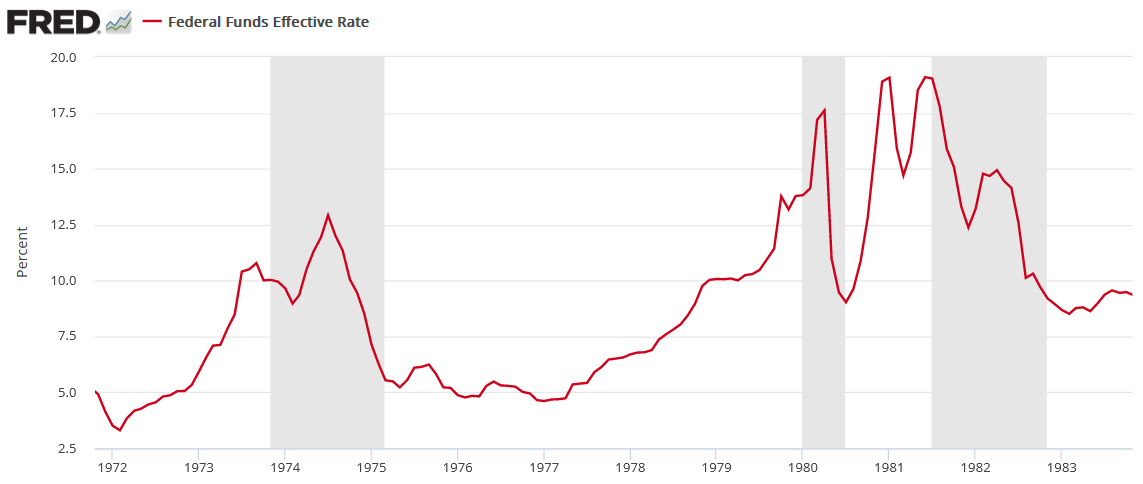
To explain, the red line above tracks the FFR during the 1970s/1980s, and the vertical gray bars represent recessions. For one, unanchored inflation forced the Fed to raise interest rates during (not just before) all three recessions. In addition, the ~1974 and ~1982 recessions show how after the Fed cut rates to support economic growth, the central bank had to reverse course and raise the FFR once again. As such, the consensus underestimates how difficult it is to slay inflation once it gets going.
Likewise, while the prospect of a dovish pivot was a fallacy to begin with, another dose of reality hit the wire on Aug. 5. For example, U.S. nonfarm payrolls (the red box) came in at 528,000 versus 250,000 expected, which highlights the continued resiliency of the U.S. labor market. Moreover, employment strength only adds fuel to the hawkish fire.
Please see below:
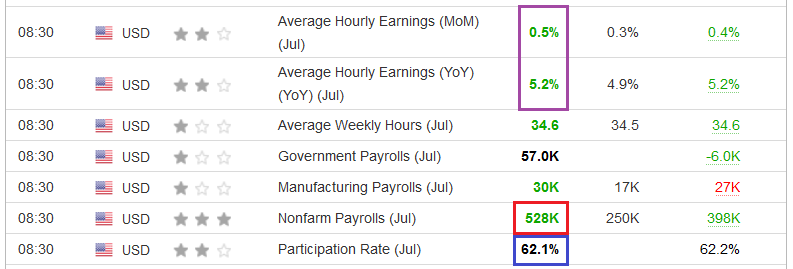 Source: Investing.com
Furthermore, if you analyze the purple box above, you can see that average hourly earnings also outperformed economists’ consensus estimates. Therefore, while I’ve been sounding the alarm on wage inflation for many months, the data continues to come in hot.
More importantly, the blue box above shows how the labor force participation rate declined from 62.2% in June to 62.1% in July. This is profoundly inflationary. With the demand for workers still apparent and the supply shrinking each month, wages will remain elevated as companies compete for potential candidates. As such, the data should keep the Fed’s foot on the hawkish accelerator, and the prospect is bearish for gold, silver, and mining stocks.
To that point, Fed Governor Michelle Bowman said on Aug. 6:
“One aspect of the job market that has not recovered is labor force participation. Based on the pre-pandemic trend, there are nearly four million people who are still sitting out of a strong labor market (…). Yesterday's job report showed continued significant growth in hiring with the unemployment rate finally returning to the pre-pandemic level of 3.5%.”
She added:
“When considering the risks to the labor market, these risks must be viewed in the context of its current strength and with the understanding that our primary challenge is to get inflation under control. In fact, the larger threat to the strong labor market is excessive inflation, which if allowed to continue could lead to a further economic softening, risking a prolonged period of economic weakness coupled with high inflation, like we experienced in the 1970s.”
As a result:
 Source: U.S. Fed
Thus, while Fed officials have intensified their efforts to unwind the dovish damage done during Chairman Jerome Powell’s press conference on Jul. 27, the bond market took note of the fundamental developments.
Please see below:
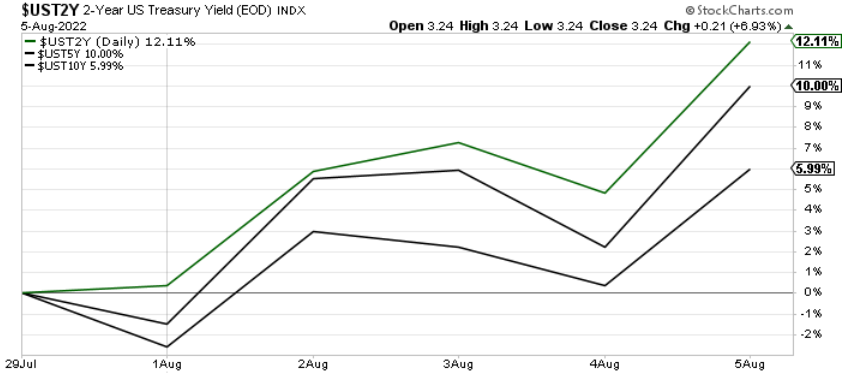
To explain, the green and black lines above track the one-week performance of the U.S. 2-Year, 5-Year, and 10-Year Treasury yields. As you can see, interest rates rose sharply last week, with the bulk of the move occurring after the payroll print on Aug. 5. Furthermore, with the U.S. 10-Year breakeven inflation rate declining to 2.46%, the U.S. 10-Year real yield closed at 0.37% on Aug. 5.
Therefore, while the S&P 500’s intraday comeback helped gold, silver, and mining stocks close off their lows, the fundamentals continue to support lower prices over the medium term. Moreover, I’ve long warned that the Fed needs higher real yields to curb inflation; and with Powell nodding in agreement during his June press conference, more downside should confront the PMs as the Fed’s inflation fight intensifies.
 Source: U.S. Fed
Spend, Spend, Spend
While the consensus expects a smooth normalization from 9%+ to 2% annual inflation, I’ve warned that underestimating demand has been investors and the Fed’s undoing. I wrote on Dec. 23, 2021.
While the fiscal spending spree may end, U.S. households are flush with cash. U.S. households have nearly $3.54 trillion in their checking accounts. For context, this is 253% more than Q4 2019 (pre-COVID-19)(…).
While some investors expect a dovish 180 from the Fed, they shouldn’t hold their breath. With U.S. economic growth still resilient and the U.S. consumer in much better shape than some portray, the Fed can raise interest rates without crashing the U.S. economy. As a result, Powell will likely stick to his hawkish script and forge ahead with rate hikes in 2022.
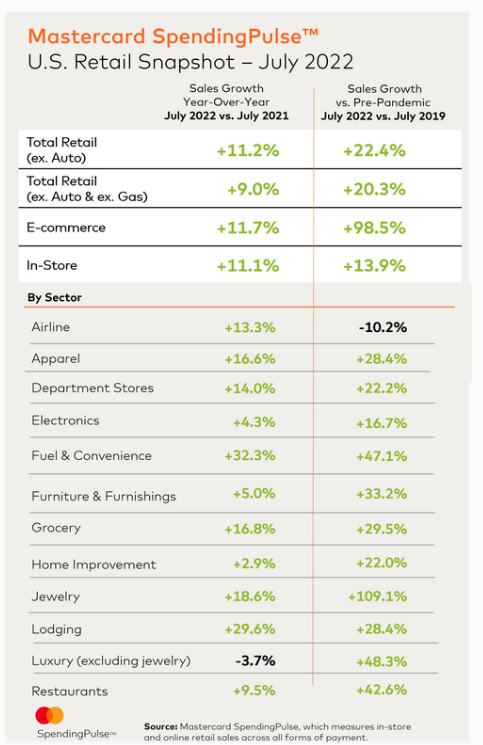
Therefore, while nine rate hikes (25 basis point increments) have commenced in 2022, higher interest rates have done little to derail the U.S. consumer. For example, Mastercard released its SpendingPulse retail sales report on Aug. 4. An excerpt read:
“Spending increases in July outpaced monthly year-over-year (YoY) growth experienced thus far in 2022, with demand and higher prices both contributing factors (…). Apparel (+16.6%) and Jewelry (+18.6%) sales saw strong demand-driven YoY growth, well outpacing sector-specific inflation.”
In addition:
“Travel remains a priority, with Lodging up +29.6% YoY and Airline sales up +13.3% YoY.”
Furthermore:
“While in-store sales remain elevated, up +11.1% YoY/ +13.9% Yo3Y, e-commerce posted its first month of double-digit sales growth (+11.7% YoY) since December.”
Thus, while online spending surged during the pandemic and then decelerated as COVID-19 restrictions abated, in-store transactions remained robust, and e-commerce is now making a comeback. As such, the consensus doesn’t realize that the Fed’s war against inflation will be one of attrition.
Please see below:
Too Loose
Another critical factor is how tighter financial conditions, higher real yields, and a stronger U.S. dollar often go hand in hand. Therefore, while the latter two played their parts on Aug. 5, some metrics are still too loose for the Fed to materially reduce inflation.
Please see below:
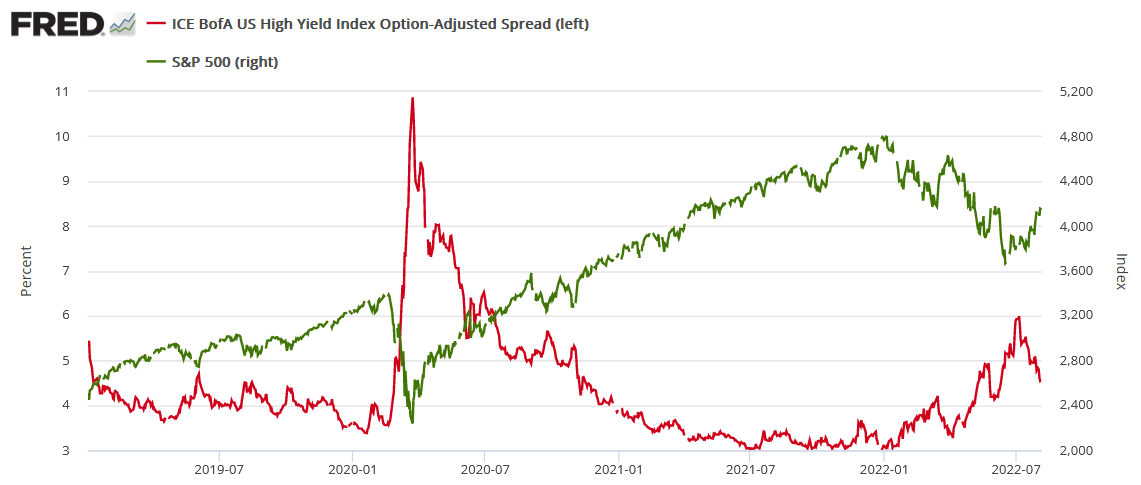
To explain, the red line above tracks the high yield option-adjusted spread (OAS), while the green line above tracks the S&P 500. For context, the OAS is the interest rate above U.S. Treasury yields that investors require to own the riskiest U.S. debt.
If you analyze the right side of the chart, you can see that the metric has declined sharply over the last month. As a result, it’s cheaper for risky companies to obtain financing, and the development supports economic growth.
Furthermore, with the S&P 500 often moving in the opposite direction, you can see how a declining OAS helped embolden the equity bulls (as evidenced by the green line rising on the right side of the chart). However, if the Fed wants to curb inflation, it needs a higher OAS and a lower S&P 500, and a realization is bearish for the PMs.
Hiding in Plain Sight
While the headline Consumer Price Index (CPI) may show a deceleration on Aug. 10 due to lower oil and gas prices, I’ve noted how corporate earnings calls have been riddled with mentions of inflation and price increases. Moreover, with Honeywell – an industrial conglomerate with a nearly $130 billion market cap – releasing its second-quarter earnings on Jul. 28, the data remains troublesome.
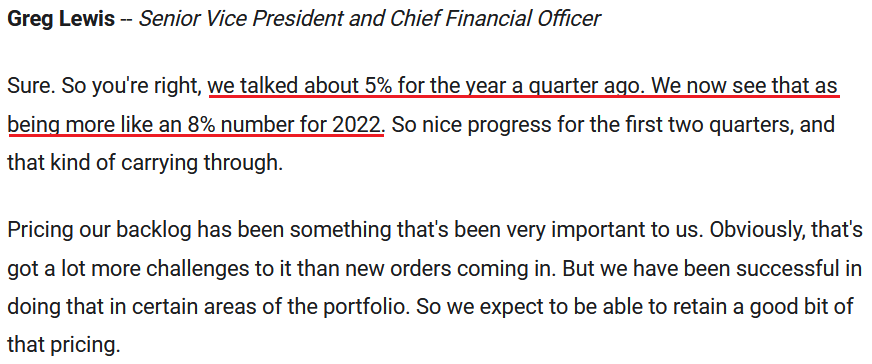
For example, when asked about the recent decline in commodity prices, CFO Greg Lewis said:
“There are some commodities that are seeing some of that deflation. But overall, for our total portfolio of direct materials, that's sort of cherry picking. And overall, we still see a net increase.”
As such, Honeywell is now pricing its products ahead of the guidance management gave in Q1.
Please see below:
 Source: Honeywell/The Motley Fool
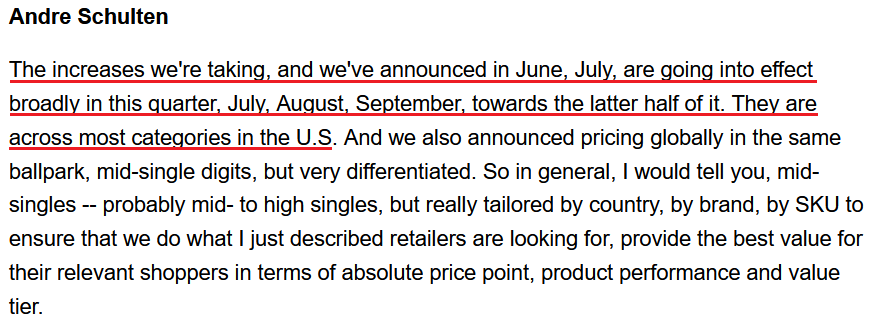
Likewise, Procter & Gamble (P&G) released its fourth-quarter earnings on Jul. 29. For context, it’s one of the largest consumer products companies in the world with a nearly $350 billion market cap. CFO Andre Schulten said during the Q2 earnings call:
“The combined YoY profit headwinds from foreign exchange rates, freight costs, materials, fuel, energy and wage inflation are an even greater challenge in fiscal '23 than they were in fiscal '22. Based on current spot prices and supply contracts, we estimate commodities, raw materials and packaging material costs to be a $2.1 billion after-tax headwind in fiscal 2023.”
He added:
“Moving to the April-June quarter, organic sales grew 7%. Pricing contributed eight points to organic sales growth as additional price increases reached the market.”
Thus, while P&G raised its prices by 8% in Q4, more hikes are coming. As a result, the realities on the ground are nowhere near the Fed’s 2% goal.
Please see below:
 Source: P&G/Seeking Alpha
The Bottom Line
While reality returned to the financial markets on Aug. 5, asset prices are far from reflecting their fundamental values. With the Fed hawked up and a material reduction in demand the only way to normalize inflation, the medium-term ramifications are nowhere near priced in. Therefore, gold, silver, and mining stocks should suffer mightily as the hawkish realities hover over the financial markets in the months ahead.
In conclusion, the PMs declined on Aug. 5, as strong payrolls elicited fears of a more hawkish Fed. However, with the ‘buy the dip crowd’ hitting the bid in the afternoon, their faith in a “soft landing” was on full display. However, with nearly 70 years of data suggesting otherwise, harsh lessons should be learned over the medium term.
Thank you for reading our free analysis today. Please note that the above is just a small fraction of the full analyses that our subscribers enjoy on a regular basis. They include multiple premium details such as the interim targets for gold and mining stocks that could be reached in the next few weeks. We invite you to subscribe now and read today’s issue right away.
Sincerely,
Przemyslaw Radomski, CFA
Founder, Editor-in-chief -
Investors Strike Back in Favor of the Gold Market
August 5, 2022, 9:19 AMAvailable to premium subscribers only.
-
Is Gold Resting Before the Next Phase of Major Decline?
August 4, 2022, 7:30 AMThe situation in the precious metals market continues to develop in tune with my previous expectations, and the profits on our short position in junior miners have just increased (and this happened soon after we took profits from previous long positions).
Since the above is the case, practically everything that I wrote yesterday remains up-to-date, and thus, today’s analysis will serve as a quick update. Let’s start with the USD Index and my previous comments on it:
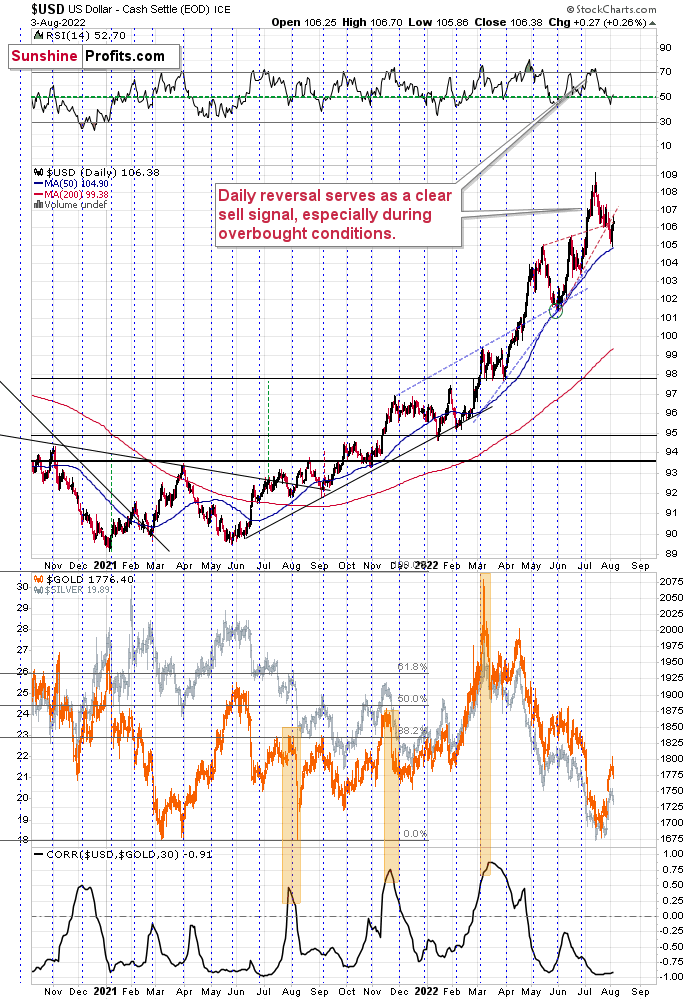
This move is in tune with what we saw at previous local bottoms. The RSI moved slightly below 50, and it’s the turn of the month – this combination was enough to trigger rallies in the U.S. dollar index.
Let’s keep in mind that the latter tends to form important bottoms close to the middle of the year.
So, the scenario in which the USD Index bottoms shortly (or that it just bottomed) seems quite likely.
There’s also the possibility that the USD Index keeps declining until it reaches the very strong support at about the 104 level – the previous long-term highs. Right now, it’s at about 105.5, which means that it could decline by another 1.5 index points or so. It doesn’t necessarily mean that gold, silver, and mining stocks would need to rally substantially if the above materialized. Conversely, since gold might now be reluctant to react to the USD’s lead and miners might be reluctant to react to gold’s lead, it seems that the possible upside for junior miners is very limited.
In other words, even if the big decline really picks up in a few weeks, I think that the risk-to-reward ratio already favors being on the short side of the precious metals sector. In particular, on the short side of junior mining stocks.
That’s exactly what happened.
The USD Index declined quite visibly yesterday [on Tuesday], almost reached its 50-day moving average, and then rallied back up – very close to the turn of the month.
Was that the final short-term bottom? It might have been, but it could still be the case that it moves to 104 in order to bottom there. However, even if that happens, it won’t change the fact that gold didn’t want to react to lower USDX prices recently, and thus the additional decline in the USDX would only be likely to trigger back-and-forth movement in gold, not a profound rally.
As far as gold is concerned, I previously wrote the following:
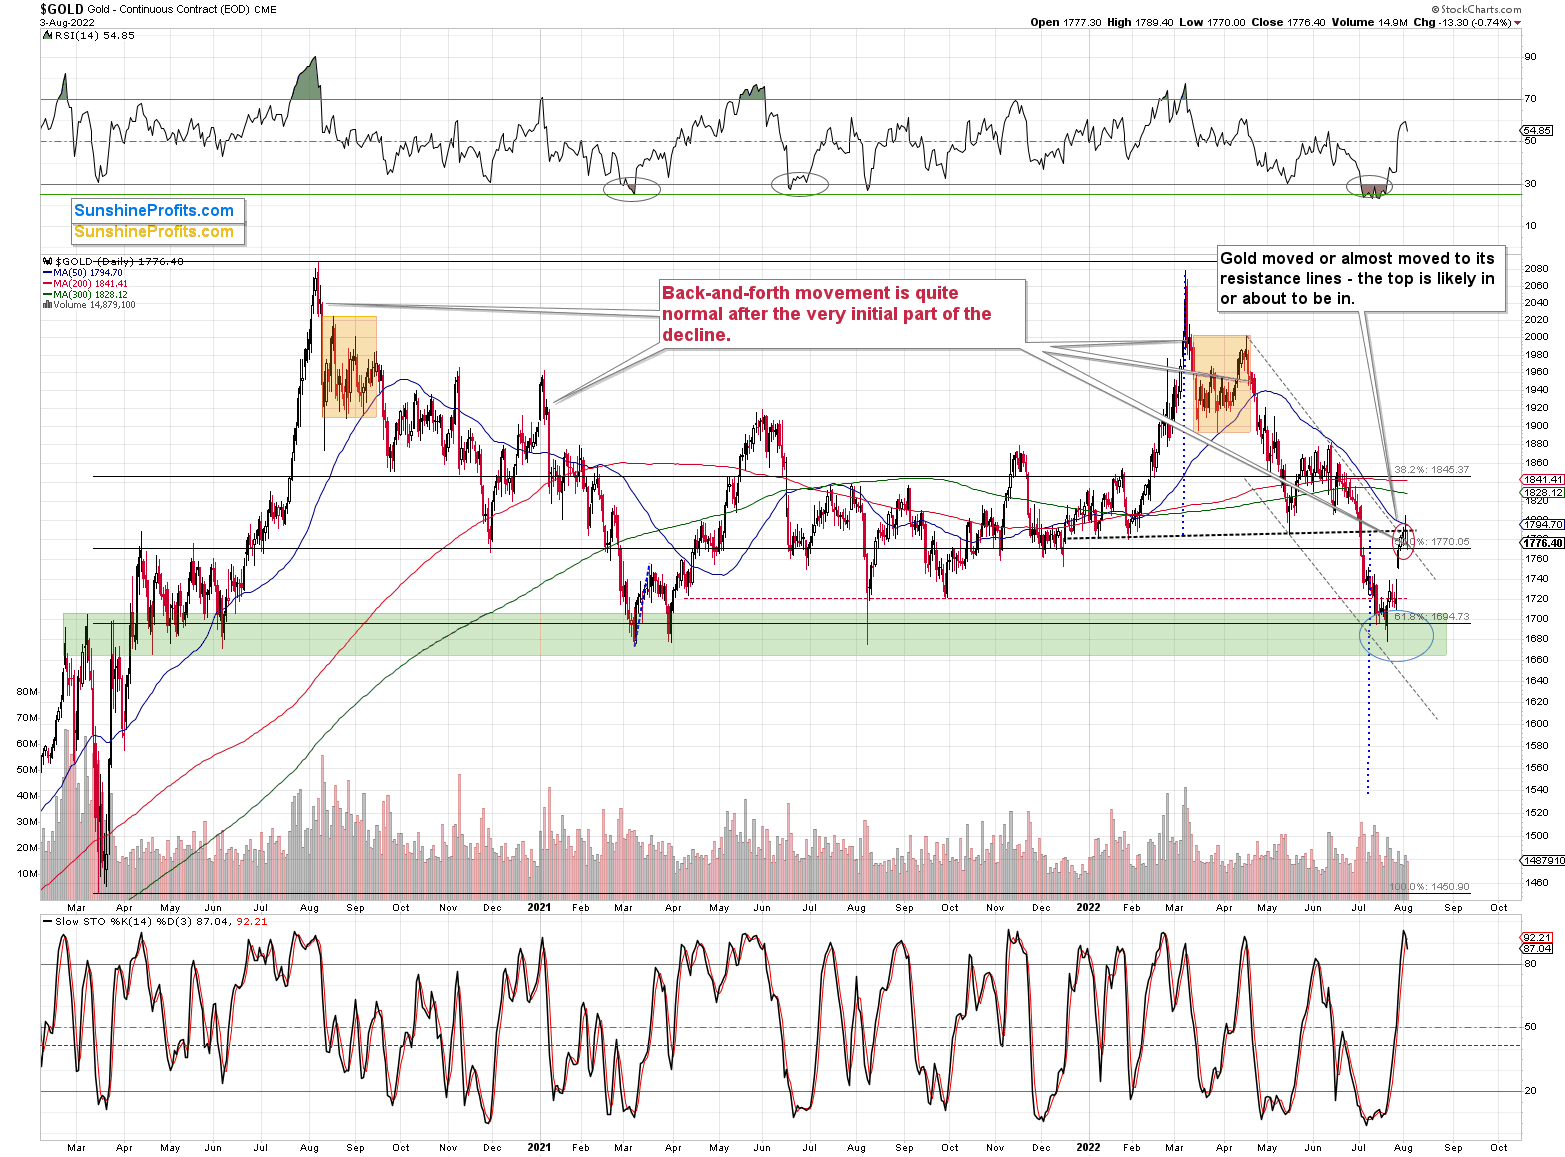
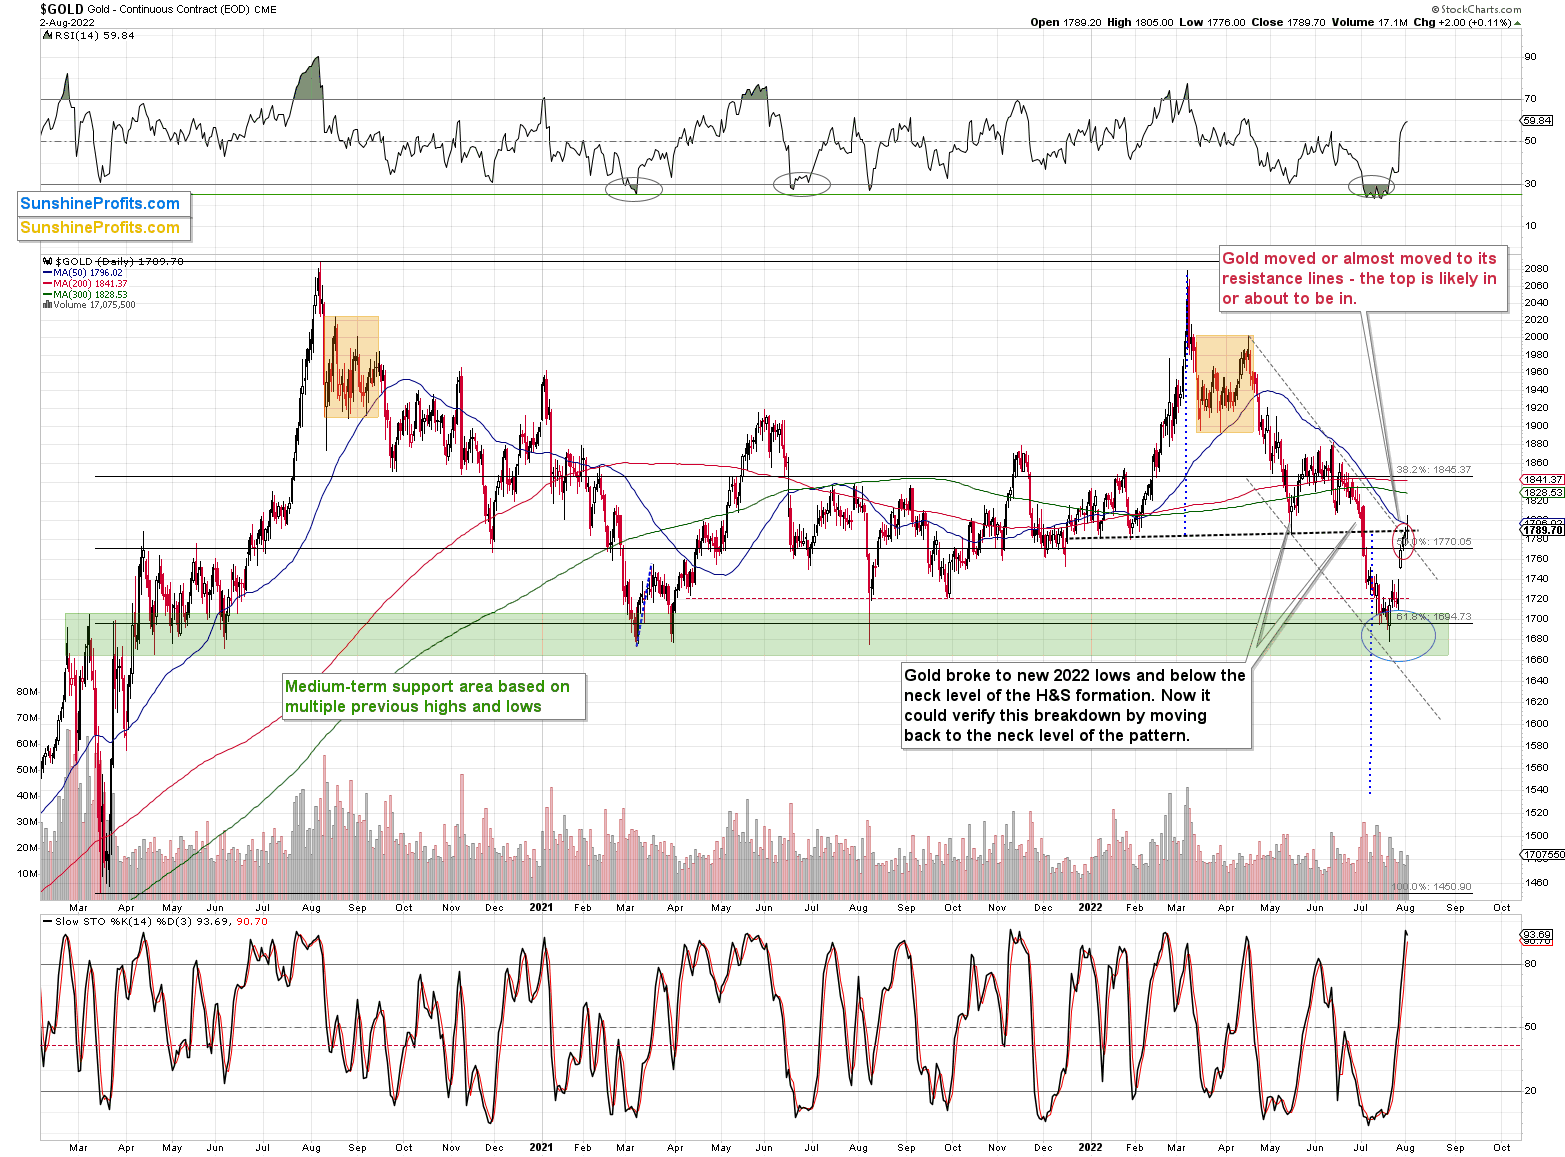
The above gold futures chart doesn’t fully show the extent of yesterday’s decline (the data will likely catch up after today’s session), but it does tell us that gold just verified the move back to the neck level of the previously broken head and shoulders pattern. A decline from here will have profoundly bearish implications because, based on this pattern, gold is likely to decline to at least $1,540.
Indeed, the above chart shows a decline in gold futures and some intraday back-and-forth movement. Please note that this kind of movement is what tends to take place right after the very first part of a bigger decline. I featured some of those cases on the above chart (pointers coming from the red comment box).
Consequently, what we see right now is bearish. Moreover, if we don’t see a decline today, it will be in tune with what we saw previously.
While the GLD ETF moved higher by 0.24% yesterday, the GDXJ ETF – a proxy for junior mining stocks – declined by 1.72% (in terms of the daily closing prices).
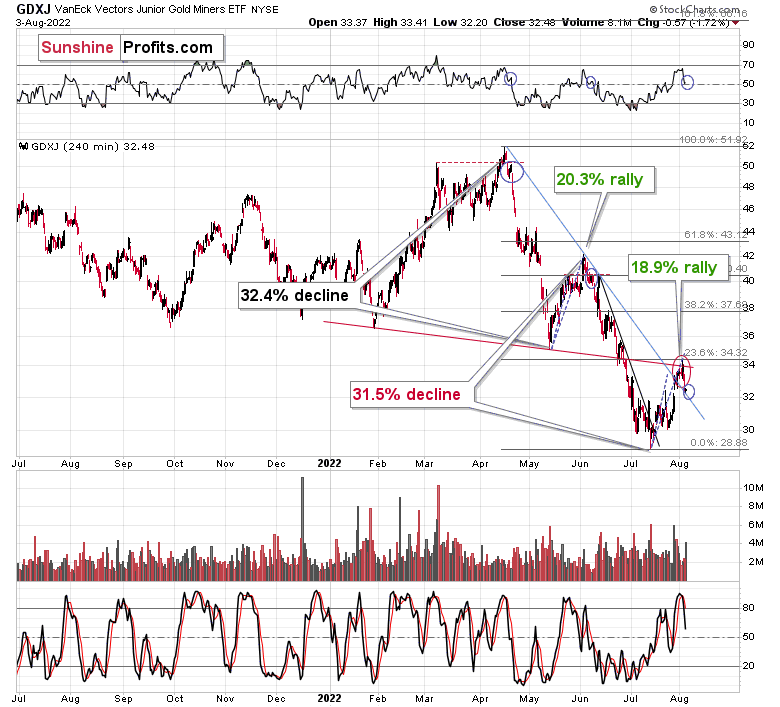
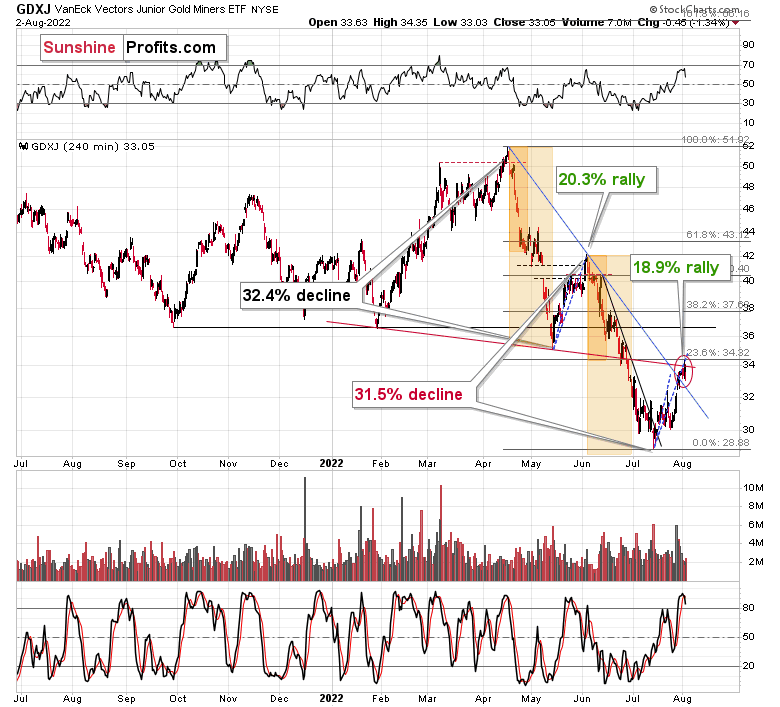
After moving to the 23.6% Fibonacci retracement level and above the neck level of the previously broken head and shoulders pattern, the GDXJ declined, and ended the day 1.34% higher, thus making our short positions profitable.
The stochastic indicator flashed a sell signal, and there were only a few times this year when that happened, while the RSI was very close to the 70 level. That was during the March, April, and early-June peaks. These were all important tops, and the two most recent ones were followed by significant short-term declines. It seems that we’re likely to see one once again.
This means that my previous comments on the above chart remain up-to-date.
What’s also quite interesting on the above chart is the similarity between the recent upswing and the one that we saw in May and early June. In fact, even the timing relative to the days of the month is similar.
The previous rally started right before the middle of May, while the current upswing began just before the middle of July. The previous one consisted of two smaller rallies, which I marked with blue dashed lines and copied to the current situation. The first part of the move that we saw in July was not as big as in May, but the timing of the reversals was almost identical.
The second small rally is also aligned – at least so far. If this self-similar pattern is to continue, junior mining stocks are likely to top any day now, and the same goes for other mining stocks, silver, and gold. In fact, perhaps they have just topped.
Please note that juniors paused at their declining support line, and this support could trigger a small upswing, but it’s likely to be too small to justify any changes in trading positions. In fact, a pause after the initial part of the decline is normal in the case of junior miners (just like it is for gold). I marked the previous similar cases with blue ellipses. We saw something similar (with RSI at similar levels) in mid-April and in early June. The declines resumed after a quick pause, and I expect something similar to happen again this time.
Please note how silver verified its breakdown below the $20 level and the May bottom.
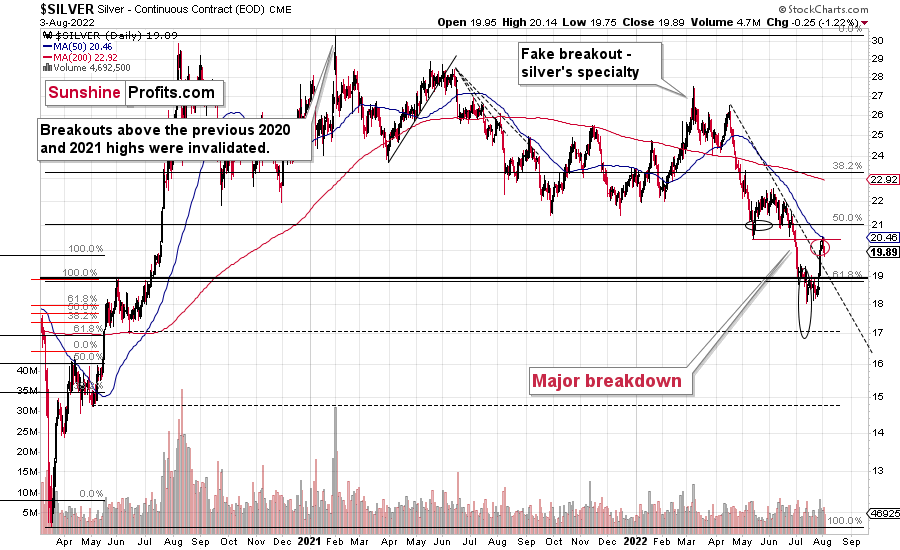
This is a textbook example of what breakdown verification should look like.
Also, as you may recall, silver and mining stocks (in particular, junior mining stocks) tend to be influenced by the performance of the general stock market.
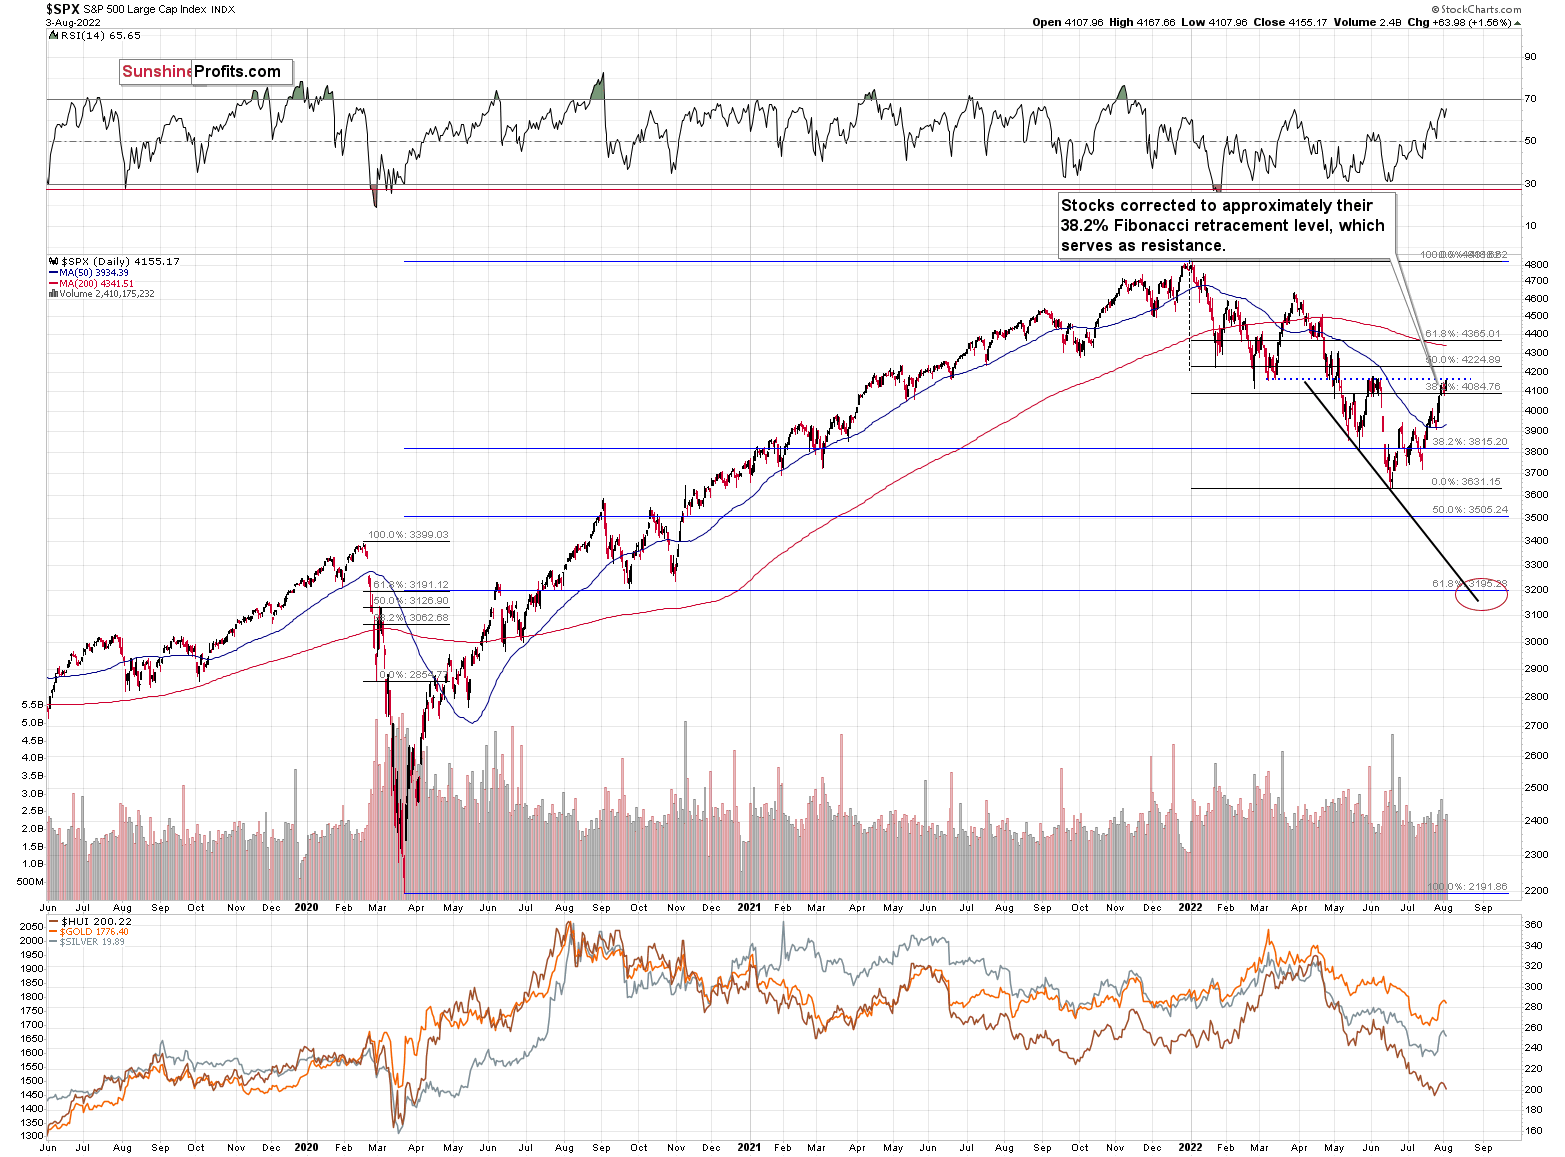
Interestingly, the S&P 500 index has just moved to its previous highs and March lows. This resistance might cause this rally to end. Consequently, silver and miners might get another bearish push soon (not necessarily immediately, though).
Thank you for reading our free analysis today. Please note that the above is just a small fraction of the full analyses that our subscribers enjoy on a regular basis. They include multiple premium details such as the interim targets for gold and mining stocks that could be reached in the next few weeks. We invite you to subscribe now and read today’s issue right away.
Sincerely,
Przemyslaw Radomski, CFA
Founder, Editor-in-chief -
Taiwanese-Chinese News Won’t Reverse Gold’s Downward Trend
August 3, 2022, 7:27 AMLet’s start today’s analysis with a question that just hit our inbox, as it provides a good intro to today’s technical discussion:
Q: I really appreciate your services and technical support. Do you think the Pelosi/Taiwan news is giving gold and junior miners a bump? If so, how long will the bump last? It looks like Biden might be lifting China tariffs in exchange for Pelosi’s visit to Taiwan. What effects does lifting China’s tariffs have on PM and junior miners?
A: The bump is probably over – the visit had already started and there were no military repercussions.
If Biden is going to lift China’s tariffs, it’s likely to contribute to further declines in the precious metals sector. Why? Because it means greater cooperation and peace in general. Geopolitical conflicts tend to cause gold to rally, at least temporarily. Consequently, when conflicts de-escalate, it’s likely to remove some of the safe-haven appeal that gold (and the rest of the sector) has.
Please note how remarkable it is that technical tools can provide us with insights as to what’s likely to happen even before we get to know what the direct reason for a given move is.
How could that be the case? Because it is not the news itself that drives the price, but rather the news that is filtered through what people want to react to based on emotional/technical grounds.
You know what, let’s make today’s issue a bit more interactive.
In order to show you how the above works in practice, let’s do a quick exercise (no worries, you won’t have to even change the position in which you are at the moment of reading these words, and it will take less than 2 minutes).
Okay, please take 20-30 seconds or look around the room/space you are in right now and memorize all items that are red – as if you had to list as many as possible shortly.
I don’t want you to see the following part of the exercise yet, so I’ll put many dots below. Please scroll down only after you complete the above part of the exercise and you have memorized as many red items as possible in 20-30 seconds.
.
.
.
.
.
.
.
.
.
.
.
.
.
.
.
.
.
.
.
.
.
.
.
.
.
.
.
.
.
.
.
.
.
.
.
.
.
.
.
.
.
.
.
.
.
.
.
Now, for the second (and final) part of the exercise, immediately after finishing this sentence (don’t look around again), please close your eyes, and check how many blue items you can recall (yes, blue, not red).
.
.
.
.
.
.
So, how was it?
Most people say that it was difficult to recall items in a different color because when they focused on one color, everything else was out of focus and was more or less ignored.
It’s the same with pretty much anything – including how the markets react to news.
When markets really “want” to move in a certain direction because of emotional/technical/cyclical reasons, it’s as if they were focusing on the “red items”. If a piece of news comes out that confirms this narrative (it supports the original expectation = “it’s red”), then the markets will react strongly. However, if they see something that contradicts it (against the narrative = “blue”), then they either react only a little, or not at all, or only briefly.
By the way, that’s why it’s a good idea to practice gratitude – one’s brain is then focused on noticing good things, and thus life becomes more beautiful and pleasant.
Yesterday’s news resulted in price moves that were likely to happen, not because of “magic”, but because these reversals (or something similarly bearish) were likely to happen anyway. The news just happened to fit.
However, since it’s not as simple as “gold reverses on Pelosi visit,” the majority of people writing about markets won’t be able to forecast the reversal beforehand.
Here’s what I wrote about the USD Index previously:

This move is in tune with what we saw at previous local bottoms. The RSI moved slightly below 50, and it’s the turn of the month – this combination was enough to trigger rallies in the U.S. dollar index.
Let’s keep in mind that the latter tends to form important bottoms close to the middle of the year.
So, the scenario in which the USD Index bottoms shortly (or that it just bottomed) seems quite likely.
There’s also the possibility that the USD Index keeps declining until it reaches the very strong support at about the 104 level – the previous long-term highs. Right now, it’s at about 105.5, which means that it could decline by another 1.5 index points or so. It doesn’t necessarily mean that gold, silver, and mining stocks would need to rally substantially if the above materialized. Conversely, since gold might now be reluctant to react to the USD’s lead and miners might be reluctant to react to gold’s lead, it seems that the possible upside for junior miners is very limited.
In other words, even if the big decline really picks up in a few weeks, I think that the risk-to-reward ratio already favors being on the short side of the precious metals sector. In particular, on the short side of the junior mining stocks.
That’s exactly what happened.
The USD Index declined quite visibly yesterday, almost reached its 50-day moving average, and then rallied back up – very close to the turn of the month.
Was that the final short-term bottom? It might have been, but it could still be the case that it moves to 104 in order to bottom there. However, even if that happens, it won’t change the fact that gold didn’t want to react to lower USDX prices recently, and thus the additional decline in the USDX would only be likely to trigger back-and-forth movement in gold, not a profound rally.
The above gold futures chart doesn’t fully show the extent of yesterday’s decline (the data will likely catch up after today’s session), but it does tell us that gold just verified the move back to the neck level of the previously broken head and shoulders pattern. A decline from here will have profoundly bearish implications because, based on this pattern, gold is likely to decline to at least $1,540.
While the GLD ETF declined by 0.59% yesterday, the GDXJ ETF – a proxy for junior mining stocks – declined by 1.34% (in terms of the daily closing prices).
After moving to the 23.6% Fibonacci retracement level and above the neck level of the previously broken head and shoulders pattern, the GDXJ declined, and ended the day 1.34% higher, thus making our short positions profitable.
The stochastic indicator flashed a sell signal, and there were only a few times this year when that happened, while the RSI was very close to the 70 level. That was at the March, April, and early-June peaks. These were all important tops, and the two most recent ones were followed by significant short-term declines. It seems that we’re likely to see one once again.
This means that my previous comments on the above chart remain up-to-date.
What’s also quite interesting on the above chart is the similarity between the recent upswing and the one that we saw in May and early June. In fact, even the timing relative to the days of the month is similar.
The previous rally started right before the middle of May, while the current upswing began just before the middle of July. The previous one consisted of two smaller rallies, which I marked with blue dashed lines and copied to the current situation. The first part of the move that we saw in July was not as big as in May, but the timing of the reversals was almost identical.
The second small rally is also aligned – at least so far. If this self-similar pattern is to continue, junior mining stocks are likely to top any day now, and the same goes for other mining stocks, silver, and gold. In fact, perhaps they have just topped.
Thank you for reading our free analysis today. Please note that the above is just a small fraction of the full analyses that our subscribers enjoy on a regular basis. They include multiple premium details such as the interim targets for gold and mining stocks that could be reached in the next few weeks. We invite you to subscribe now and read today’s issue right away.
Sincerely,
Przemyslaw Radomski, CFA
Founder, Editor-in-chief


Gold Investment News
Delivered To Your Inbox
Free Of Charge
Bonus: A week of free access to Gold & Silver StockPickers.
Gold Alerts
More-
Status
New 2024 Lows in Miners, New Highs in The USD Index
January 17, 2024, 12:19 PM -
Status
Soaring USD is SO Unsurprising – And SO Full of Implications
January 16, 2024, 8:40 AM -
Status
Rare Opportunity in Rare Earth Minerals?
January 15, 2024, 2:06 PM

