

Briefly: in our opinion, full (250% of the regular size of the position) speculative short positions in gold, silver and mining stocks are justified from the risk/reward perspective at the moment of publishing this Alert.
Remember the highly useful technique based on the vertexes of triangles? The ones that trigger reversals? In today’s analysis we’ll provide an update on the nearby reversal dates that are based on this particular technique. Interestingly, the reversal with the most confirmations, is relatively close…
Before moving to the above, let’s take a quick look at what happened yesterday, starting with gold.
Gold’s Dramatic Pause
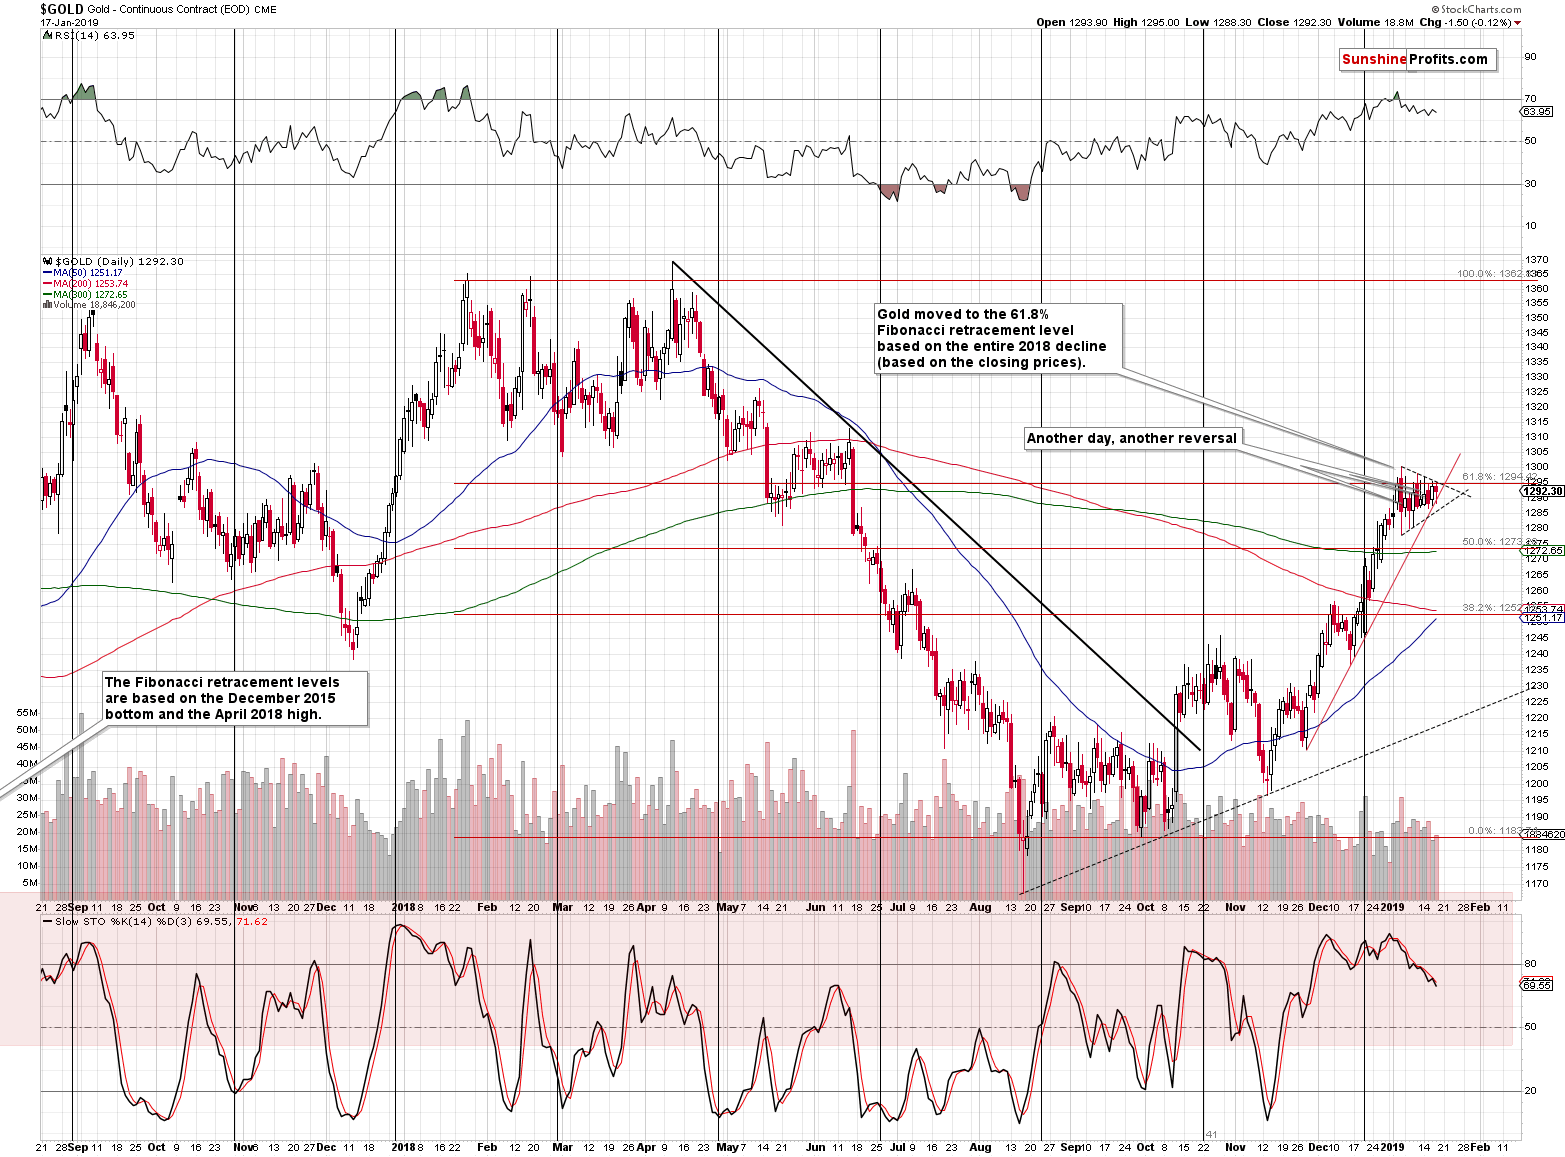
Gold remains within the short-term triangle pattern and above the rising, short-term support line. Consequently, nothing changed in terms of the outlook and our yesterday’s comments remain up-to-date:
No. Gold is moving back and forth within a triangular pattern and the fact that yesterday’s close was the second highest close of the year doesn’t change anything. The relatively low volume that accompanied the upswing (lowest daily volume of 2019) confirms it.
Gold received a lot of publicity and it was even Cramerized. And yet, the buying power appears to have almost dried up. Gold had a good reason to rally further, but it didn’t. If there are very few buyers left, who’s left to keep pushing the price higher?
Given positive news, gold was almost forced to rally and the fact that it was at its rising support level helped. But this rally was as weak as it gets. The volume was relatively low, there was no breakout and neither silver, nor mining stocks confirm the daily upswing.
Speaking of mining stocks, we saw a very meaningful pause yesterday.
Mining Stocks’ Confirmed Breakdowns and Indications
In yesterday’s analysis, we wrote the following:
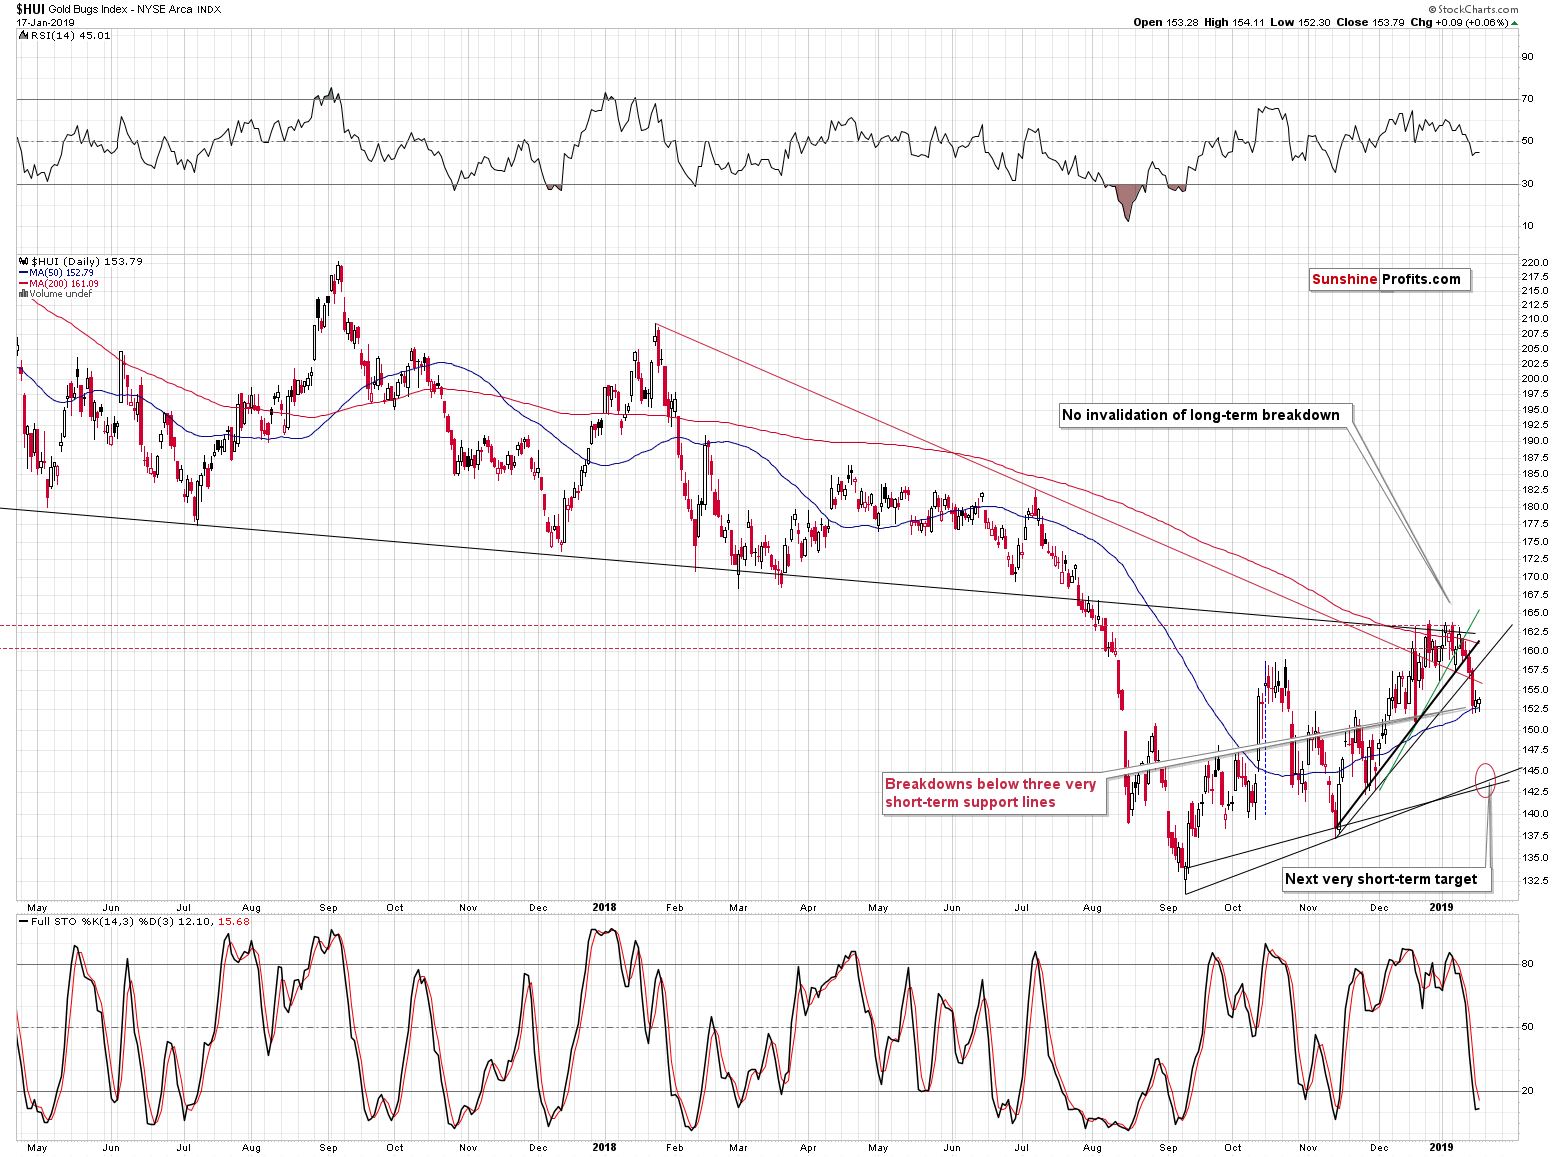
The HUI Index bounced a little, but since it was after a quite volatile drop, it would be natural for it to bounce more, just like it did in mid-December 2018. This is a bearish signal, confirming precious metals market’s weakness.
The same goes for the fact that the all previously mentioned short-term breakdowns are confirmed by two or more daily closing prices.
There is also another factor confirming the bearish outlook that we didn’t mention previously. The HUI Index invalidated the breakout above the declining red support/resistance line, just like it was likely to, since it reached much more important resistance levels.
The important thing about yesterday’s pause was not what happened, but what didn’t happen. There was no invalidation of any of the recent breakdowns. Instead, they are now all confirmed by three or more consecutive closing prices below the respective support lines. This means that they are all confirmed, and the strength of their bearish implications has just increased substantially.
Moreover, the tiny upswing in the GDX ETF that we saw yesterday took place on very low volume, further confirming our points from yesterday:
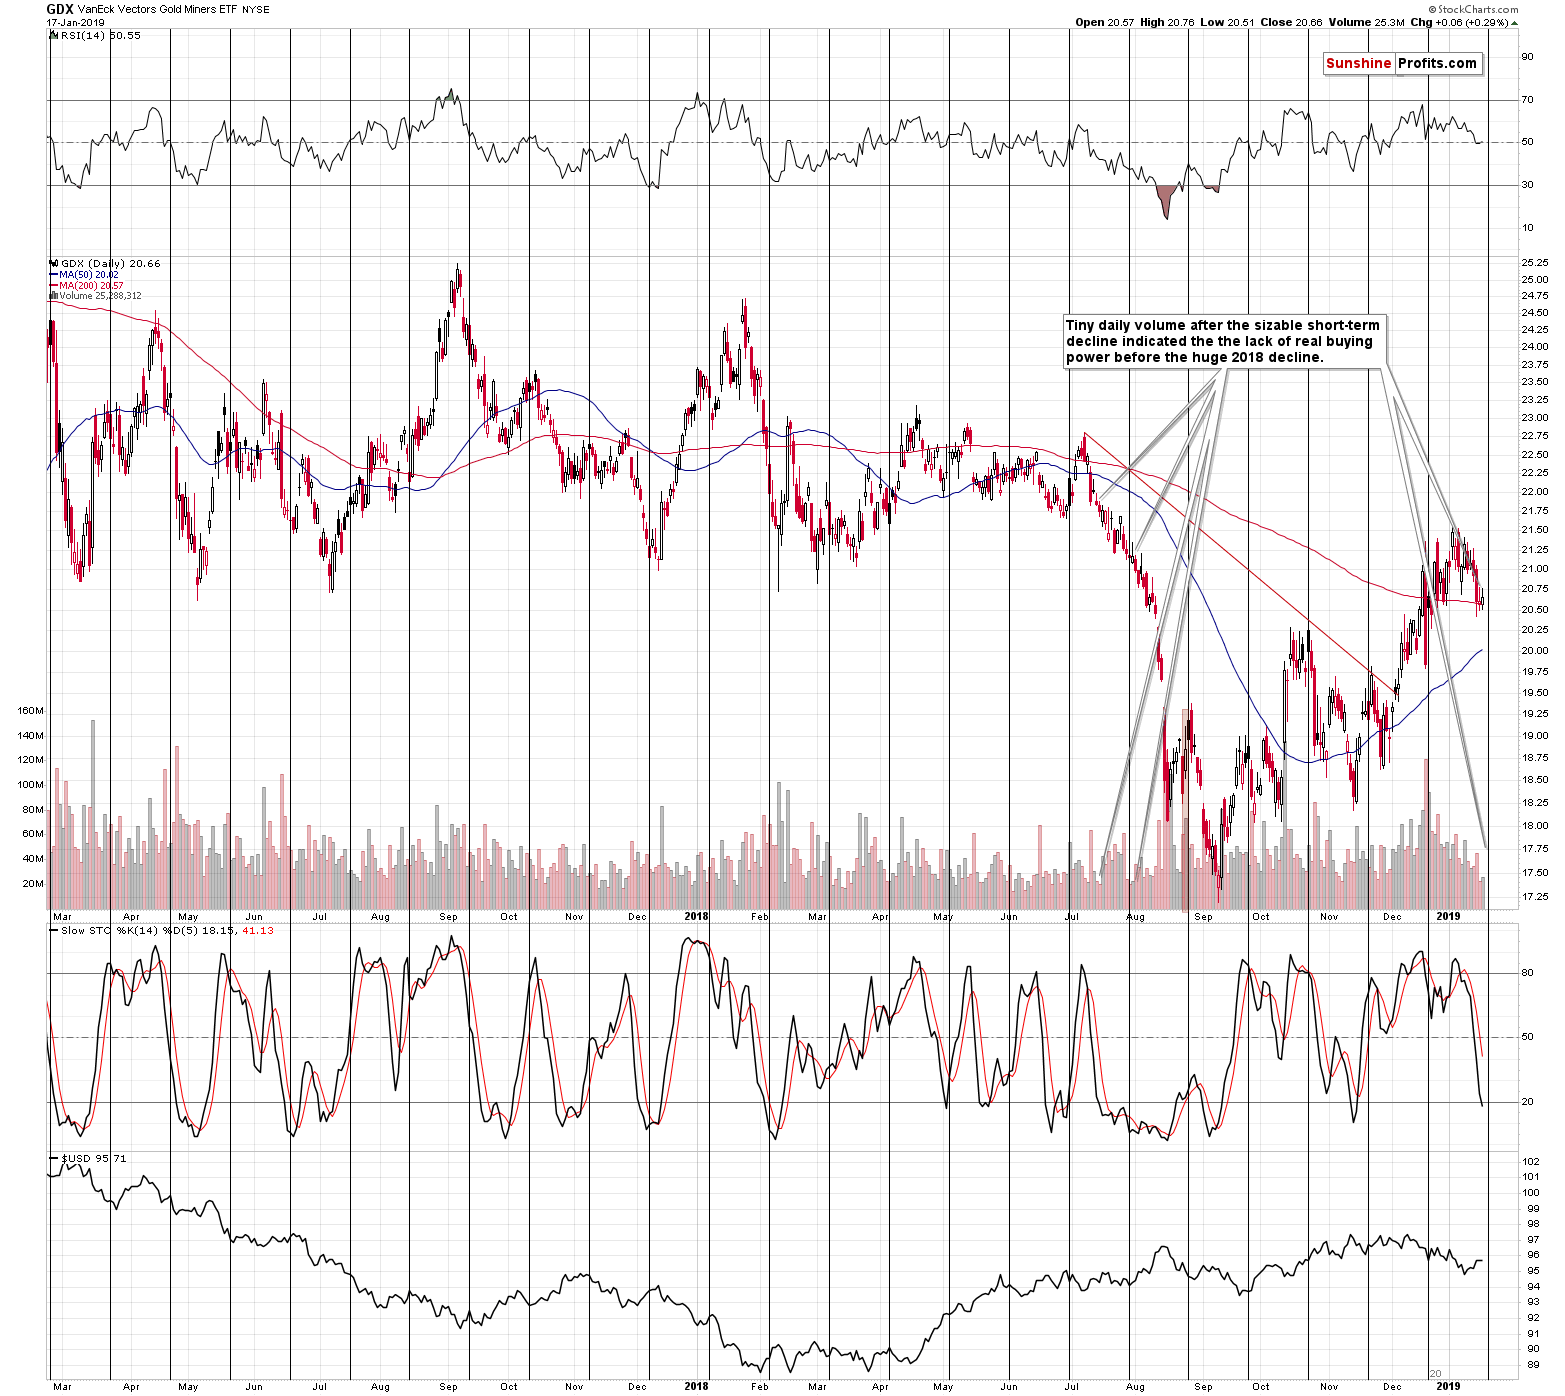
The above-mentioned analogy is between now and what happened in July 2018. There were two cases when gold miners paused on volume that was almost just as small as yesterday’s one. The first case from the middle of July is even more important because it was shortly after the initial – and volatile – part of the decline. That’s exactly where mining stocks are right now.
These moves heralded further deterioration in the mining stock prices as they showed that very few people wanted to bet against the downtrend. With little buying power, the price was set for a big drop in July. And it’s set for a big drop now as well.
Silver moved lower yesterday, and the interpretation of this move is also in tune with what we wrote yesterday:
Silver’s Analogy to the Previous Tops
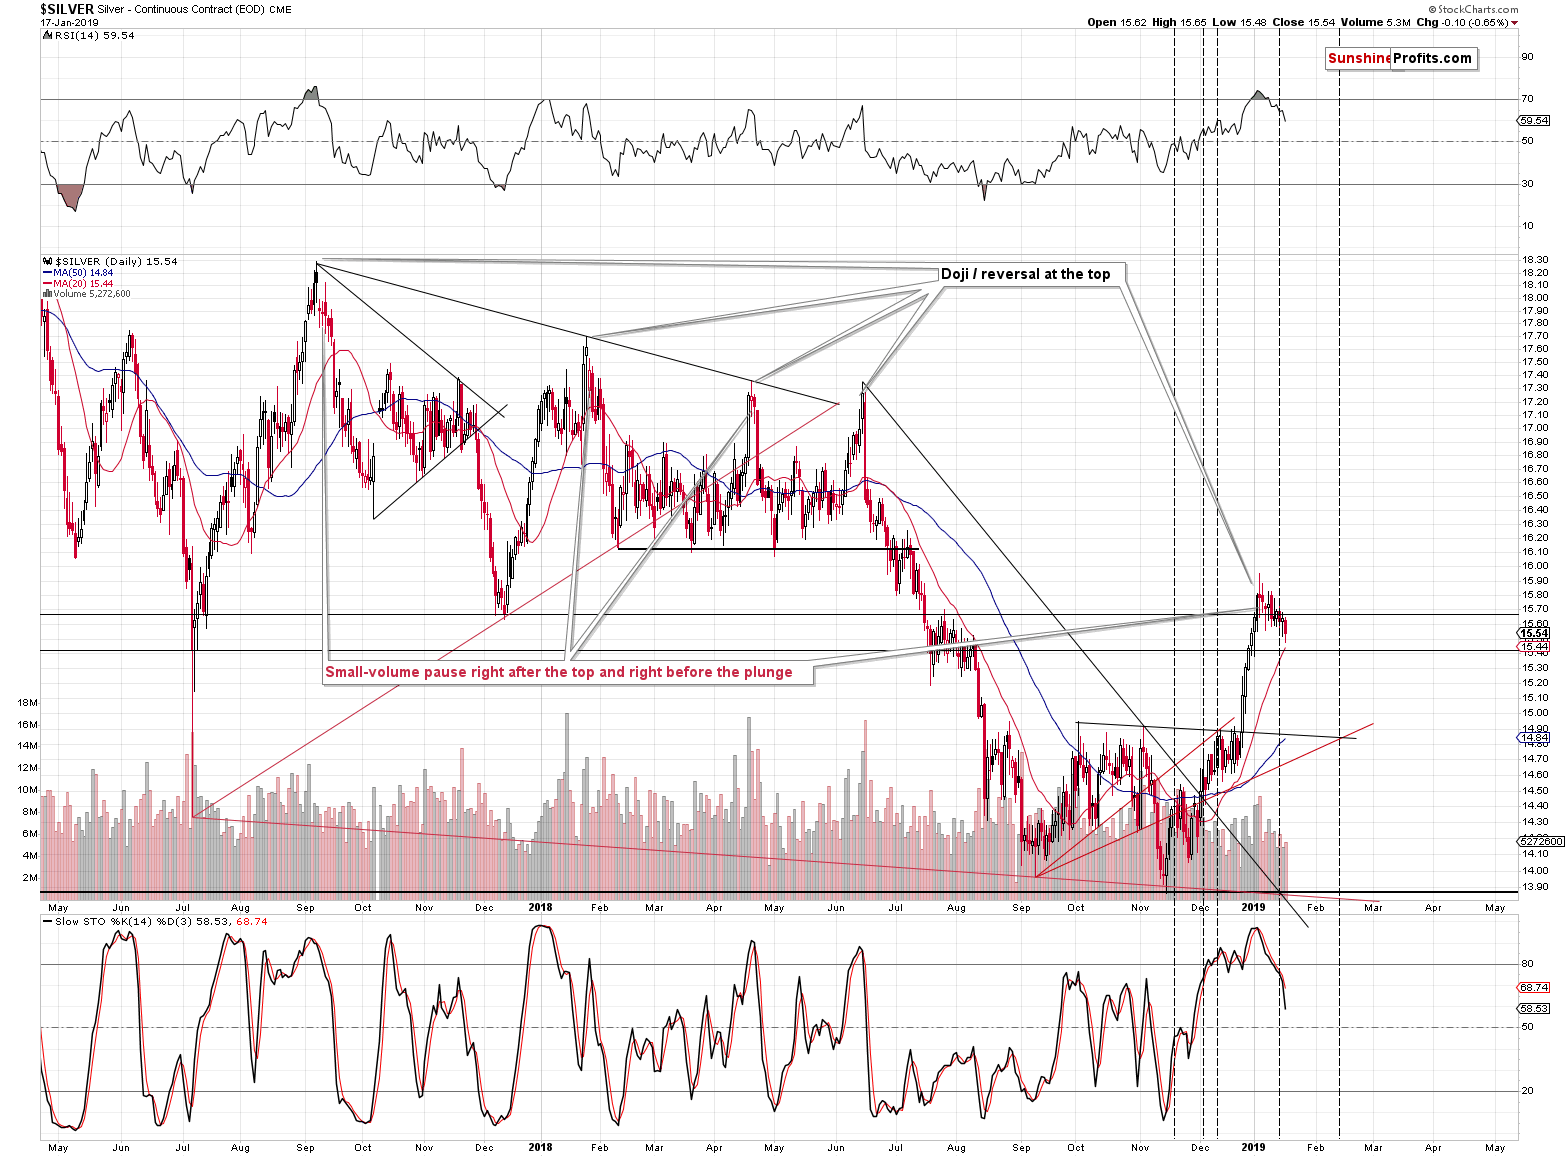
(…) Taking the previous four important tops into account, we see that two of them were not followed by an immediate slide, but rather by a consolidation. Both: September 2017 and January 2018 tops were first followed by a rather steady decline. The slide accelerated only after several days of the less volatile movement.
If something like what we’re seeing right now happened in case of half of the recent tops, then one shouldn’t view it as something odd, or bullish. It’s one of the normal ways for silver to form major tops.
Having said that, let’s take a look at the USD Index and changes within it.
The USD Index Update
Just like the precious metals, and mining stocks, the USD Index didn’t move much. Consequently, everything that we wrote previously on the USD Index remains up-to-date:
The USD Index didn’t do much yesterday, but since it’s currently the only very important factor that might point to higher gold and silver prices, we decided to take a closer look at it.
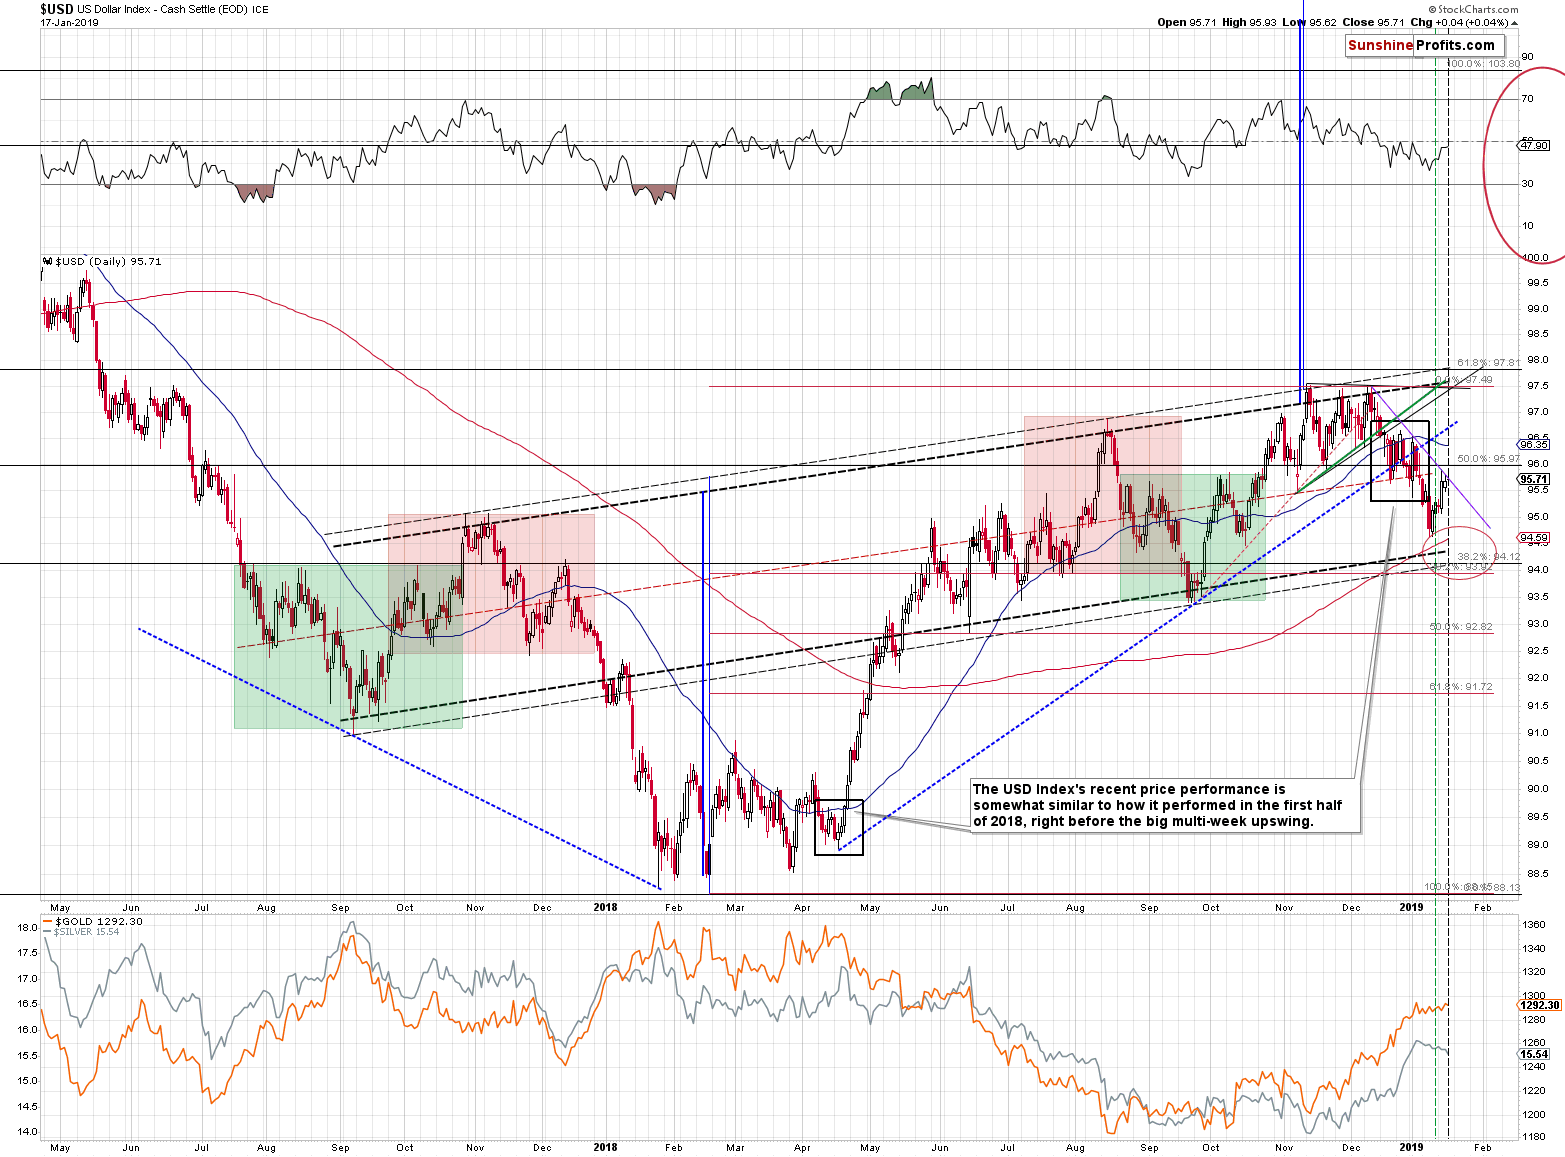
The two reasons that made a decline in the USDX likely are the fact that the USDX didn’t move to any strong support level before moving higher, and the vertex of the short-term triangle that suggests that we should see a turnaround more or less now.
The first reason is just as up-to-date as it was previously. The second reason, however, may be working a bit differently than we initially assumed. After closer inspection, it turns out that the rising support line creating the lower border of the triangle, could be based on different intraday bottoms. We marked this new border with green, while leaving the previous one in black. The “new” vertex was also emphasized with green (vertical, dashed line). The “new” reversal confirms that bottom that has already taken place, thus making it much more likely that the bottom is in for the USD Index after all.
To be clear, the previous scenario, in which the USD Index declines for several days, is still possible, especially that it didn’t move above its most short-term resistance line that we marked with purple.
Overall, the short-term picture for the USDX is quite complicated, but the bottom line is that while it’s still possible, it’s now more probable than it was before that there will be no additional slide in the USDX and thus no additional pop-up in the prices of precious metals and mining stocks.
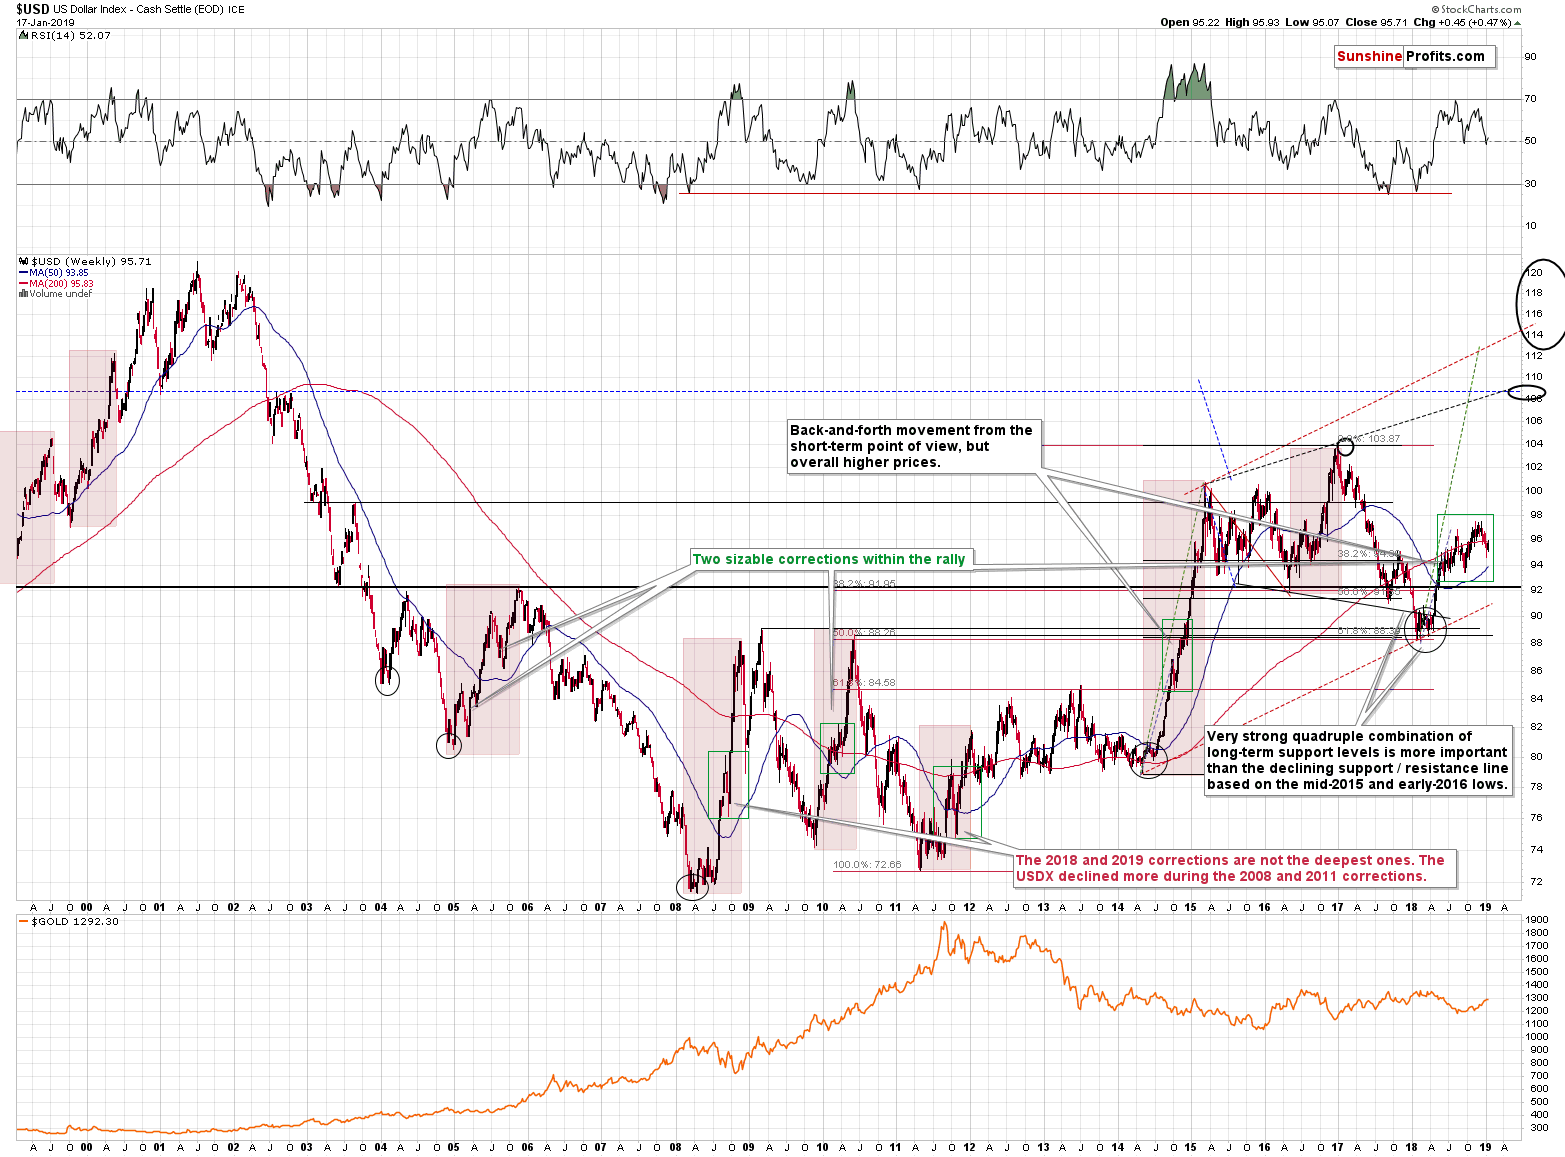
From the long-term point of view the December – January corrective downswing didn’t change anything. The USD Index still appears to be in a big, medium-term uptrend and even though we saw two bigger corrections within the current consolidation (marked with green rectangle), it didn’t invalidate the similarity to the previous big upswings that we marked with red.
In 2010 and in 2005 there were two bigger corrective downswings within the big rally as well. Moreover, the current consolidation doesn’t include a bigger decline than what we already saw. Both: 2008 and 2011 corrective downswings were bigger than the current one. Consequently, it’s clear that the current consolidation is relatively normal and not something that would break the bullish, medium-term pattern.
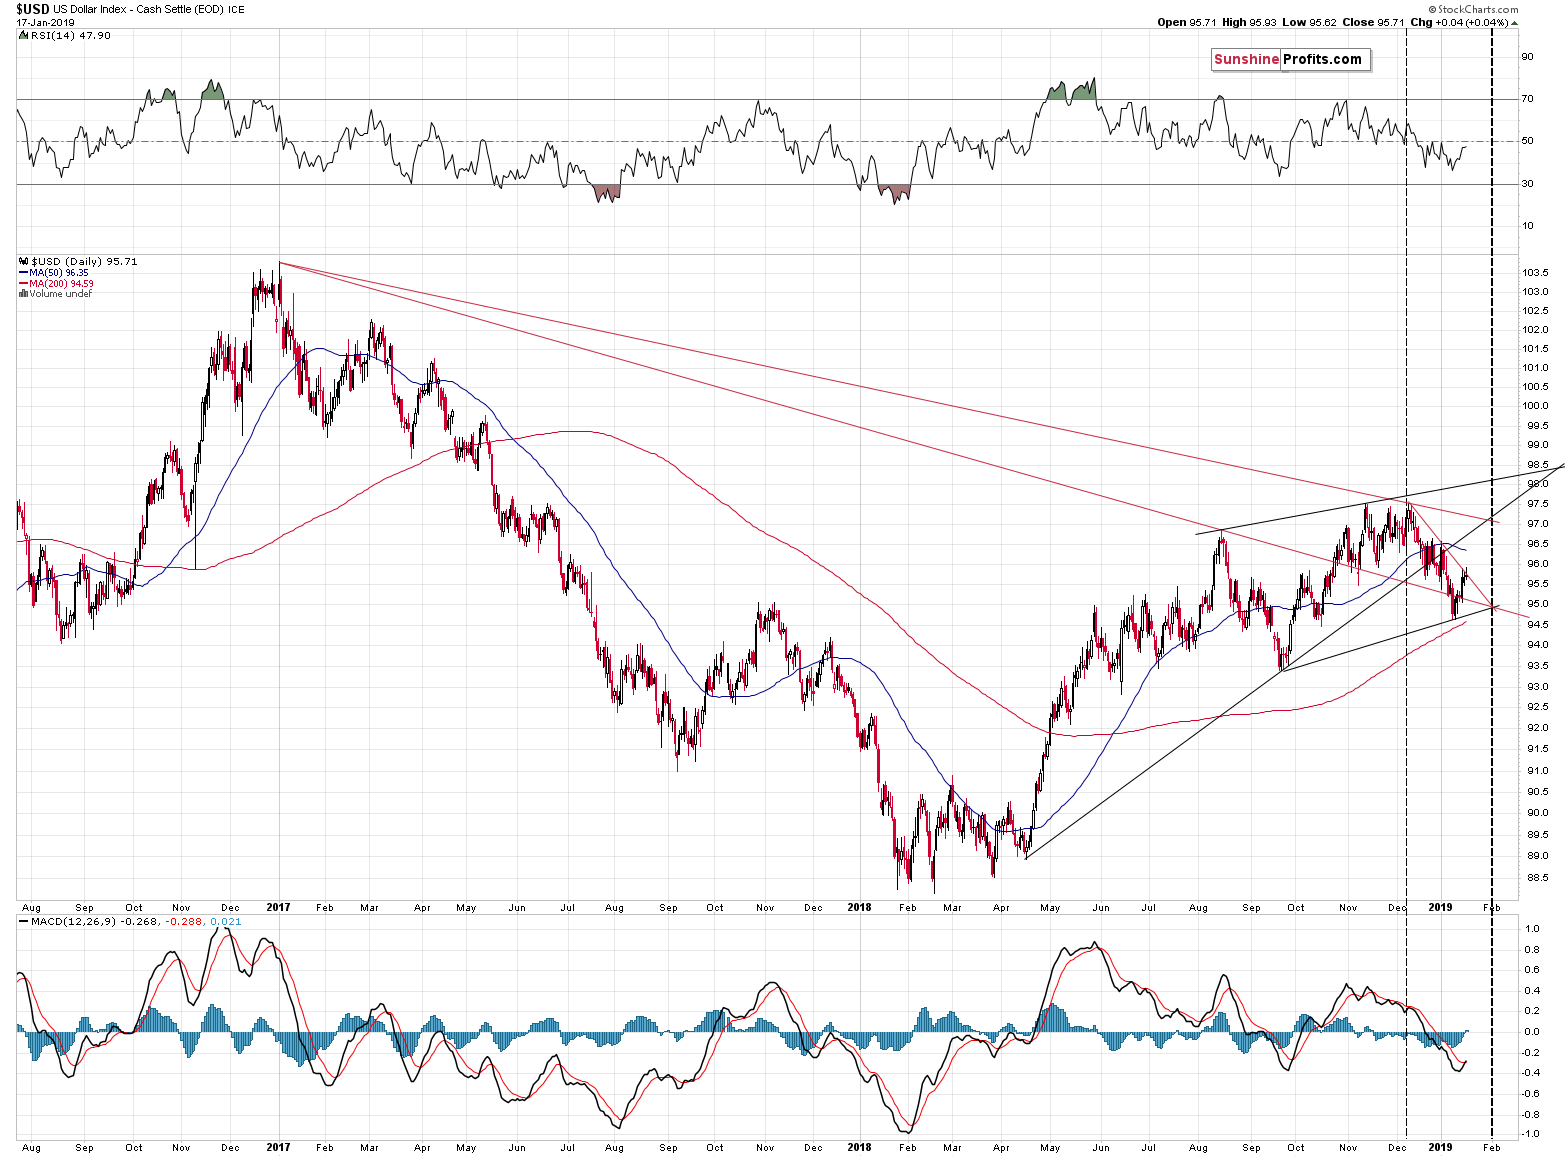
The medium-term outlook for the USD Index remains bullish, and the outlook for the short-term just improved. Once we see a confirmed breakout above the declining purple resistance line, it will be very likely that the USD can resume its big uptrend.
Summing up what we wrote so far today, the outlook for the precious metals sector deteriorated based on yesterday’s confirmations of breakdowns in mining stocks, but the short-term outlook for the USD Index remains tense, so we might see some volatility in it and in the PMs in the following days.
Having said that, let’s take a look at what we started today’s analysis with – the triangle-vertex-based reversals. Let’s start by saying that on Wednesday, we wrote about a strong vertex-based signal for the USD Index for the final part of January or for the early part of February.
Triangle-vertex-based Reversals
Namely, the USD Index is likely to reverse in a profound way at the end of January or in early days of February. Three vertexes confirm each other at that time. The previous vertex based on two of the lines creating the upcoming vertex indicated the December top, so it seems that it’s worth paying attention to this technique.
Knowing how miners performed yesterday and being aware of multiple bearish factors for the precious metals market, it seems that we might see a powerful USDX rally in the second part of the month. However, on a stand-alone basis, the USDX chart is not yet fully bullish.
The key think about the nearby triangle-vertex-based reversals in gold is that they fully confirm the above.
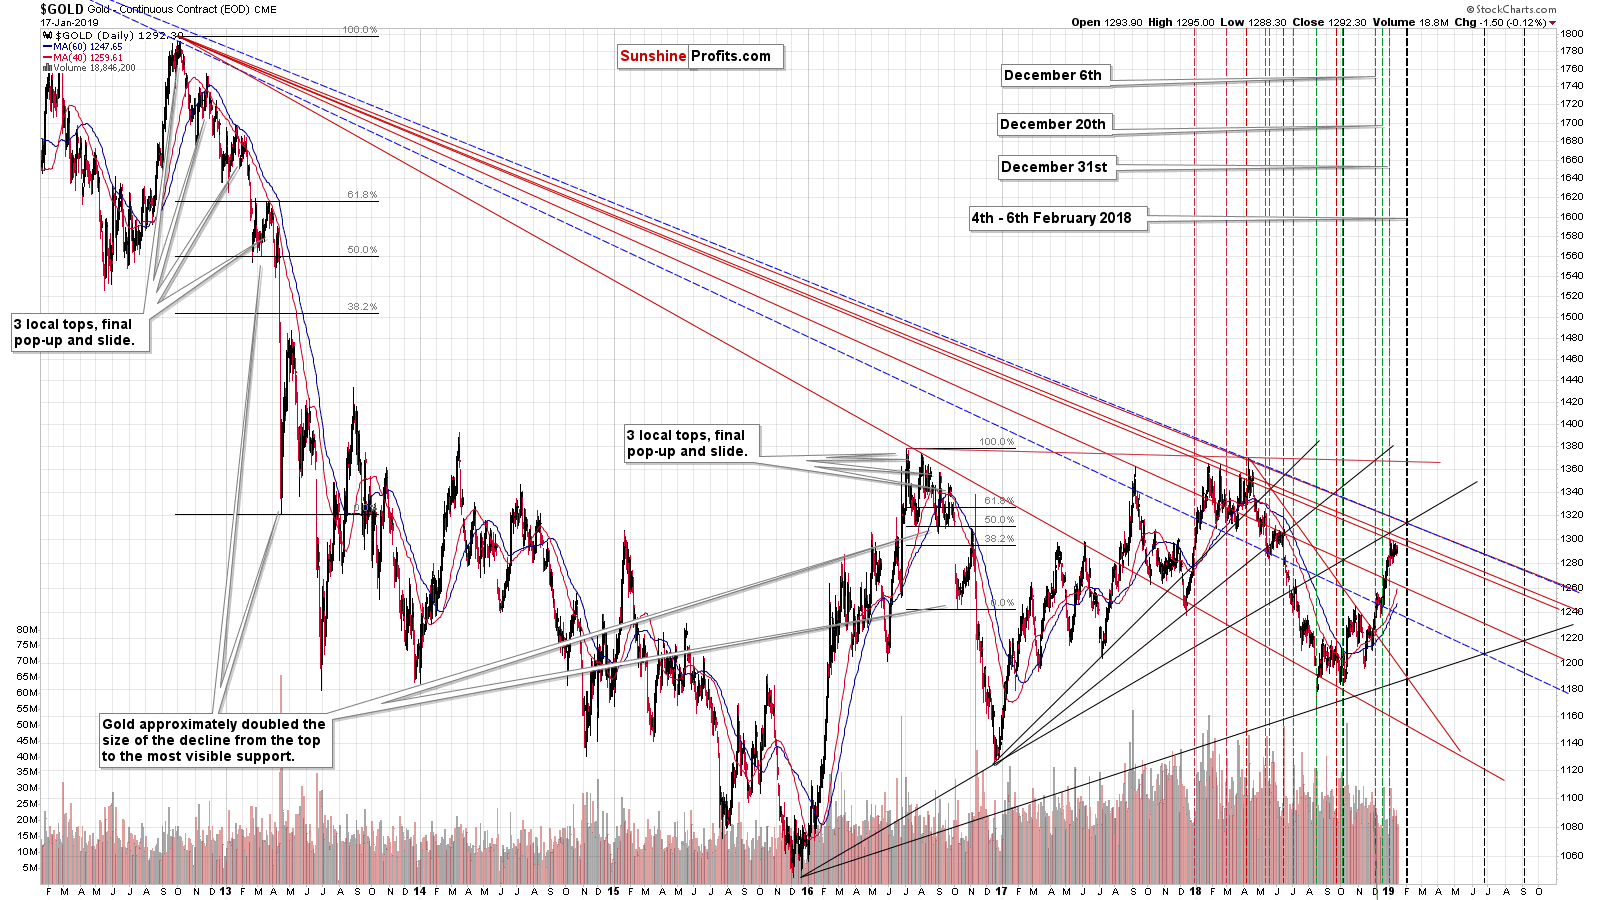
There are two apexes in early February, suggesting a strong reversal. After that, there are no indications of this technique (at least not based on the long-term lines) for the following months. The next reversal is in late June.
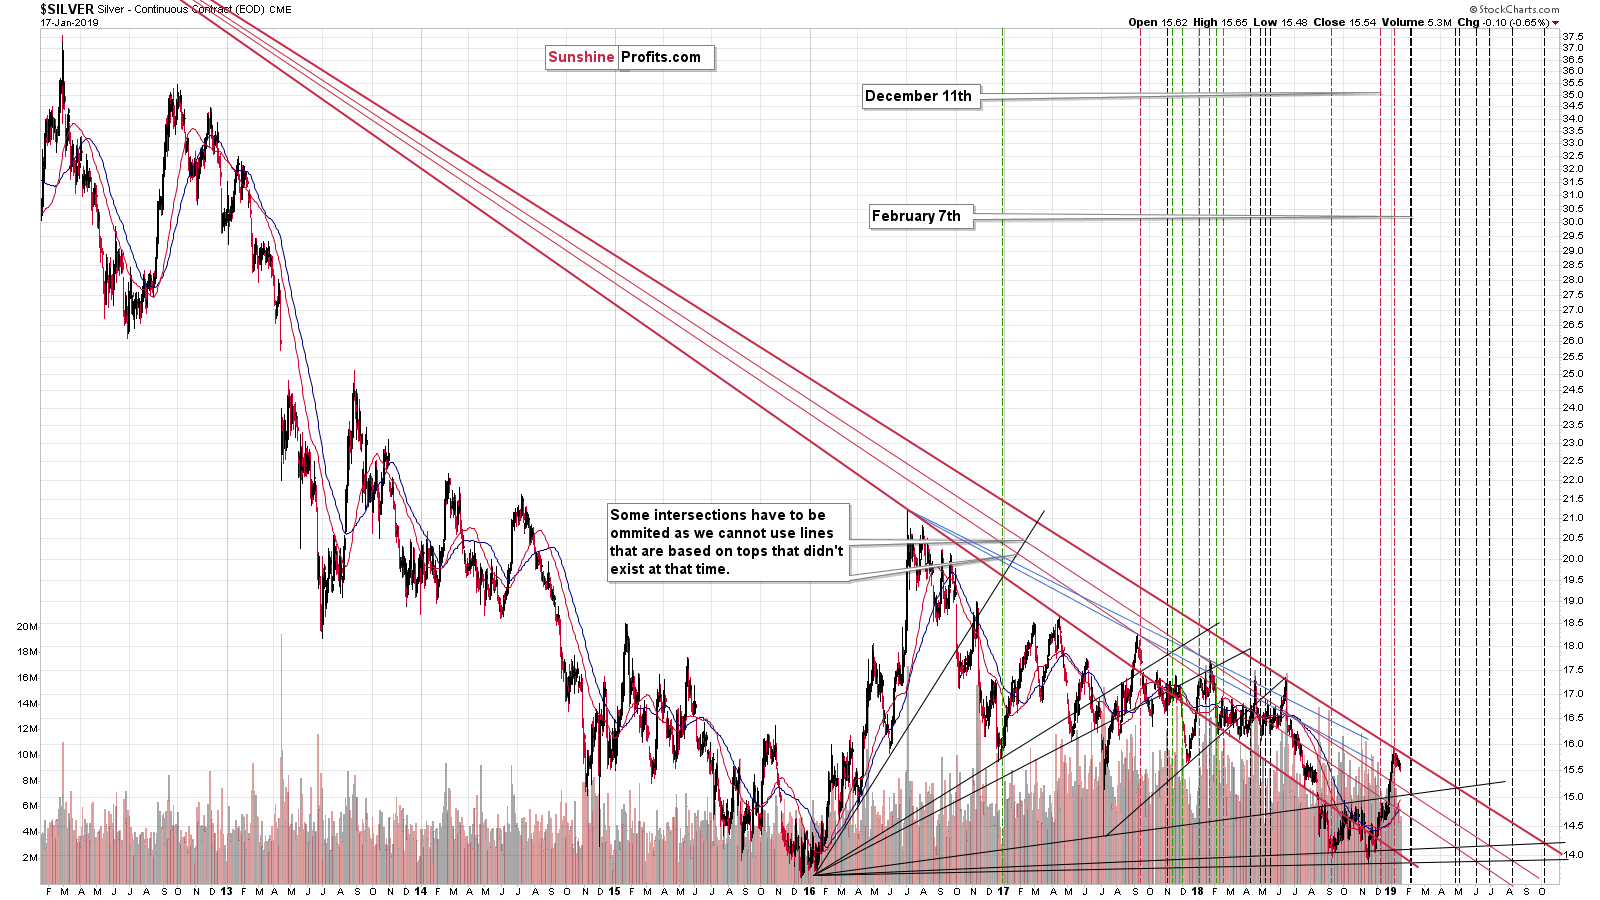
The above chart fully confirms the signals from USD and gold. This is remarkable, because these lines are based on totally different charts. Yet, they provide a signal at the same time. Just like in case of gold, there are two vertexes that point to a reversal in early February. Then – again just like in gold – there are no reversals after the nearest one until we’re close to the middle of the year. In silver, the second nearest reversal is in late April / early May. It’s notable that there is also a reversal at the end of June.
It’s even more notable that when there were no reversals for longer (mid-2018), silver simply declined. And it declined far. That’s not a strong analogy, but still, it’s another confirmation that we can expect a sizable slide shortly.
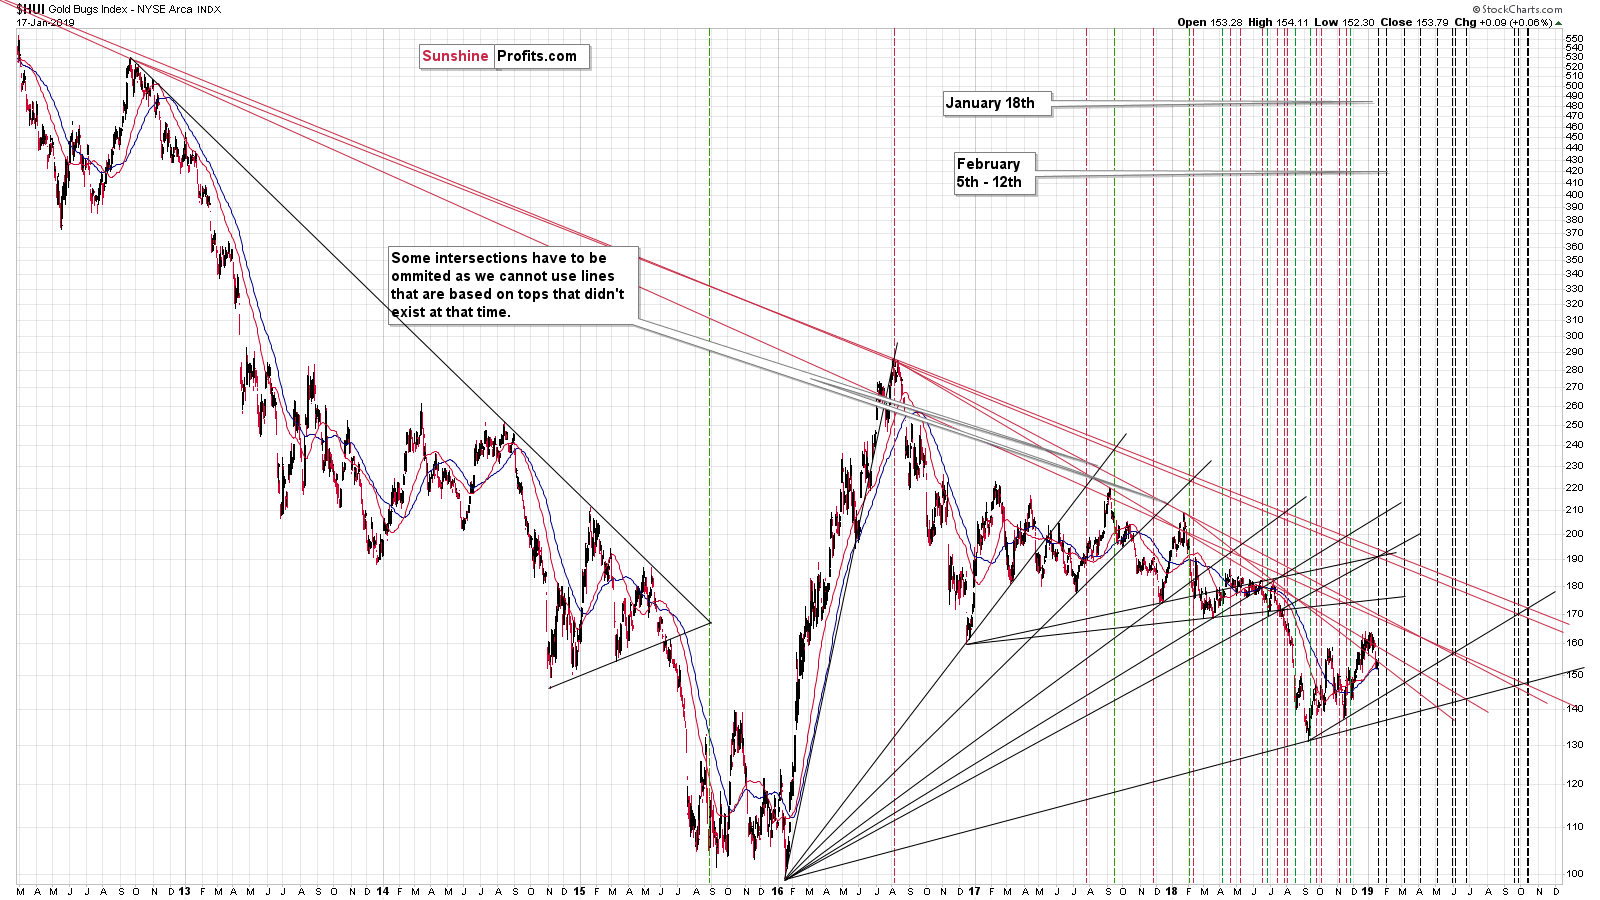
In case of gold stocks, we have one reversal right about now and – unsurprisingly – one coming at the end of January or in early February. Then there are a few extra reversals, but there is also one due in late June, just like in silver and gold.
The reversal that we have right now doesn’t tell us anything new. We already know that we might see a quick pop-up higher, perhaps due to USD’s short-term decline. But, the reversal at the end of the month (or early in February) emphasizes how important this date is. All key parts of the precious metals market and also the USD Index suggest that something major will happen in about 3 weeks. This is confirmed by total of 8 reversal signals (3 in USDX, 2 in gold, 2 in silver, and 1 in gold stocks).
Based on the weakness in mining stocks and the way in which silver is preparing to slide, it seems likely that the USD Index will break above the declining short-term resistance line and rally, thus triggering a big sell-off in the precious metals and mining stocks. Then, we might see the initial top in the USD and an initial bottom in the PMs in early February.
The next major turnaround that all PM charts emphasize is in late June – perhaps this is where we should expect the final bottom for this prolonged decline in the precious metal sector.
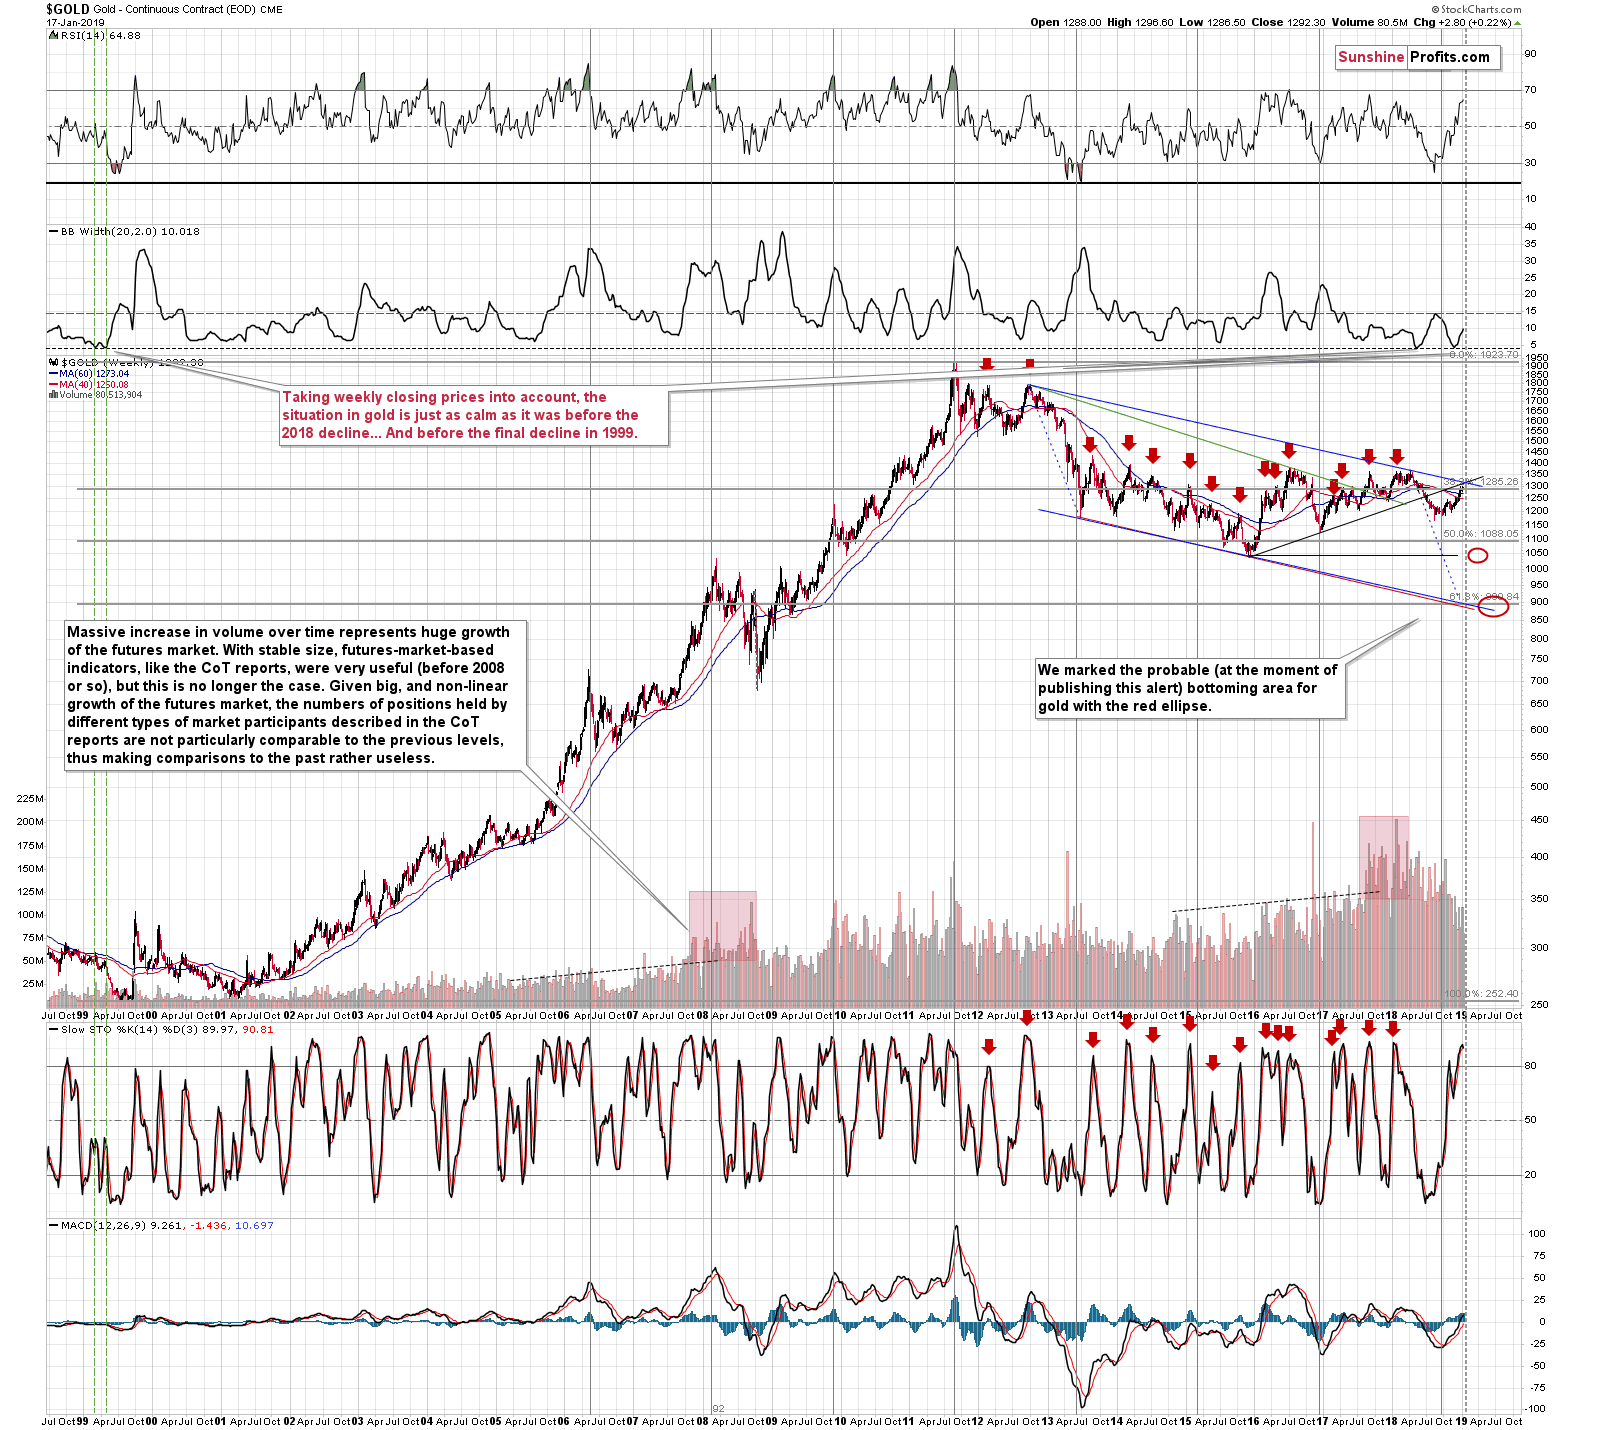
We will have more details once we move closer to this date, but it seems quite possible that the final bottom will take place at the end of June – that’s in tune with the red ellipse on gold’s very long-term chart that we created based on the likely price target and the shapes of the preceding declines.
Summary
Summing up, even though the next several days could be volatile, due to the possible (not very likely, though) move lower in the USD Index, it doesn’t mean that the outlook changed. The bearish outlook for the following weeks is confirmed by multiple factors, i.a. silver’s extreme outperformance and miners’ underperformance, gold’s performance link with the general stock market, gold getting Cramerized, and the bullish medium-term outlook for the USD Index and bearish outlook for the key part thereof – the Japanese yen. Even if the USD Index moves lower in the next several days, it shouldn’t have a major impact on the prices of PMs. The recent confirmed breakdowns in the mining stocks suggest that more weakness in the PM market is just around the corner. Let’s keep in mind that it is the very high probability of a huge downswing that makes the short position justified, not the outlook for the next few days.
As always, we’ll keep you – our subscribers – informed.
To summarize:
Trading capital (supplementary part of the portfolio; our opinion): Full short positions (250% of the full position) in gold, silver and mining stocks are justified from the risk/reward perspective with the following stop-loss orders and exit profit-take price levels:
- Gold: profit-take exit price: $1,062; stop-loss: $1,313; initial target price for the DGLD ETN: $82.96; stop-loss for the DGLD ETN $44.97
- Silver: profit-take exit price: $12.32; stop-loss: $16.04; initial target price for the DSLV ETN: $47.67; stop-loss for the DSLV ETN $24.68
- Mining stocks (price levels for the GDX ETF): profit-take exit price: $13.12; stop-loss: $22.03; initial target price for the DUST ETF: $80.97; stop-loss for the DUST ETF $20.37
Note: the above is a specific preparation for a possible sudden price drop, it does not reflect the most likely outcome. You will find a more detailed explanation in our August 1st Alert. In case one wants to bet on junior mining stocks’ prices (we do not suggest doing so – we think senior mining stocks are more predictable in the case of short-term trades – if one wants to do it anyway, we provide the details), here are the stop-loss details and target prices:
- GDXJ ETF: profit-take exit price: $17.52; stop-loss: $32.03
- JDST ETF: initial target price: $154.97 stop-loss: $42.17
Long-term capital (core part of the portfolio; our opinion): No positions (in other words: cash)
Insurance capital (core part of the portfolio; our opinion): Full position
Important Details for New Subscribers
Whether you already subscribed or not, we encourage you to find out how to make the most of our alerts and read our replies to the most common alert-and-gold-trading-related-questions.
Please note that the in the trading section we describe the situation for the day that the alert is posted. In other words, it we are writing about a speculative position, it means that it is up-to-date on the day it was posted. We are also featuring the initial target prices, so that you can decide whether keeping a position on a given day is something that is in tune with your approach (some moves are too small for medium-term traders and some might appear too big for day-traders).
Plus, you might want to read why our stop-loss orders are usually relatively far from the current price.
Please note that a full position doesn’t mean using all of the capital for a given trade. You will find details on our thoughts on gold portfolio structuring in the Key Insights section on our website.
As a reminder – “initial target price” means exactly that – an “initial” one, it’s not a price level at which we suggest closing positions. If this becomes the case (like it did in the previous trade) we will refer to these levels as levels of exit orders (exactly as we’ve done previously). Stop-loss levels, however, are naturally not “initial”, but something that, in our opinion, might be entered as an order.
Since it is impossible to synchronize target prices and stop-loss levels for all the ETFs and ETNs with the main markets that we provide these levels for (gold, silver and mining stocks – the GDX ETF), the stop-loss levels and target prices for other ETNs and ETF (among other: UGLD, DGLD, USLV, DSLV, NUGT, DUST, JNUG, JDST) are provided as supplementary, and not as “final”. This means that if a stop-loss or a target level is reached for any of the “additional instruments” (DGLD for instance), but not for the “main instrument” (gold in this case), we will view positions in both gold and DGLD as still open and the stop-loss for DGLD would have to be moved lower. On the other hand, if gold moves to a stop-loss level but DGLD doesn’t, then we will view both positions (in gold and DGLD) as closed. In other words, since it’s not possible to be 100% certain that each related instrument moves to a given level when the underlying instrument does, we can’t provide levels that would be binding. The levels that we do provide are our best estimate of the levels that will correspond to the levels in the underlying assets, but it will be the underlying assets that one will need to focus on regarding the signs pointing to closing a given position or keeping it open. We might adjust the levels in the “additional instruments” without adjusting the levels in the “main instruments”, which will simply mean that we have improved our estimation of these levels, not that we changed our outlook on the markets. We are already working on a tool that would update these levels on a daily basis for the most popular ETFs, ETNs and individual mining stocks.
Our preferred ways to invest in and to trade gold along with the reasoning can be found in the how to buy gold section. Additionally, our preferred ETFs and ETNs can be found in our Gold & Silver ETF Ranking.
As a reminder, Gold & Silver Trading Alerts are posted before or on each trading day (we usually post them before the opening bell, but we don't promise doing that each day). If there's anything urgent, we will send you an additional small alert before posting the main one.
=====
Latest Free Trading Alerts:
Will 2019 be better than 2018 for the yellow metal? We invite you to read our today’s article, painting the macroeconomic outlook for 2018 and learn whether fundamental factors will become less or more friendly toward gold.
Macroeconomic Outlook for 2019 and Gold
=====
Thank you.
Sincerely,
Przemyslaw Radomski, CFA
Editor-in-chief, Gold & Silver Fund Manager

