

Briefly: in our opinion, full (250% of the regular size of the position) speculative short positions in gold, silver and mining stocks are justified from the risk/reward perspective at the moment of publishing this Alert.
Gold stocks are no longer hiding their breakdowns. They declined substantially yesterday, especially given that quite little happened in case of gold and silver. Miners’ underperformance is definitely bearish. However, gold didn’t decline significantly (just $2.90) yesterday even though the USD Index moved visibly higher. If a given market doesn’t react to what should trigger a decline, it usually suggests that this market wants to move higher. Consequently, gold’s performance appears bullish. Which effect should one trust?
Both. It doesn’t mean that the situation became more bullish or that both effects cancel each other out. This may be surprising, so we’ll elaborate.
Some time ago, to make a point about his theories, Albert Einstein made a quick riddle (to be clear, we’re not 100% certain it was him, as we read that in a book some time ago and we couldn’t find online references, but that doesn’t change the point).
There were two boys and they were looking through the same window. One boy was inside the house and was looking outside and he was able to see what was out there. The second boy was outside and was looking inside the house and he was able to see what was in there. It was a regular window. However, boys didn’t see each other. Why?
Please think about it for a moment. We’ll add several empty verses below to so that seeing the answer immediately doesn’t ruin the riddle.
.
.
.
.
.
.
.
.
.
.
.
.
.
.
.
.
.
.
.
.
.
.
.
.
.
The boys were looking through the window at different times.
The beauty of the riddle and the point thereof was to show people how they take time as something that never changes (which is an important point in the relativity theory). And it does. We didn’t answer correctly, but we enjoyed the riddle and we hope you did too.
Why did we mention it at all? The time is the factor that needs to be taken into account when estimating the impact of gold stocks underperformance relative to gold and the impact of gold’s underperformance relative to the signals coming from the USD Index.
Gold stocks to gold ratio is rarely delayed. It’s usually a quite straight forward indicator. One can plot the miners to gold ratio on a chart and look for resistance levels and analogies, but in general, when miners underperform, it’s bearish right when it appears.
In case of the USD Index and gold, the reaction can be delayed and is more complicated. For instance, in case of turmoil in the Eurozone, both: gold and US dollar could increase in value. If this effect is only moderately strong, gold may not react to USDX’s movement at all instead of rallying along with it. Of course, the opposite would be the case if things calmed down in the Eurozone.
Consequently, what we saw yesterday, can be interpreted as a strong bearish confirmation of the medium-term trend, while at the same time it appears that gold remains vulnerable to a quick run-up in case of a decline in the USD Index. Moreover, the clarity of the former (bearish) effect is high, while clarity of the latter (possibly bullish) effect is low, because of the possibility that gold’s decline to USD’s movement could simply be delayed, not absent. The latter is even confirmed by the charts featuring gold in terms of the euro.
However, before moving to gold’s price seen from the European perspective, let’s take a look at how the metals and miners fared in terms of the USD.
Miners’ Undeniable Weakness
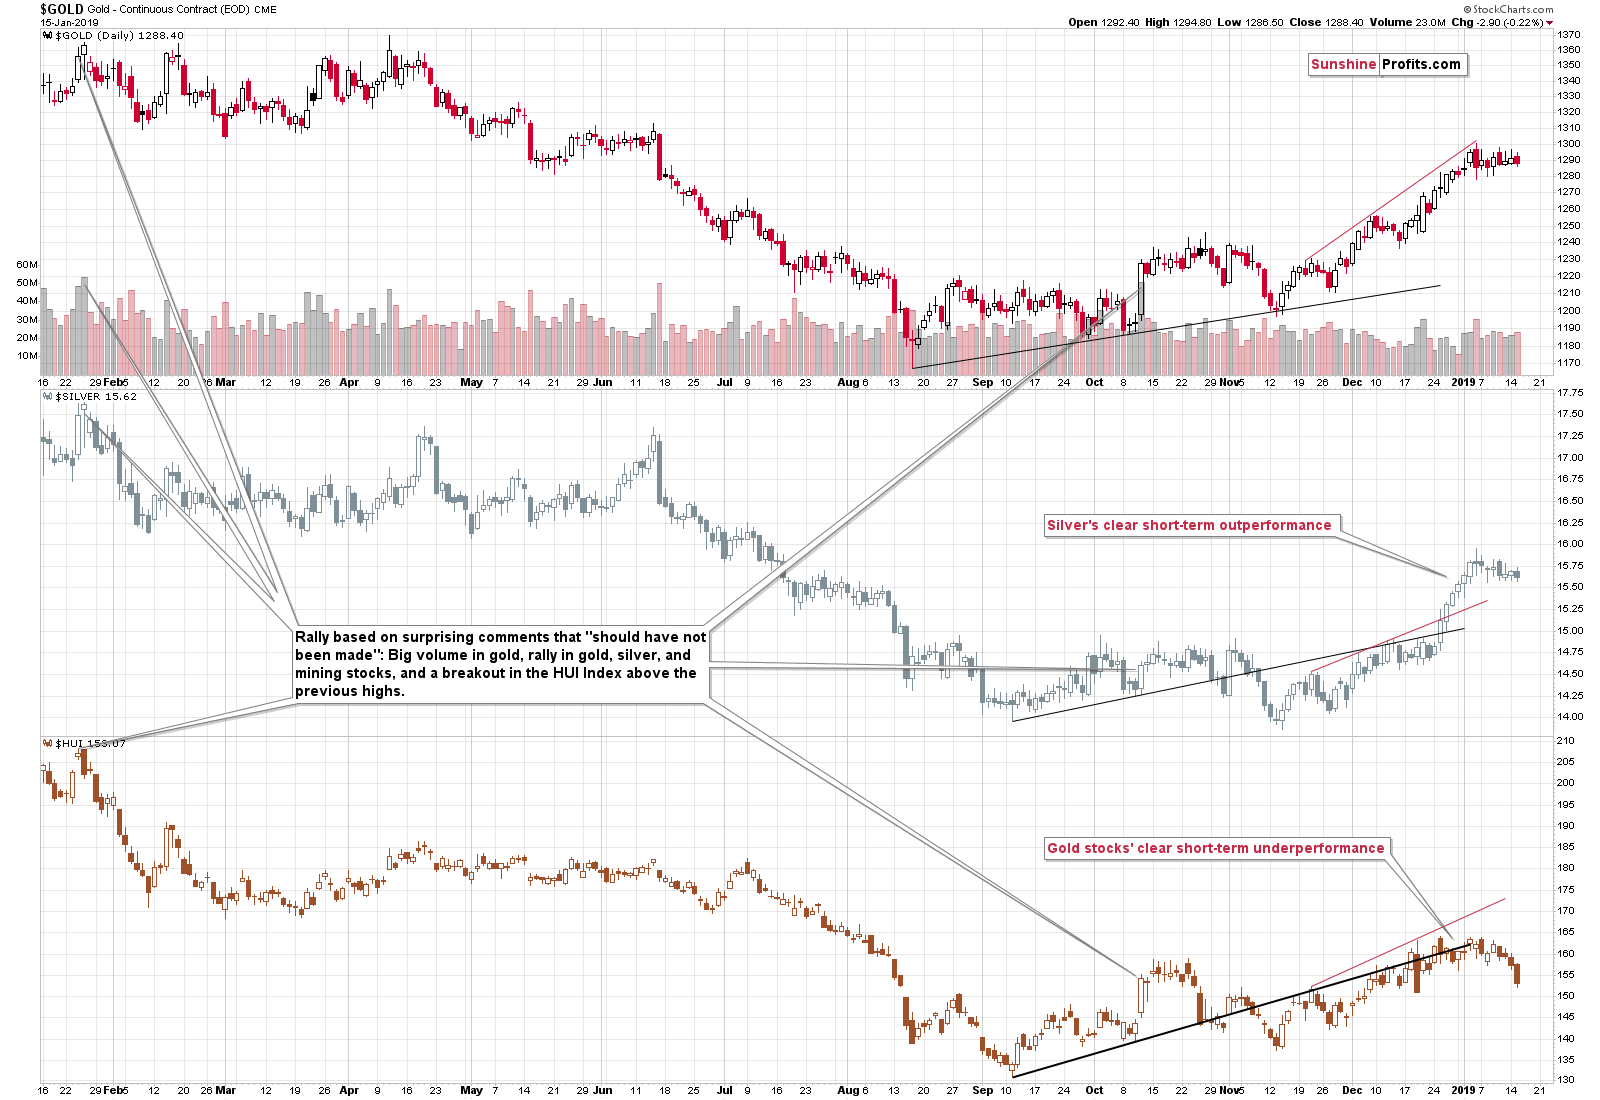
There’s no doubt that the mining stocks are underperforming gold and silver right now. It’s so clear that it doesn’t require additional explanation.
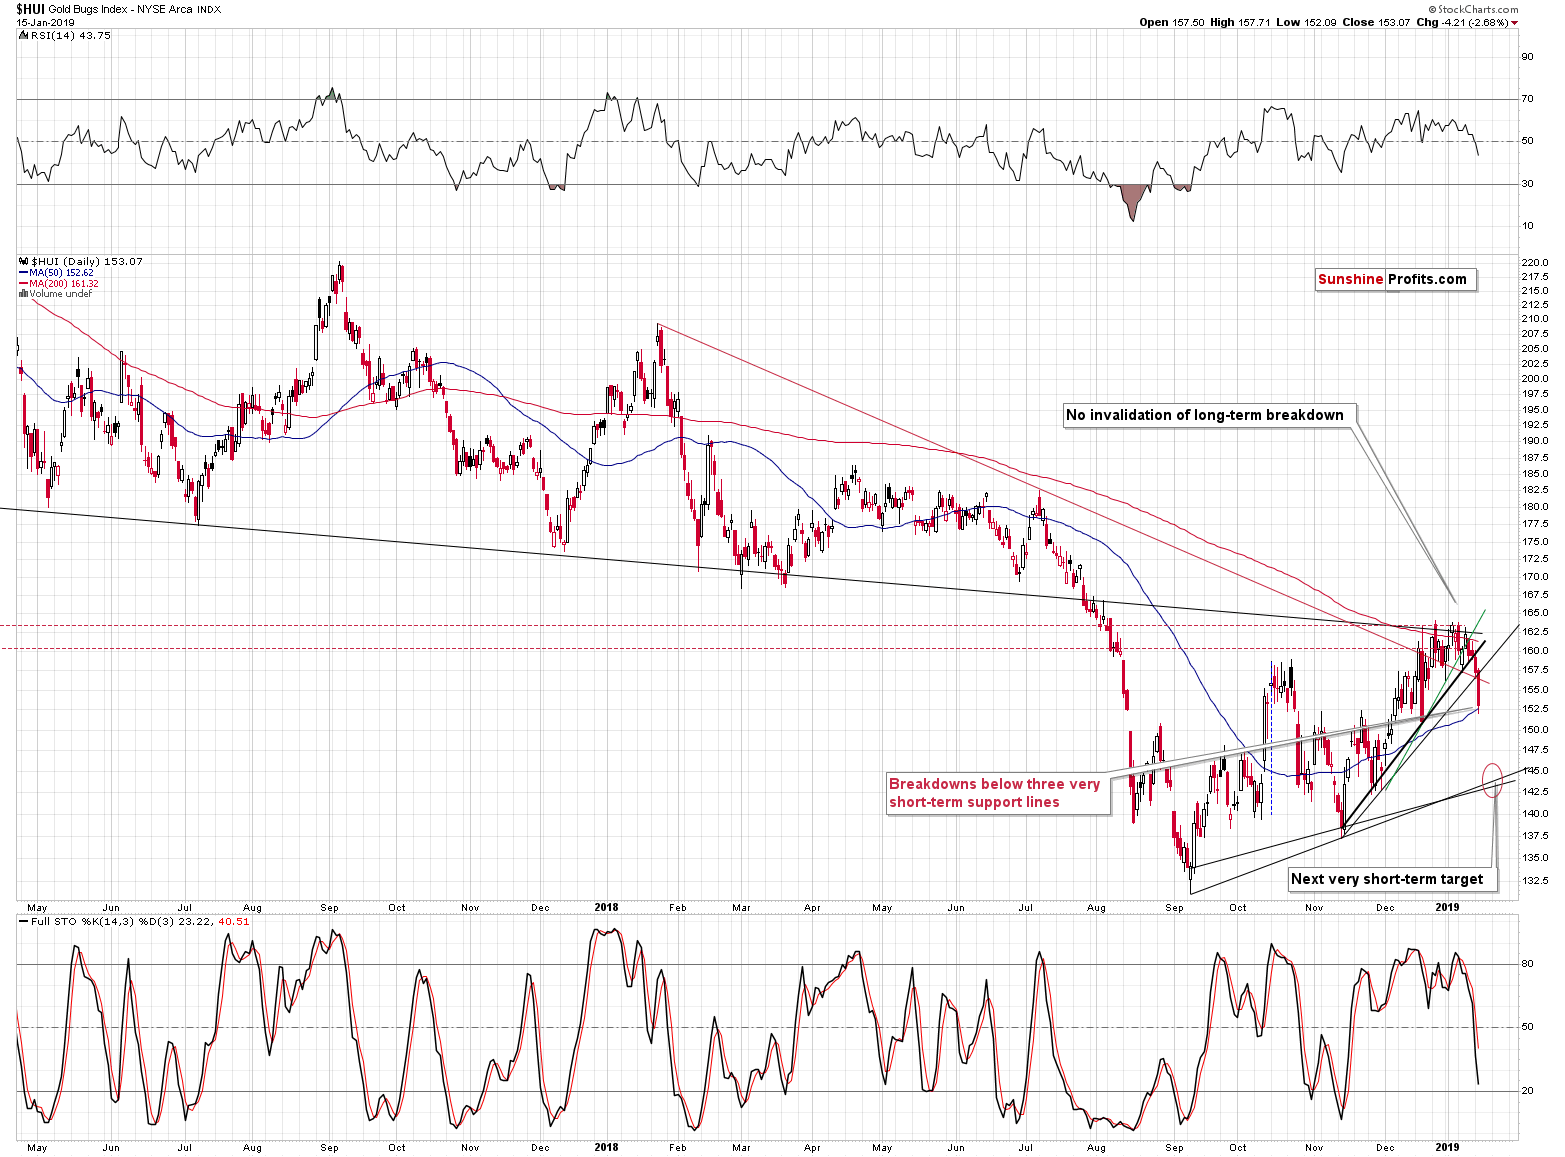
Gold miners declined and broke below all very short-term lines. Some of the breakdowns have already been confirmed, while others have not, but the move below all of them was sizable and decisive and it took place without gold’s help, so the odds are that all these breakdowns will be confirmed shortly.
The next very short-term support is at about 143 – 144, but we doubt that it would be able to generate a meaningful comeback. And even if it does, we doubt that this comeback would last long. The corrective upswing appears to be over and since the medium-term factors point to much lower prices, the big, “surprising” moves should be to the downside.
This is especially the case, since our points on the analogy to what happened in mid-2015, remain up-to-date:
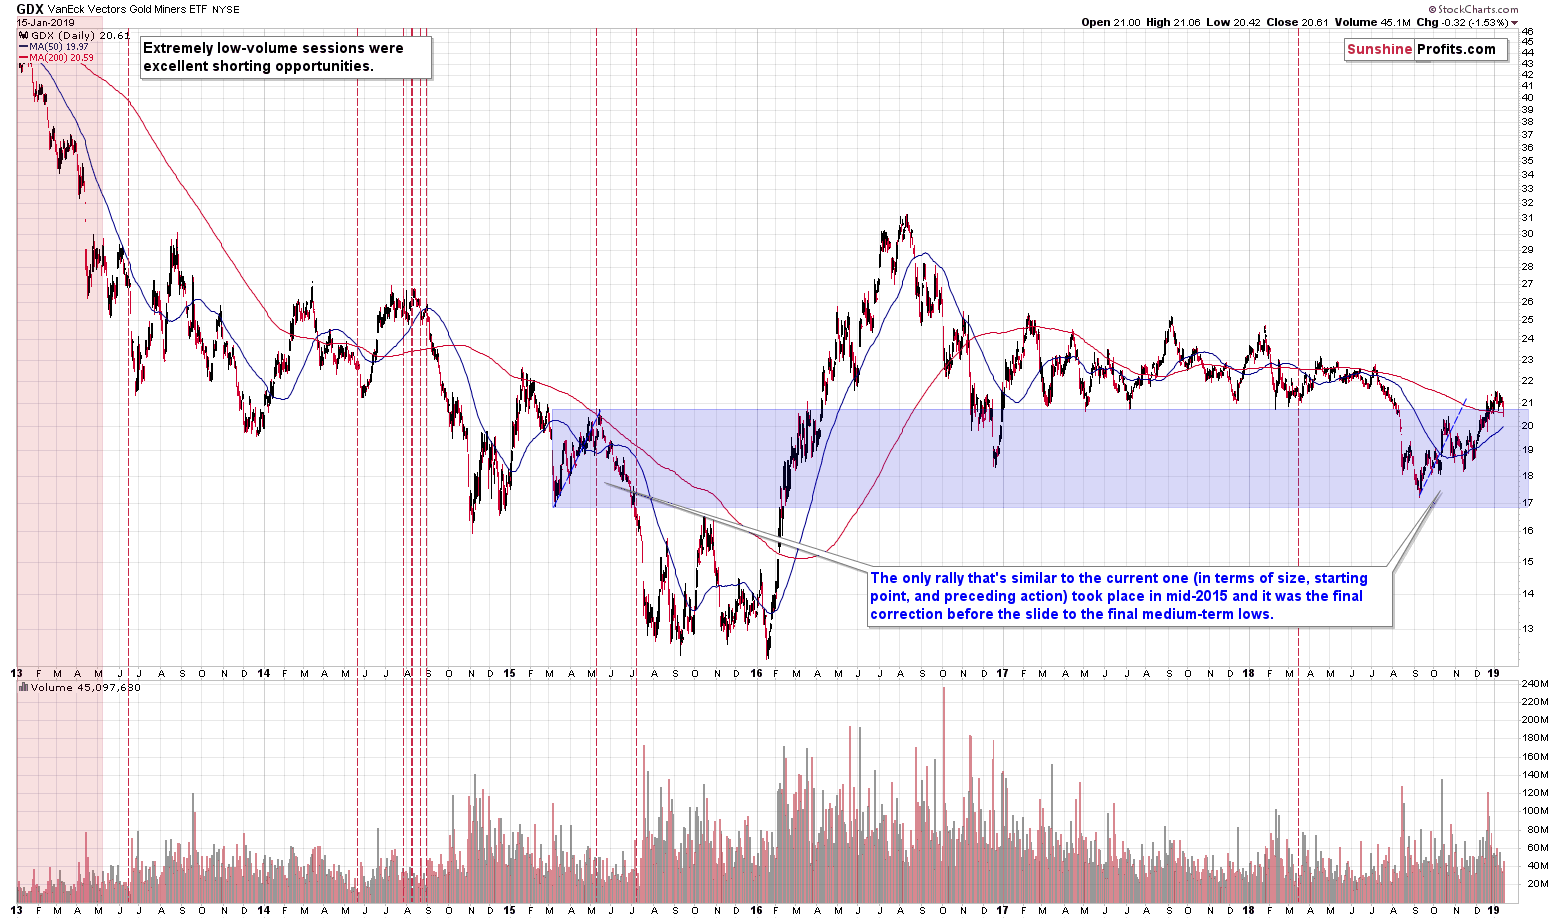
It probably doesn’t look familiar, but it actually should. We saw almost identical corrective upswing in mid-2015. The previous rally started from a bit lower levels and ended a bit lower as well (we used the blue rectangle on the above chart to make the comparison easier), but the differences were tiny. The entire size of the upswing was extremely similar, and we marked it with a blue dashed line. Copying the previous decline to the 2018 bottom shows that the current upswing’s end (assuming that it ended) is very much in tune with where the rally should have ended based on the 2015 - now similarity. Moreover, both rallies ended when GDX moved a little above its 200-day moving average.
Why is this similarity important? Because that was the final corrective upswing before the slide to the 2015 lows. The decline that followed was more than twice as big as the size of the corrective rally. That’s very bearish on its own, but let’s keep in mind that in 2015 the USD Index was after a multi-month rally and this time it seems that its medium-term rally is far from being over. Consequently, the potential for the decline in the miners is even greater this time.
The Precious Pause
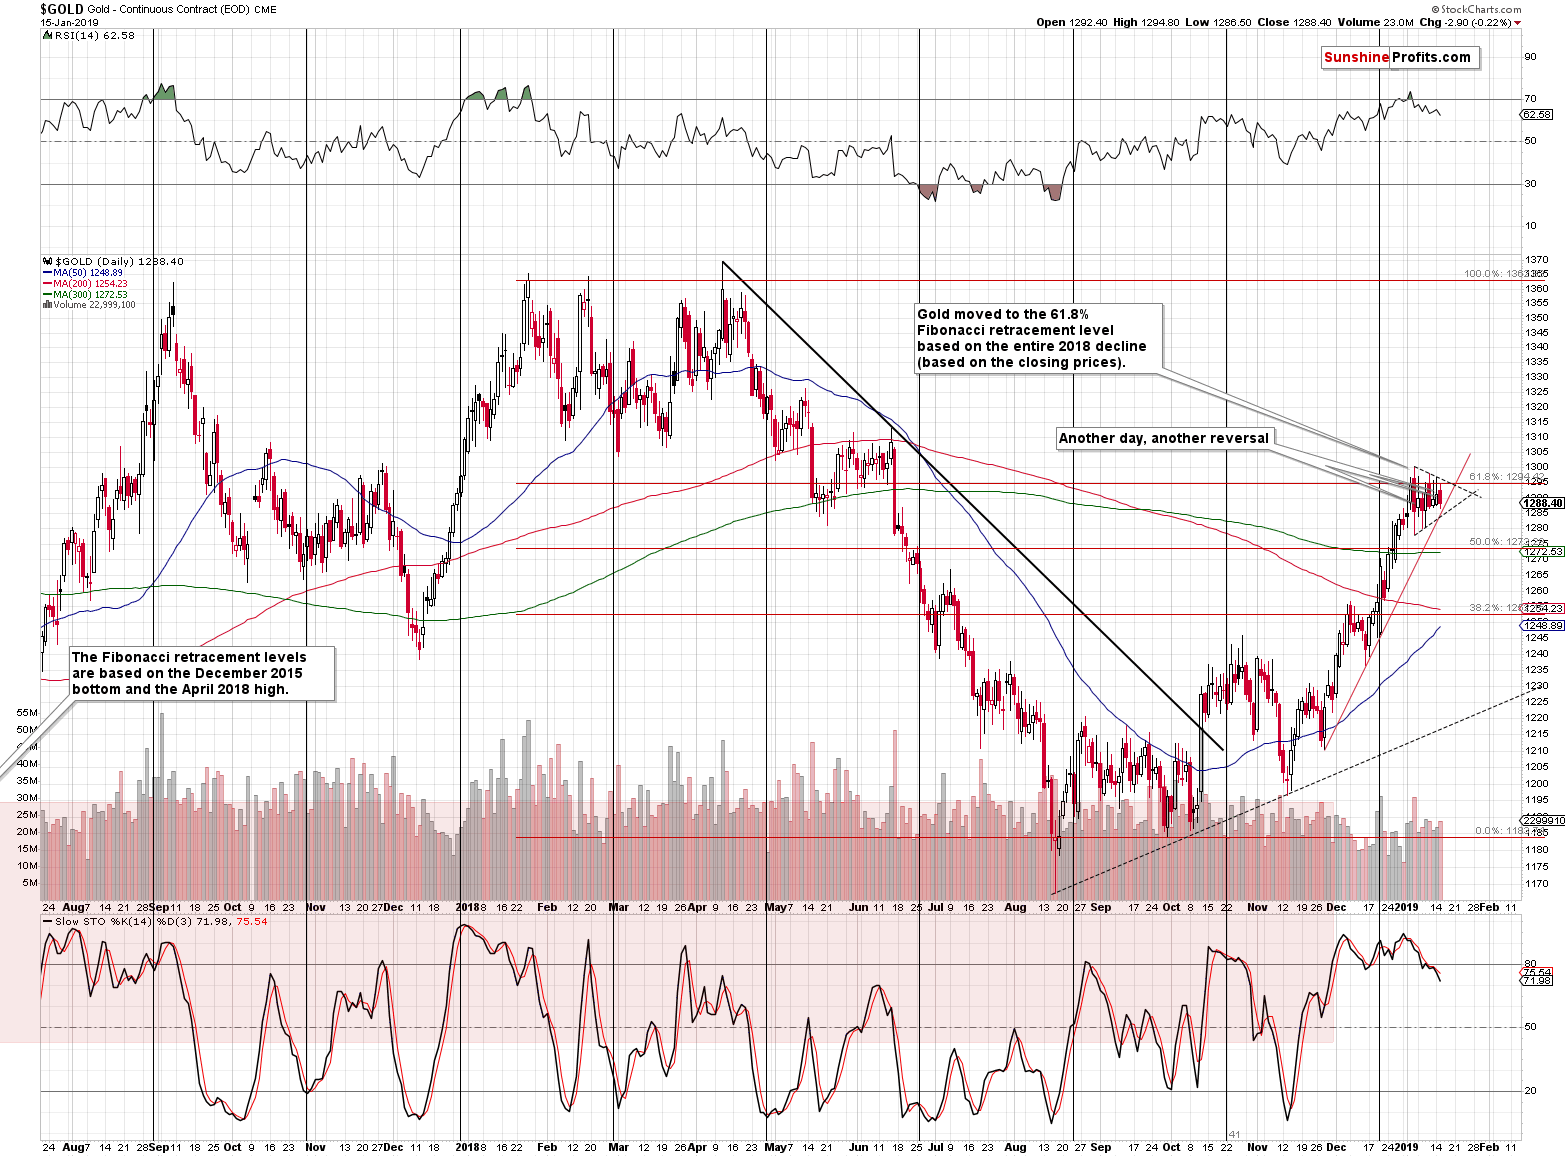
Gold didn’t do much yesterday. It only declined to its rising support line but didn’t break below it. Yesterday’s decline in the miners suggests that gold’s decline will follow shortly. Gold’s close below $1,285 will serve as a short-term breakdown and a confirmation that the short-term downswing has already started.
As far as silver is concerned, we wrote the following yesterday:
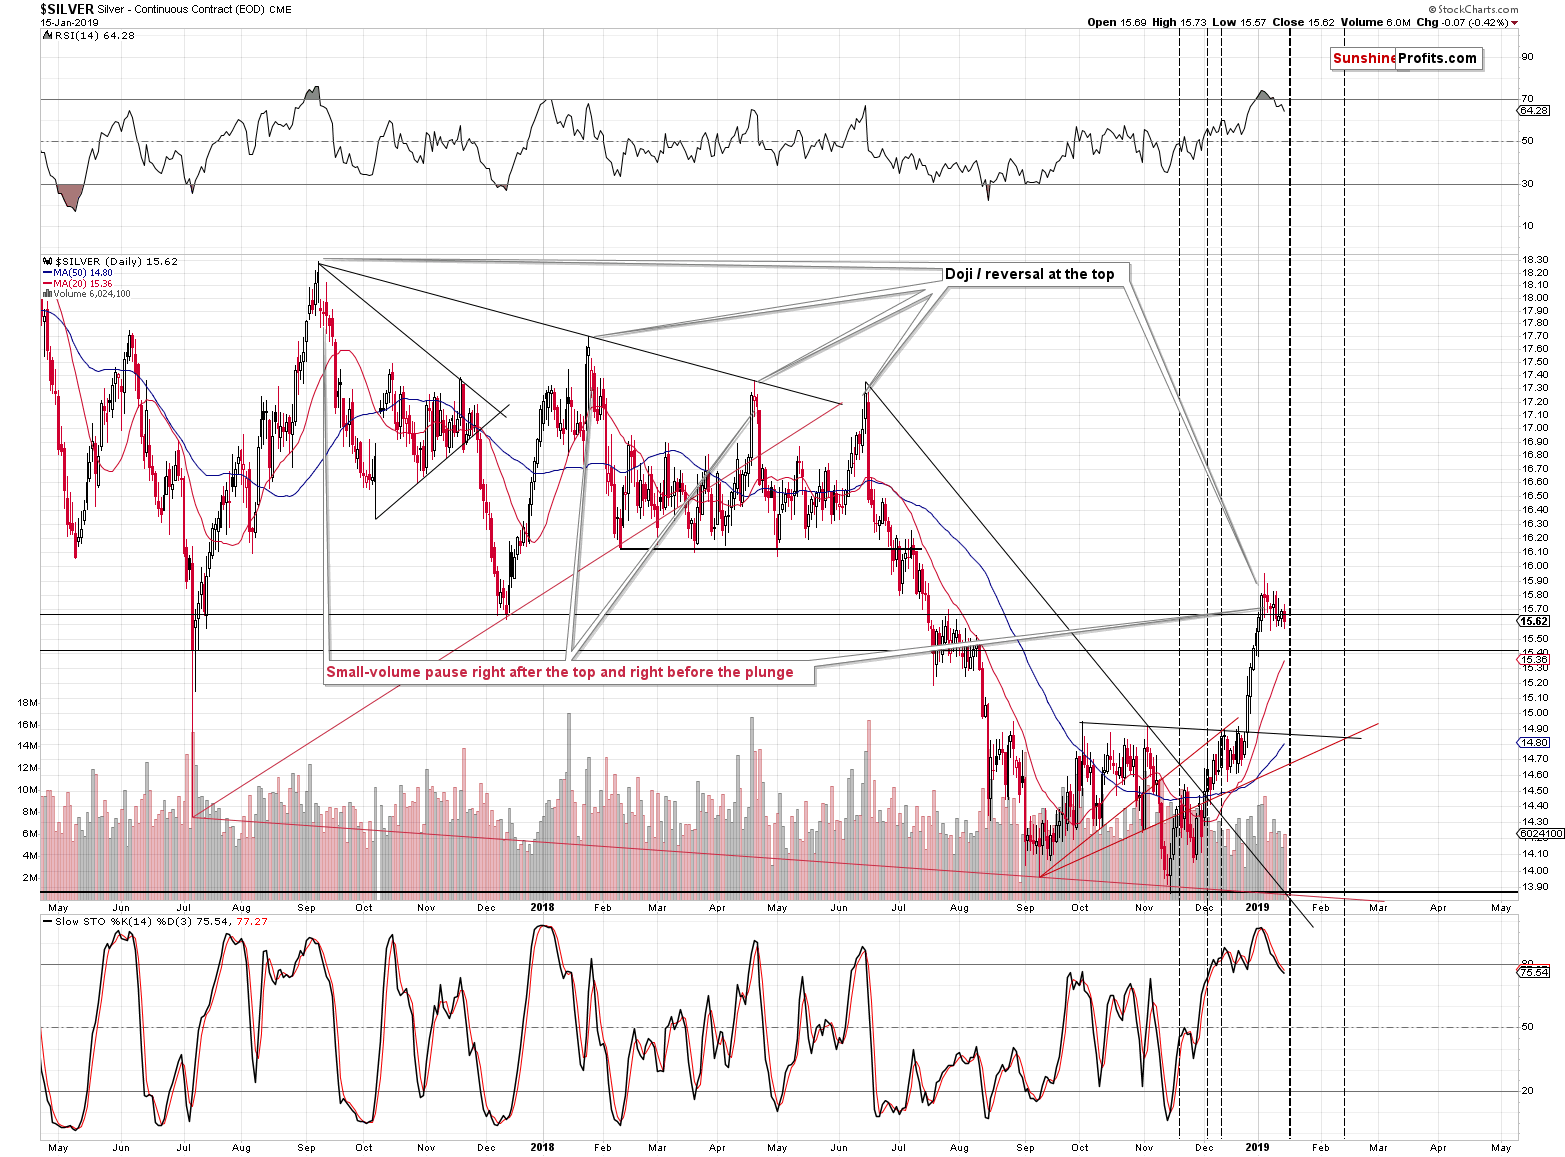
The vertex of the triangle that’s based on the two declining (red and black) support lines is approximately today, suggesting that a major turnaround is just around the corner. We recently saw some back and forth trading, so if we see a quick rally and perhaps an intraday reversal, please keep in mind that it will actually be a bearish development, not a bullish one. It’s far from being certain, but we can’t rule out another move to the previous January high.
Of course, it doesn’t change anything with regard to the outlook for the following weeks, which remains bearish. It’s just a heads-up of what may take place this week. The risk to reward with regard to the bigger move continues to favor the bearish positions in our view.
[We moved the thick vertical line representing the turnaround by a few days so that the shape of yesterday’s session is visible]
We did see a turnaround, but it was not particularly significant, which makes the interpretation rather difficult. That might have been the top and we might see a slide from the current levels. Or it could have been a pause before the final quick upswing and then a reversal. Fortunately, both possibilities point to the same outcome – we are keeping the position intact. Even in case of the latter scenario, silver’s turnaround could be only a matter of a few hours (perhaps when the US markets are closed) that is followed by a dramatic plunge.
Having said that, let’s move to the analysis of gold seen from the European perspective.
Gold Price in Terms of the Euro
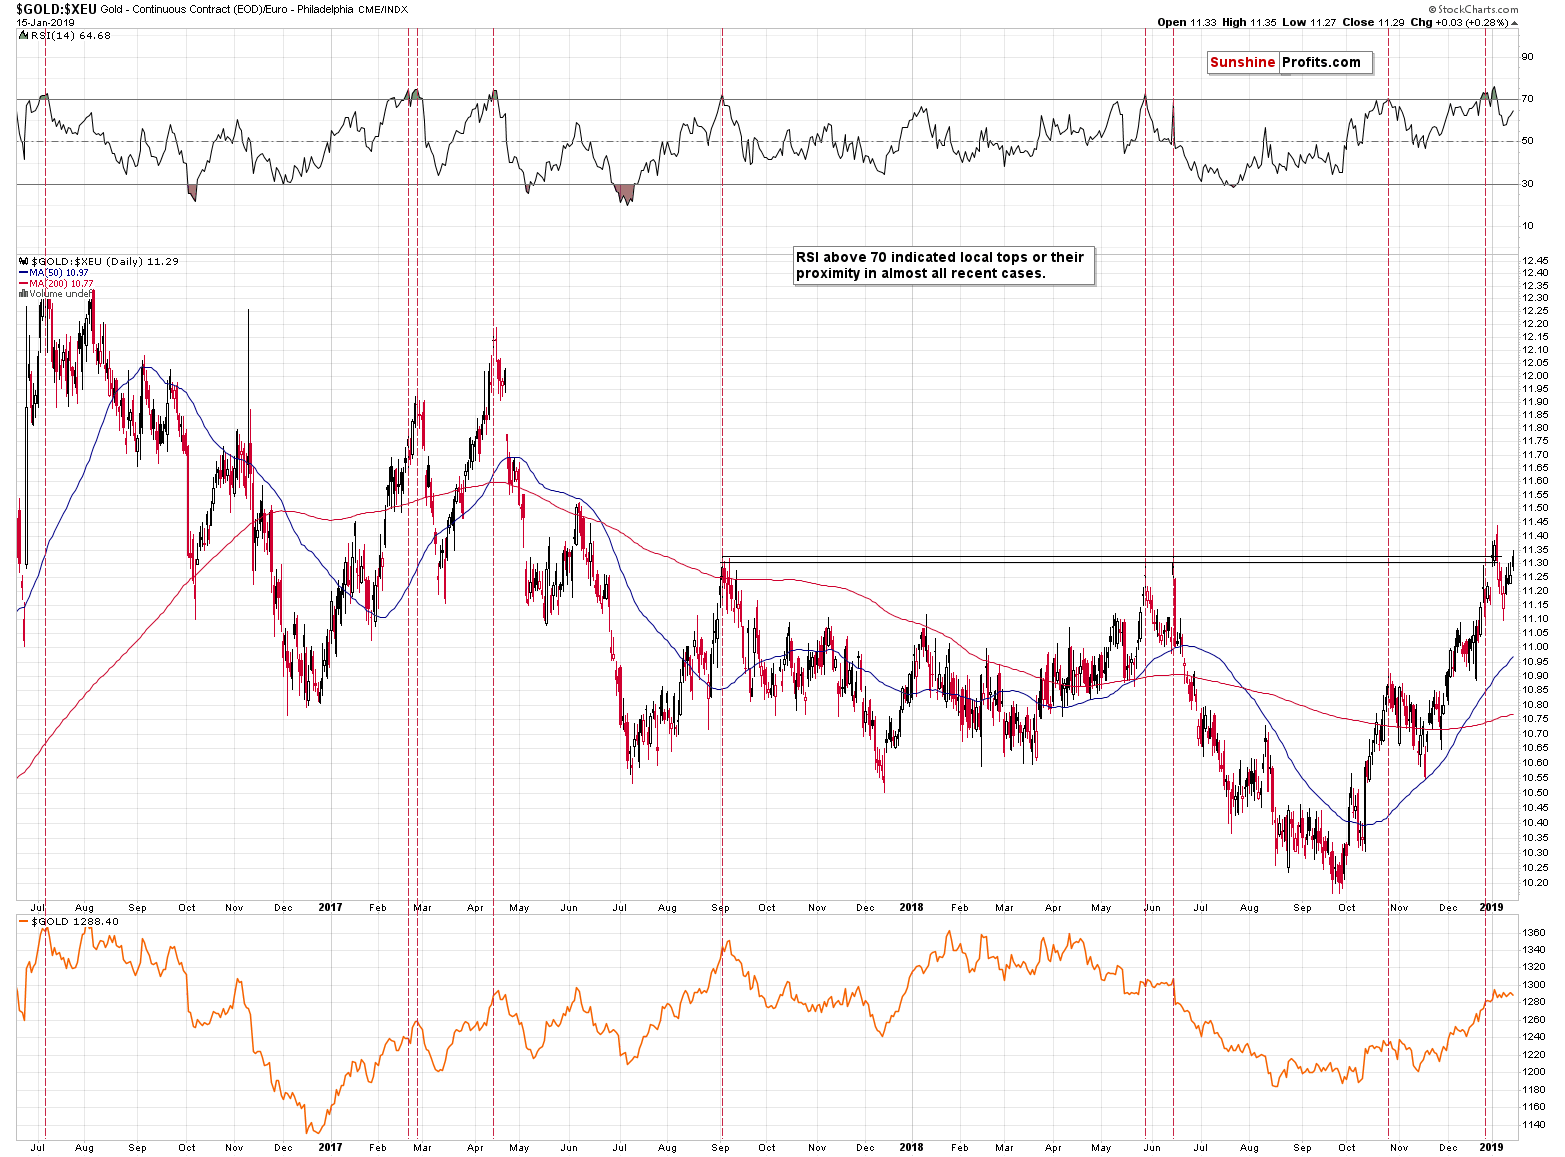
The price of gold in terms of the euro moved higher in the last couple of days, which represents the most recent strength relative to the USD movement. The key point here is that it appears to be just an initial corrective upswing after the top, similar to what we saw in April 2017, right before the slide. The recent top formed after the price moved above the previous highs and then invalidated this move. It was confirmed by the RSI’s move above 70 and then a comeback below it.
There are also long-term confirmations of the above.
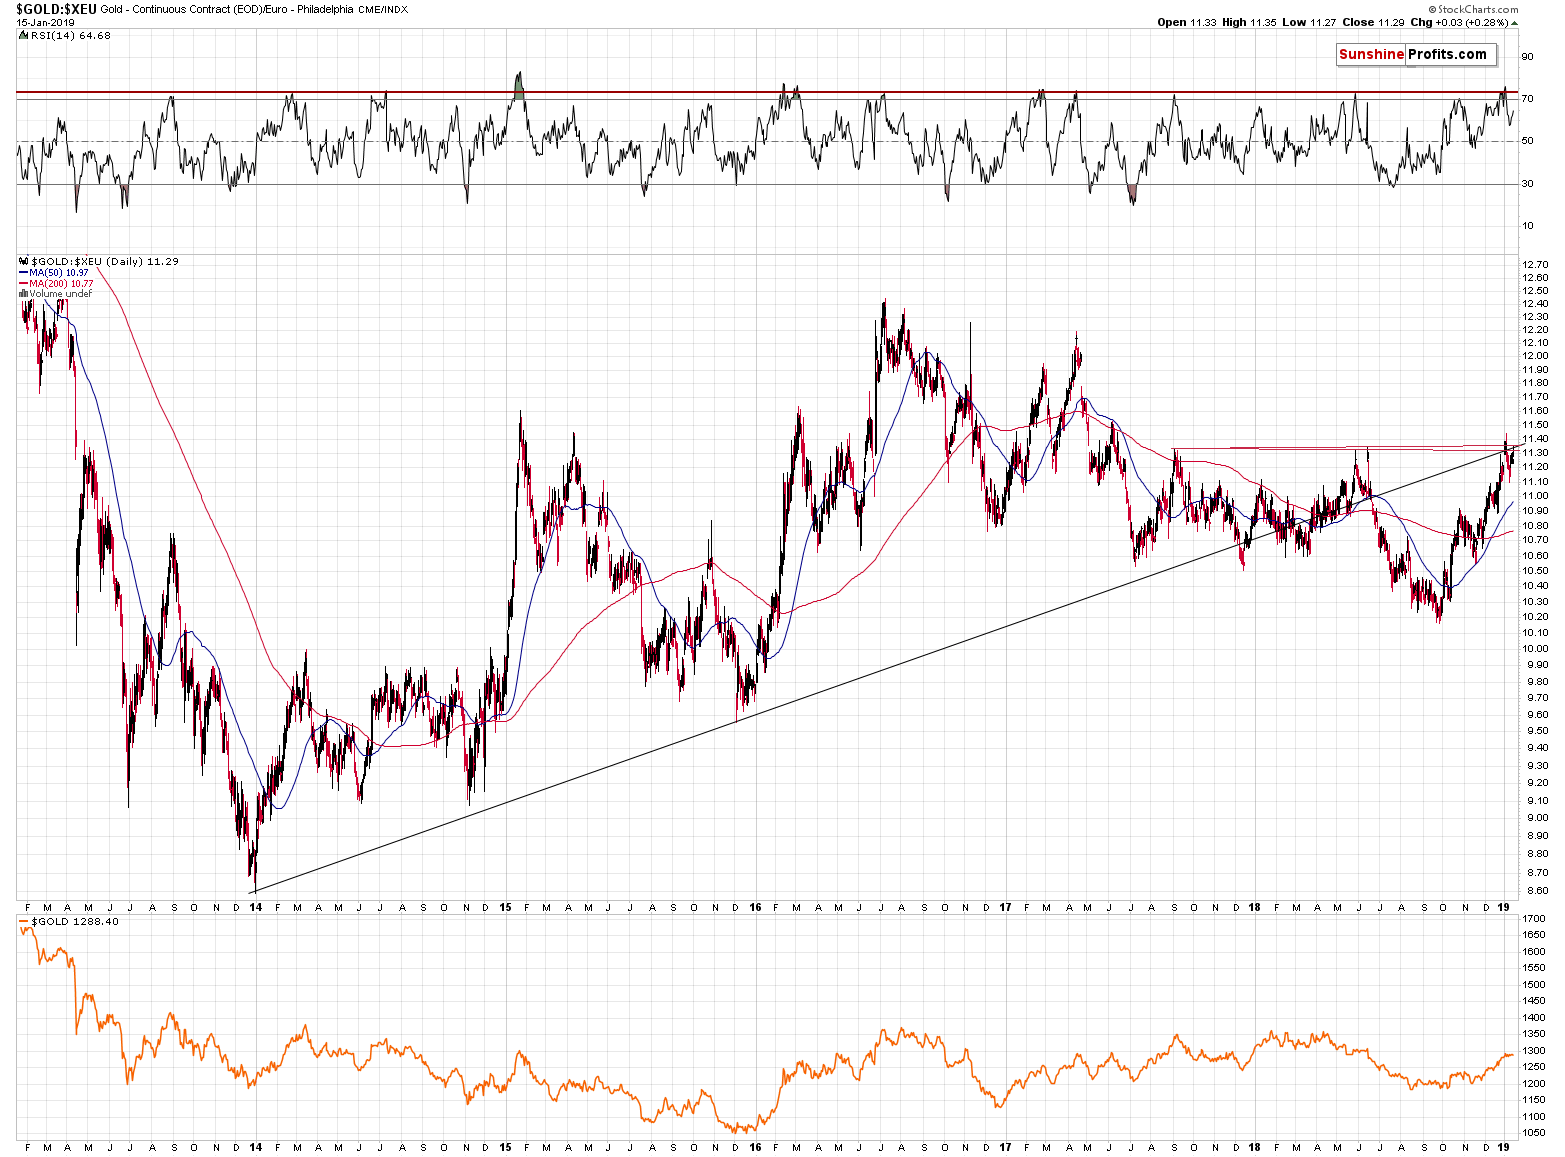
The entire late-2018 upswing seems to have been a big verification of the breakdown below the rising, long-term support/resistance line. In addition to the above, we see that gold topped practically right at the vertex of the triangle that’s based on the rising support line and the horizontal resistance based on the mid-2017 and mid-2018 tops.
What’s particularly interesting is that there were actually two triangles as there are two red resistance lines. One vertex confirmed the most recent top. The other vertex is approximately right now, thus confirming the very temporary – and bearish – nature of the most recent upswing.
The implications are bearish directly (for gold) and indirectly, because the above suggests that gold will be magnifying USD’s bearish implications and ignoring its bullish lead (should we see it at all).
Speaking of the USD and triangles, we added this technique to our USDX chart, and it showed something very interesting.
USD’s Reversal and Vulnerability
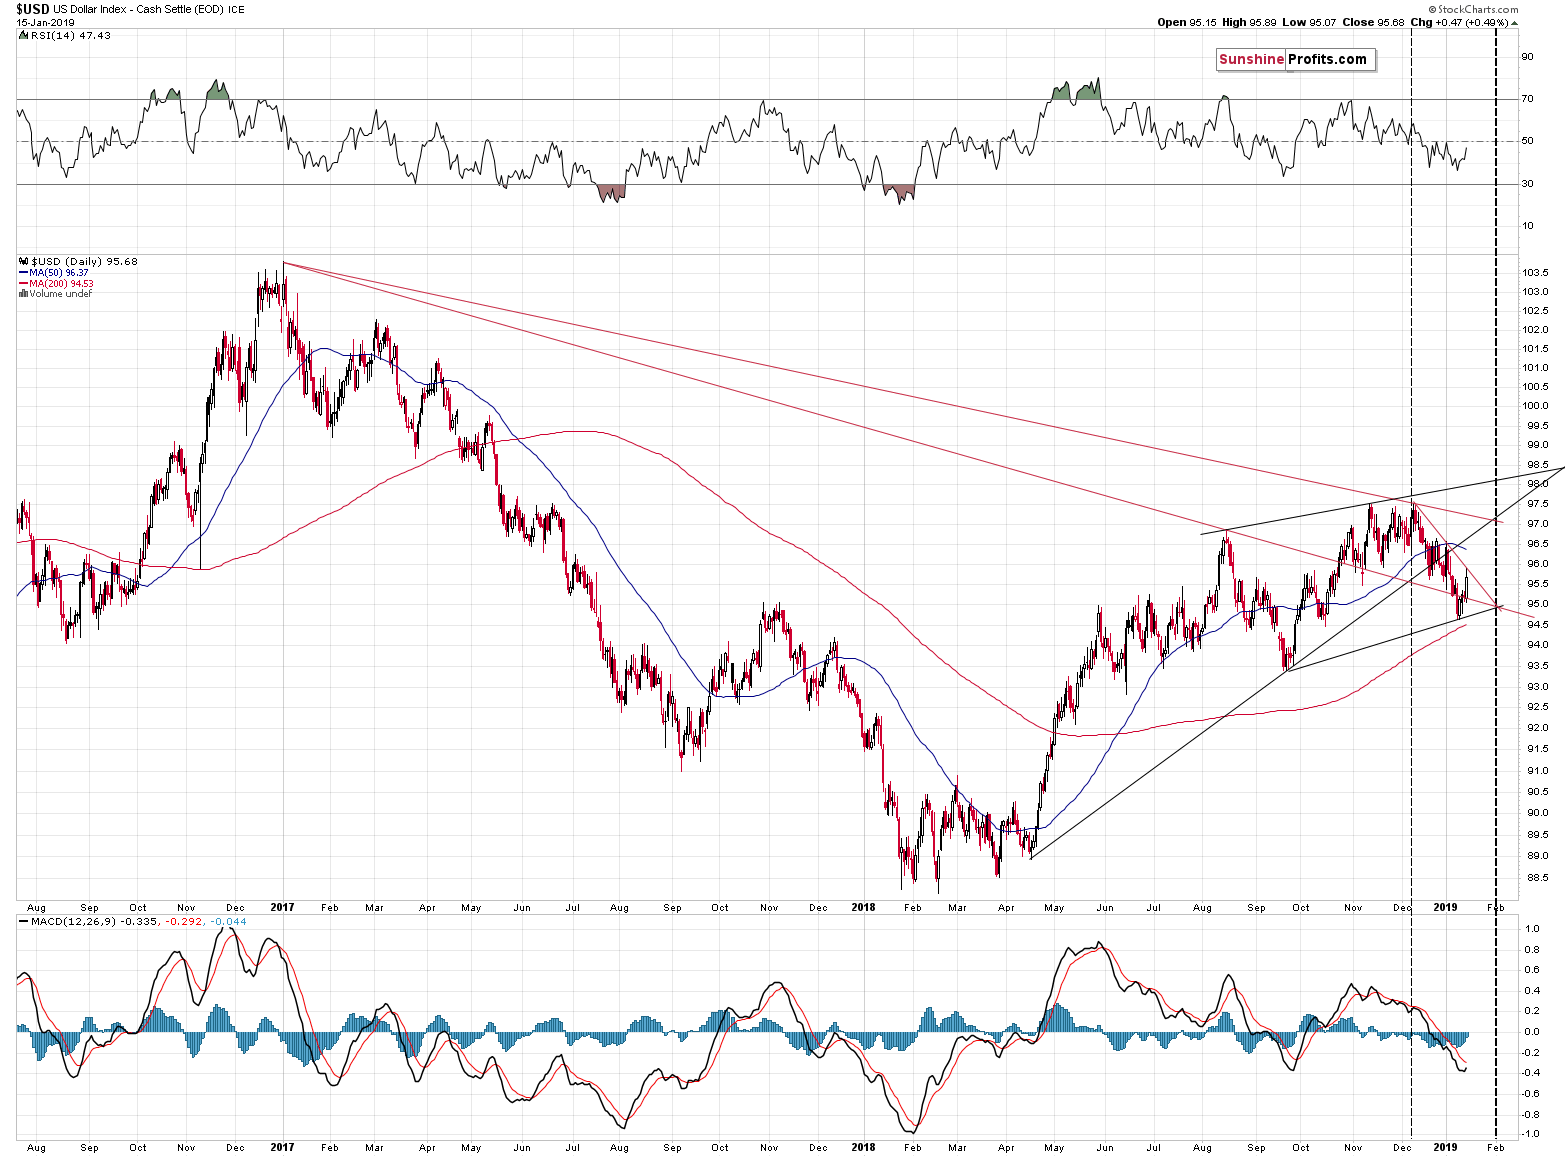
Namely, the USD Index is likely to reverse in a profound way at the end of January or in early days of February. Three vertexes confirm each other at that time. The previous vertex based on two of the lines creating the upcoming vertex indicated the December top, so it seems that it’s worth paying attention to this technique.
Knowing how miners performed yesterday and being aware of multiple bearish factors for the precious metals market, it seems that we might see a powerful USDX rally in the second part of the month. However, on a stand-alone basis, the USDX chart is not yet fully bullish.
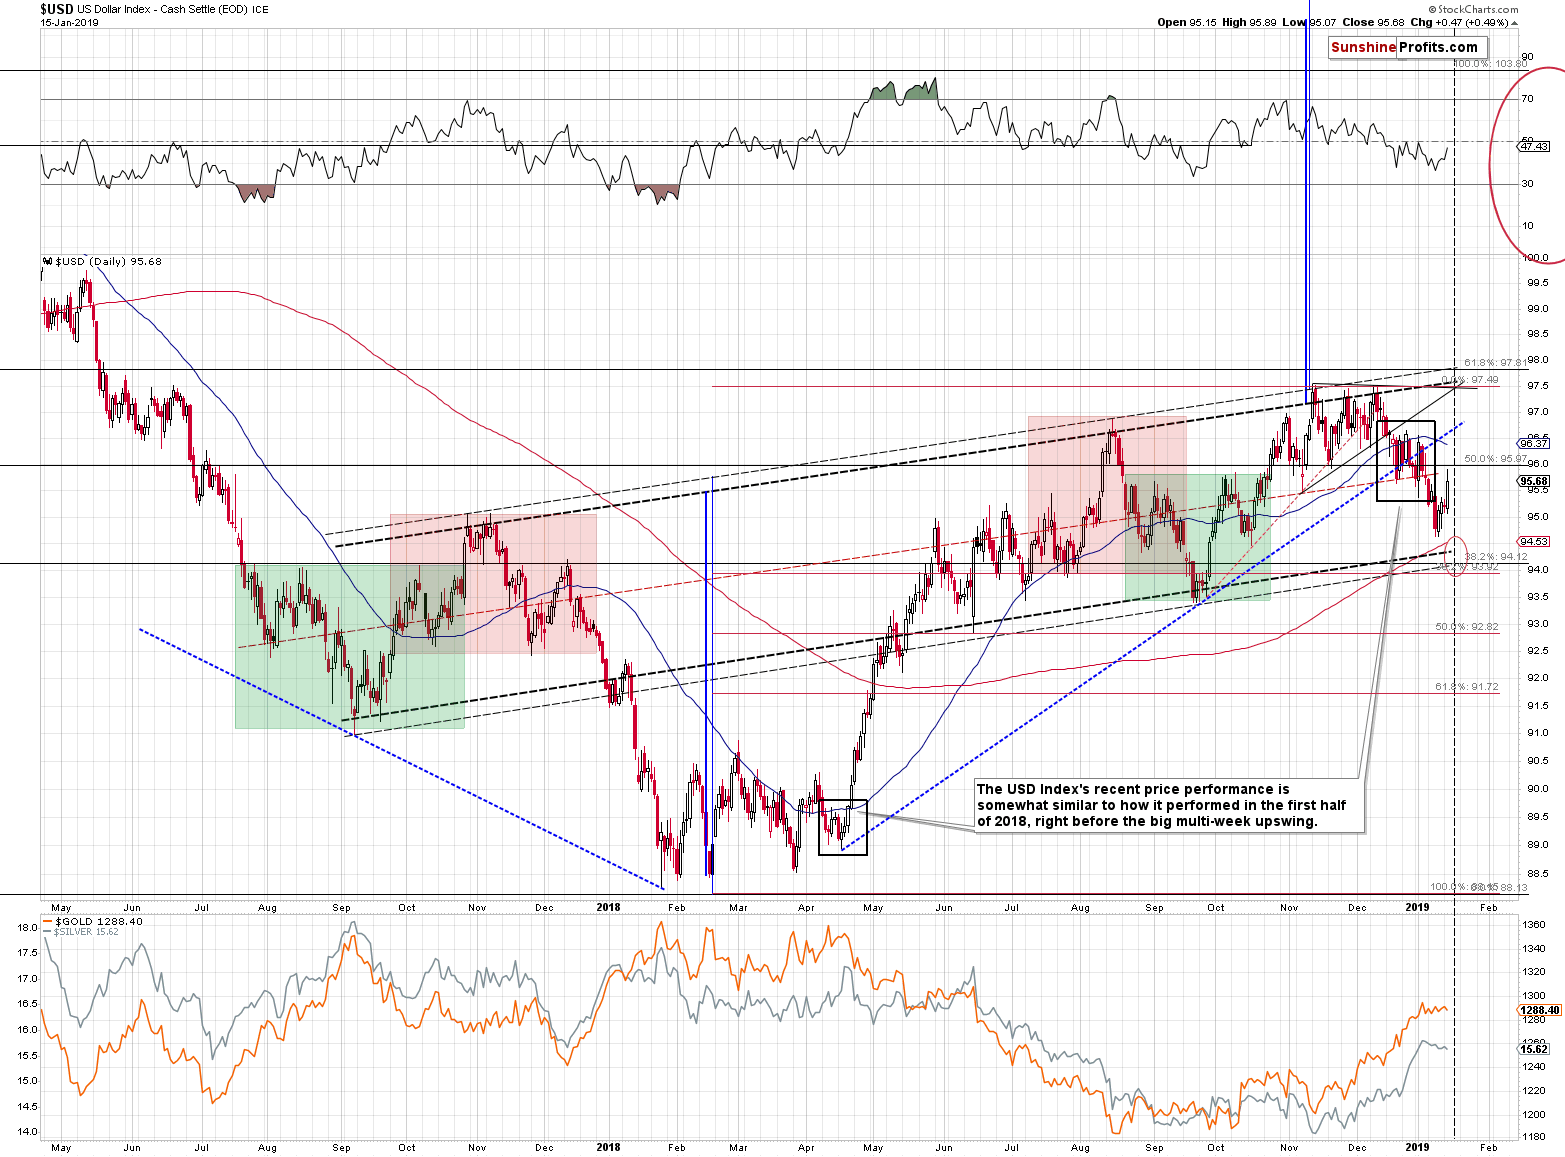
The short-term vertex-based reversal is just around the corner and the strong support levels were not yet reached. This means that the USD Index remains vulnerable to a quick decline. Such a move would likely trigger a rally in gold and silver – perhaps to the previous short-term highs, and it might indicate a move higher in the mining stocks of smaller magnitude. The miners might simply verify their previous breakdowns by moving back to the broken lines and then declining again.
This means that we should be aware that the next several may be volatile and that it shouldn’t really concern us as the big picture remains very bearish, and we saw new short-term confirmations from the mining stocks that we are already positioned correctly.
Summary
Summing up, even though the next several days could be volatile, due to the possible (not very likely, though) move lower in the USD Index, it doesn’t mean that the outlook changed. The bearish outlook for the following weeks is confirmed by multiple factors, i.a. silver’s extreme outperformance and miners’ underperformance, gold’s performance link with the general stock market, gold getting Cramerized, and the bullish medium-term outlook for the USD Index and bearish outlook for the key part thereof – the Japanese yen. Even if the USD Index moves lower in the next several days, it shouldn’t have a major impact on the prices of PMs. The recent breakdowns in the mining stocks suggest that more weakness in the PM market is just around the corner. Let’s keep in mind that it is the very high probability of a huge downswing that makes the short position justified, not the outlook for the next few days.
As always, we’ll keep you – our subscribers – informed.
To summarize:
Trading capital (supplementary part of the portfolio; our opinion): Full short positions (250% of the full position) in gold, silver and mining stocks are justified from the risk/reward perspective with the following stop-loss orders and exit profit-take price levels:
- Gold: profit-take exit price: $1,062; stop-loss: $1,313; initial target price for the DGLD ETN: $82.96; stop-loss for the DGLD ETN $44.97
- Silver: profit-take exit price: $12.32; stop-loss: $16.04; initial target price for the DSLV ETN: $47.67; stop-loss for the DSLV ETN $24.68
- Mining stocks (price levels for the GDX ETF): profit-take exit price: $13.12; stop-loss: $22.03; initial target price for the DUST ETF: $80.97; stop-loss for the DUST ETF $20.37
Note: the above is a specific preparation for a possible sudden price drop, it does not reflect the most likely outcome. You will find a more detailed explanation in our August 1st Alert. In case one wants to bet on junior mining stocks’ prices (we do not suggest doing so – we think senior mining stocks are more predictable in the case of short-term trades – if one wants to do it anyway, we provide the details), here are the stop-loss details and target prices:
- GDXJ ETF: profit-take exit price: $17.52; stop-loss: $32.03
- JDST ETF: initial target price: $154.97 stop-loss: $42.17
Long-term capital (core part of the portfolio; our opinion): No positions (in other words: cash)
Insurance capital (core part of the portfolio; our opinion): Full position
Important Details for New Subscribers
Whether you already subscribed or not, we encourage you to find out how to make the most of our alerts and read our replies to the most common alert-and-gold-trading-related-questions.
Please note that the in the trading section we describe the situation for the day that the alert is posted. In other words, it we are writing about a speculative position, it means that it is up-to-date on the day it was posted. We are also featuring the initial target prices, so that you can decide whether keeping a position on a given day is something that is in tune with your approach (some moves are too small for medium-term traders and some might appear too big for day-traders).
Plus, you might want to read why our stop-loss orders are usually relatively far from the current price.
Please note that a full position doesn’t mean using all of the capital for a given trade. You will find details on our thoughts on gold portfolio structuring in the Key Insights section on our website.
As a reminder – “initial target price” means exactly that – an “initial” one, it’s not a price level at which we suggest closing positions. If this becomes the case (like it did in the previous trade) we will refer to these levels as levels of exit orders (exactly as we’ve done previously). Stop-loss levels, however, are naturally not “initial”, but something that, in our opinion, might be entered as an order.
Since it is impossible to synchronize target prices and stop-loss levels for all the ETFs and ETNs with the main markets that we provide these levels for (gold, silver and mining stocks – the GDX ETF), the stop-loss levels and target prices for other ETNs and ETF (among other: UGLD, DGLD, USLV, DSLV, NUGT, DUST, JNUG, JDST) are provided as supplementary, and not as “final”. This means that if a stop-loss or a target level is reached for any of the “additional instruments” (DGLD for instance), but not for the “main instrument” (gold in this case), we will view positions in both gold and DGLD as still open and the stop-loss for DGLD would have to be moved lower. On the other hand, if gold moves to a stop-loss level but DGLD doesn’t, then we will view both positions (in gold and DGLD) as closed. In other words, since it’s not possible to be 100% certain that each related instrument moves to a given level when the underlying instrument does, we can’t provide levels that would be binding. The levels that we do provide are our best estimate of the levels that will correspond to the levels in the underlying assets, but it will be the underlying assets that one will need to focus on regarding the signs pointing to closing a given position or keeping it open. We might adjust the levels in the “additional instruments” without adjusting the levels in the “main instruments”, which will simply mean that we have improved our estimation of these levels, not that we changed our outlook on the markets. We are already working on a tool that would update these levels on a daily basis for the most popular ETFs, ETNs and individual mining stocks.
Our preferred ways to invest in and to trade gold along with the reasoning can be found in the how to buy gold section. Additionally, our preferred ETFs and ETNs can be found in our Gold & Silver ETF Ranking.
As a reminder, Gold & Silver Trading Alerts are posted before or on each trading day (we usually post them before the opening bell, but we don't promise doing that each day). If there's anything urgent, we will send you an additional small alert before posting the main one.
=====
Latest Free Trading Alerts:
If Bitcoin bulls got excited about the recent move up, Thursday’s action extinguished some of this excitement. But it doesn’t come as a surprise to our readers. This one day of strong depreciation can be seen as an indication of things to come. But are these things bearish?
=====
Thank you.
Sincerely,
Przemyslaw Radomski, CFA
Editor-in-chief, Gold & Silver Fund Manager

