

Briefly: In our opinion, full (150% of the regular full position) speculative short positions in gold, silver and mining stocks are justified from the risk/reward perspective at the moment of publishing this alert.
Once again nothing really happened in the precious metals market yesterday, so there is not much that we can comment on today. However, we received a few requests to discuss the situation in the USD Index, so that’s what we’re going to do today.
To a large extent, today’s alert will be a follow-up to the May 22, 2017 alert, where we had discussed the outlook for the USD in greater detail. What you find below will be a big quote from the mentioned alert with changes in appropriate paragraphs.
Let’s take a look at the long-term USD Index chart as it’s key to understanding what’s going on in the currency market (charts courtesy of http://stockcharts.com).
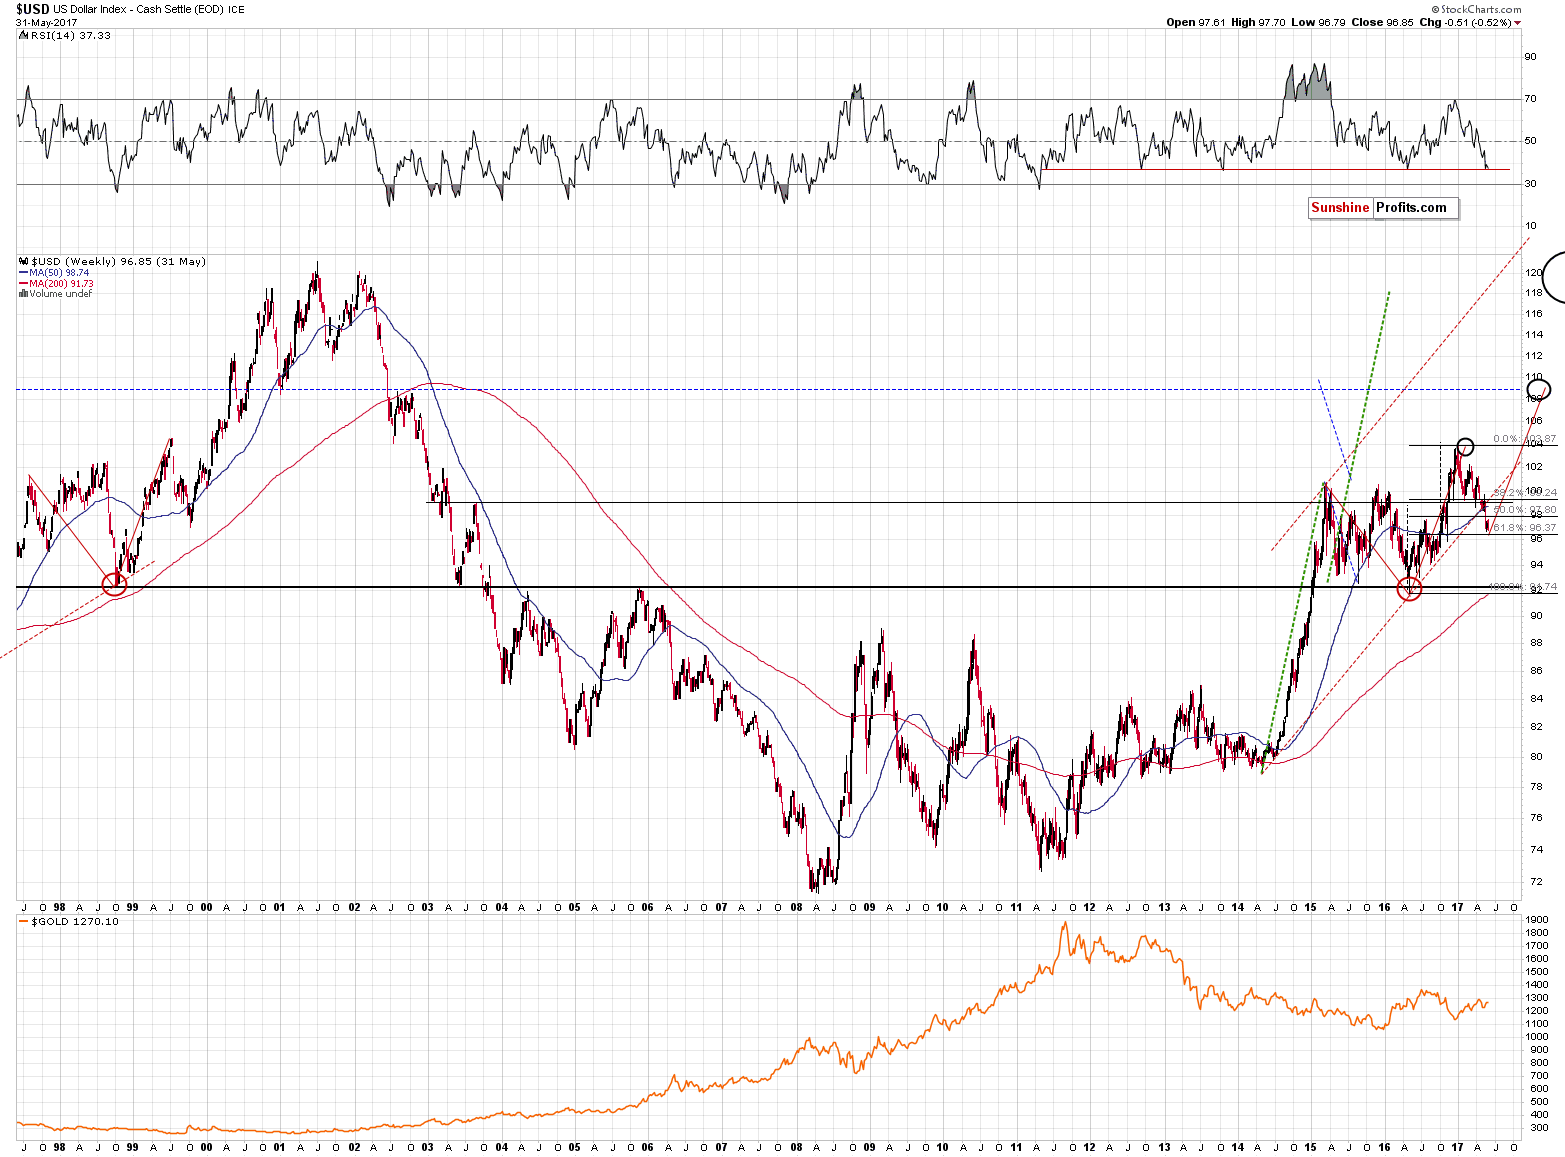
Let’s start with the RSI indicator. The RSI, in its current position (horizontal, red line), has been pointing to local bottoms since the 2011 bottom. In other words, the USD Index is currently almost as oversold from the medium-term point of view as it was at the multi-year bottom. What’s even more interesting is that given the fact that gold reflects the USD’s movement in the case of big moves, the current position of the USD’s RSI has bearish implications for the yellow metal.
Was the reflective analogy to the 2002 – 2009 decline invalidated recently? No – only its direct application. Obviously, the USD didn’t bottom at the level at which it had ended the decline in early 2003. However, the general shape of the action in the USD before and after 2009 is still similar and the current short-term deviation doesn’t invalidate it. The short term would have invalidated the analogy, if the post-2009 rally had reflected the pre-2009 movement to the letter, but this wasn’t the case. The moves were analogous only on a more-or-less basis.
Moreover, please note that the size of the correction that we saw in the middle of 2003 and the size of the correction that we saw in 2015 and 2016 are different, but very alike on a more-or-less basis. The correction in 2015 started from higher levels than the 2003 top and it ended below the 2003 bottom, but, more or less, the USD corrected a similar amount.
Did the current deviation (that is, the sizable short-term decline) change the analogy on a more-or-less basis? No – the upswing that we are seeing is still intact.
The USD Index remains above the 61.8% Fibonacci retracement level (about 96.40) of the entire 2016 rally and thus this year’s decline – although sizable – is still a corrective downswing and not a new bear market. Naturally, this retracement provides powerful support and this – accompanied by the current value of the RSI and the general analogy to the previous long-term decline make the technical picture for the USD bullish for the following months.
There are good fundamental reasons for a big rally in the USD Index as well – the interest rates in the U.S. are likely going up while we just heard from Draghi that the Eurozone still requires monetary stimulus. Japan is not likely to stop printing money at great pace either. The above is bullish for the value of the U.S. currency and bearish for both the euro and the yen. The latter are the biggest components of the USD Index and since it seems that the relative (!) valuation of USD compared to EUR and JPY is likely to increase, the value of the USD Index should increase as well.
Additionally, USD and the likely turnaround at about 96.4 makes the upside target at about 109 even more likely. This level was a likely target based on the 2002 tops and the extrapolation of the size of the 2015-2016 correction (the size of the correction often corresponds to the size of the follow-up rally). Now, it’s likely to be confirmed by yet another technique. The rally that follows a downward correction is likely to be similar to the rally that has preceded it. Both rallies: the 2016 one and the likely upcoming one, are marked on the above chart with solid, red lines. The latter ends approximately at 109, which makes it even more likely as a target level than was the case previously.
Summing up, the medium-term outlook for the USD Index remains bullish and the outlook for the precious metals sector remains bearish. The USD Index could still decline before turning up again, but it’s likely that the decline would not be significant.
As always, we will keep you – our subscribers – informed.
To summarize:
Trading capital (supplementary part of the portfolio; our opinion): Short positions (150% of the full position) in gold, silver and mining stocks are justified from the risk/reward perspective with the following stop-loss orders and initial target price levels / profit-take orders:
- Gold: exit-profit-take level: $1,063; stop-loss: $1,317; initial target price for the DGLD ETN: $81.88; stop-loss for the DGLD ETN $44.57
- Silver: initial target price: $13.12; stop-loss: $19.22; initial target price for the DSLV ETN: $46.18; stop-loss for the DSLV ETN $17.93
- Mining stocks (price levels for the GDX ETF): initial target price: $9.34; stop-loss: $26.34; initial target price for the DUST ETF: $143.56; stop-loss for the DUST ETF $21.37
In case one wants to bet on junior mining stocks' prices (we do not suggest doing so – we think senior mining stocks are more predictable in the case of short-term trades – if one wants to do it anyway, we provide the details), here are the stop-loss details and initial target prices:
- GDXJ ETF: initial target price: $14.13; stop-loss: $45.31
- JDST ETF: initial target price: $417.04; stop-loss: $43.12
Long-term capital (core part of the portfolio; our opinion): No positions (in other words: cash)
Insurance capital (core part of the portfolio; our opinion): Full position
Please note that the in the trading section we describe the situation for the day that the alert is posted. In other words, it we are writing about a speculative position, it means that it is up-to-date on the day it was posted. We are also featuring the initial target prices, so that you can decide whether keeping a position on a given day is something that is in tune with your approach (some moves are too small for medium-term traders and some might appear too big for day-traders).
Plus, you might want to read why our stop-loss orders are usually relatively far from the current price.
Please note that a full position doesn’t mean using all of the capital for a given trade. You will find details on our thoughts on gold portfolio structuring in the Key Insights section on our website.
As a reminder – “initial target price” means exactly that – an “initial” one, it’s not a price level at which we suggest closing positions. If this becomes the case (like it did in the previous trade) we will refer to these levels as levels of exit orders (exactly as we’ve done previously). Stop-loss levels, however, are naturally not “initial”, but something that, in our opinion, might be entered as an order.
Since it is impossible to synchronize target prices and stop-loss levels for all the ETFs and ETNs with the main markets that we provide these levels for (gold, silver and mining stocks – the GDX ETF), the stop-loss levels and target prices for other ETNs and ETF (among other: UGLD, DGLD, USLV, DSLV, NUGT, DUST, JNUG, JDST) are provided as supplementary, and not as “final”. This means that if a stop-loss or a target level is reached for any of the “additional instruments” (DGLD for instance), but not for the “main instrument” (gold in this case), we will view positions in both gold and DGLD as still open and the stop-loss for DGLD would have to be moved lower. On the other hand, if gold moves to a stop-loss level but DGLD doesn’t, then we will view both positions (in gold and DGLD) as closed. In other words, since it’s not possible to be 100% certain that each related instrument moves to a given level when the underlying instrument does, we can’t provide levels that would be binding. The levels that we do provide are our best estimate of the levels that will correspond to the levels in the underlying assets, but it will be the underlying assets that one will need to focus on regarding the signs pointing to closing a given position or keeping it open. We might adjust the levels in the “additional instruments” without adjusting the levels in the “main instruments”, which will simply mean that we have improved our estimation of these levels, not that we changed our outlook on the markets. We are already working on a tool that would update these levels on a daily basis for the most popular ETFs, ETNs and individual mining stocks.
Our preferred ways to invest in and to trade gold along with the reasoning can be found in the how to buy gold section. Additionally, our preferred ETFs and ETNs can be found in our Gold & Silver ETF Ranking.
As always, we'll keep you - our subscribers - updated should our views on the market change. We will continue to send out Gold & Silver Trading Alerts on each trading day and we will send additional Alerts whenever appropriate.
The trading position presented above is the netted version of positions based on subjective signals (opinion) from your Editor, and the Tools and Indicators.
As a reminder, Gold & Silver Trading Alerts are posted before or on each trading day (we usually post them before the opening bell, but we don't promise doing that each day). If there's anything urgent, we will send you an additional small alert before posting the main one.
=====
Hand-picked precious-metals-related links:
Gold hits one-week low as stocks, dollar gain after upbeat U.S. data
66-year chart of beer vs gold price may lead to (heavy) drinking
Silver, Gold Coin Sales Down More Than 50% For The Year
Asia Gold-Indian prices slip to discount ahead of new sales tax policy
=====
In other news:
Strong U.S. job growth expected in May; wage rise seen moderate
UK PM May's lead over Labour shrinks to 5 points: Ipsos MORI poll
World stocks set to end the week at all-time highs
What Did Trump Just Do? The Paris Climate Withdrawal Explained
India's slowing growth blamed on 'big mistake' of demonetisation
=====
Thank you.
Sincerely,
Przemyslaw Radomski, CFA
Founder, Editor-in-chief, Gold & Silver Fund Manager
Gold & Silver Trading Alerts
Forex Trading Alerts
Oil Investment Updates
Oil Trading Alerts

