

Briefly: In our opinion, full (150% of the regular full position) speculative short positions in gold, silver and mining stocks are justified from the risk/reward perspective at the moment of publishing this alert.
The precious metals market moved higher last week, but the real action was seen in the USD Index, which declined substantially, broke and closed the week below important support levels. How much did just change for the USD and the precious metals market?
Let’s jump right into charts (charts courtesy of http://stockcharts.com).
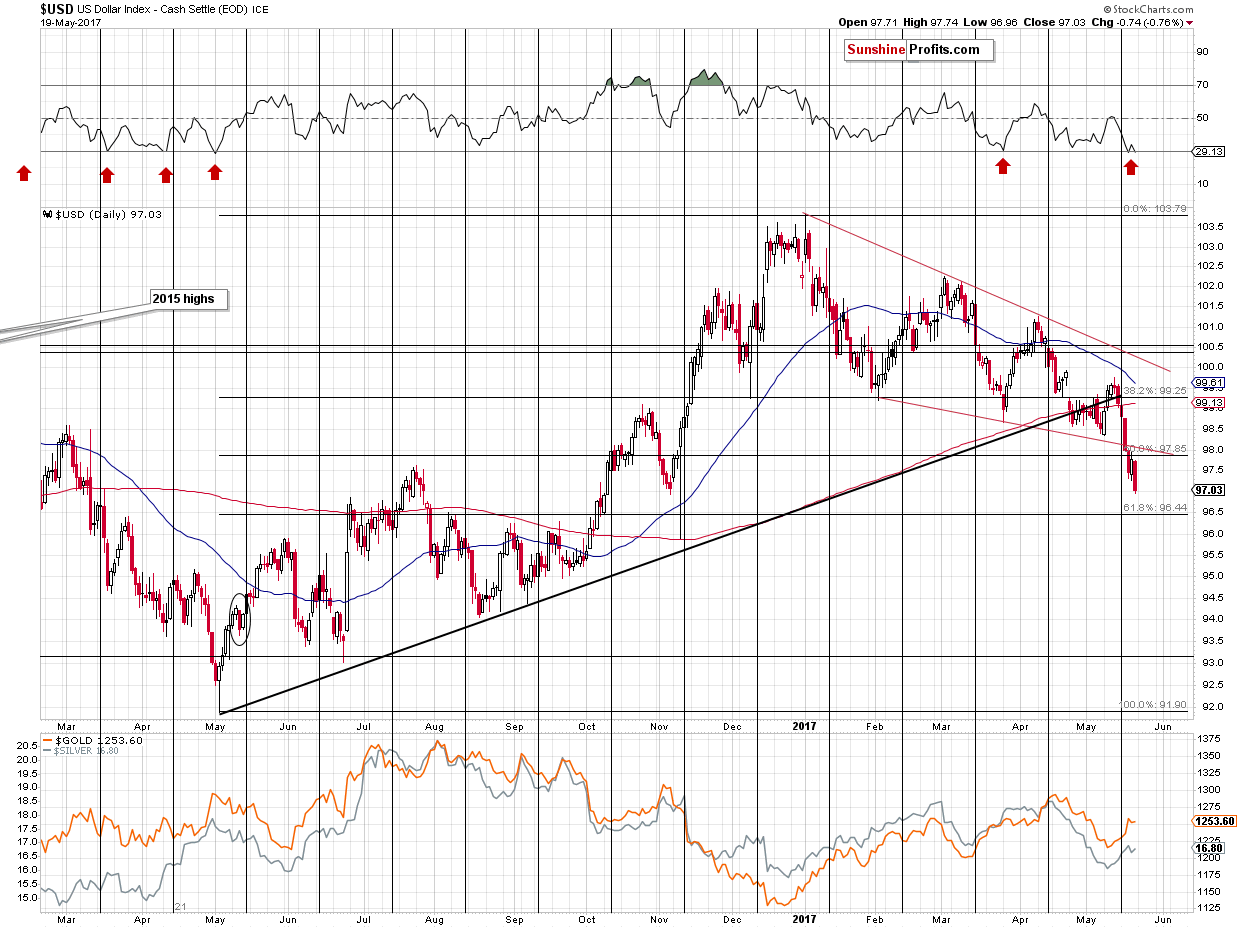
Quite a lot changed at the end of the previous week and the implications of the above chart are currently bearish for the short-term. Even though the USD Index had moved higher on Thursday and had ended the session close to the previously broken lower border of the declining wedge pattern, it declined on Friday once again, closing the week well below the declining wedge and below the 50% Fibonacci retracement.
The above makes it likely for the USD Index to decline to the next important support line before turning up again. Such support is provided by the 61.8% Fibonacci retracement at about 96.4. So, the USD Index is now likely to decline by about 0.5 and then it’s still likely to rally.
The RSI indicator is already a bit below 30, which suggests that the bottom is in or at hand – we marked analogous situations in the recent past with red arrows – the USD bottomed in each case.
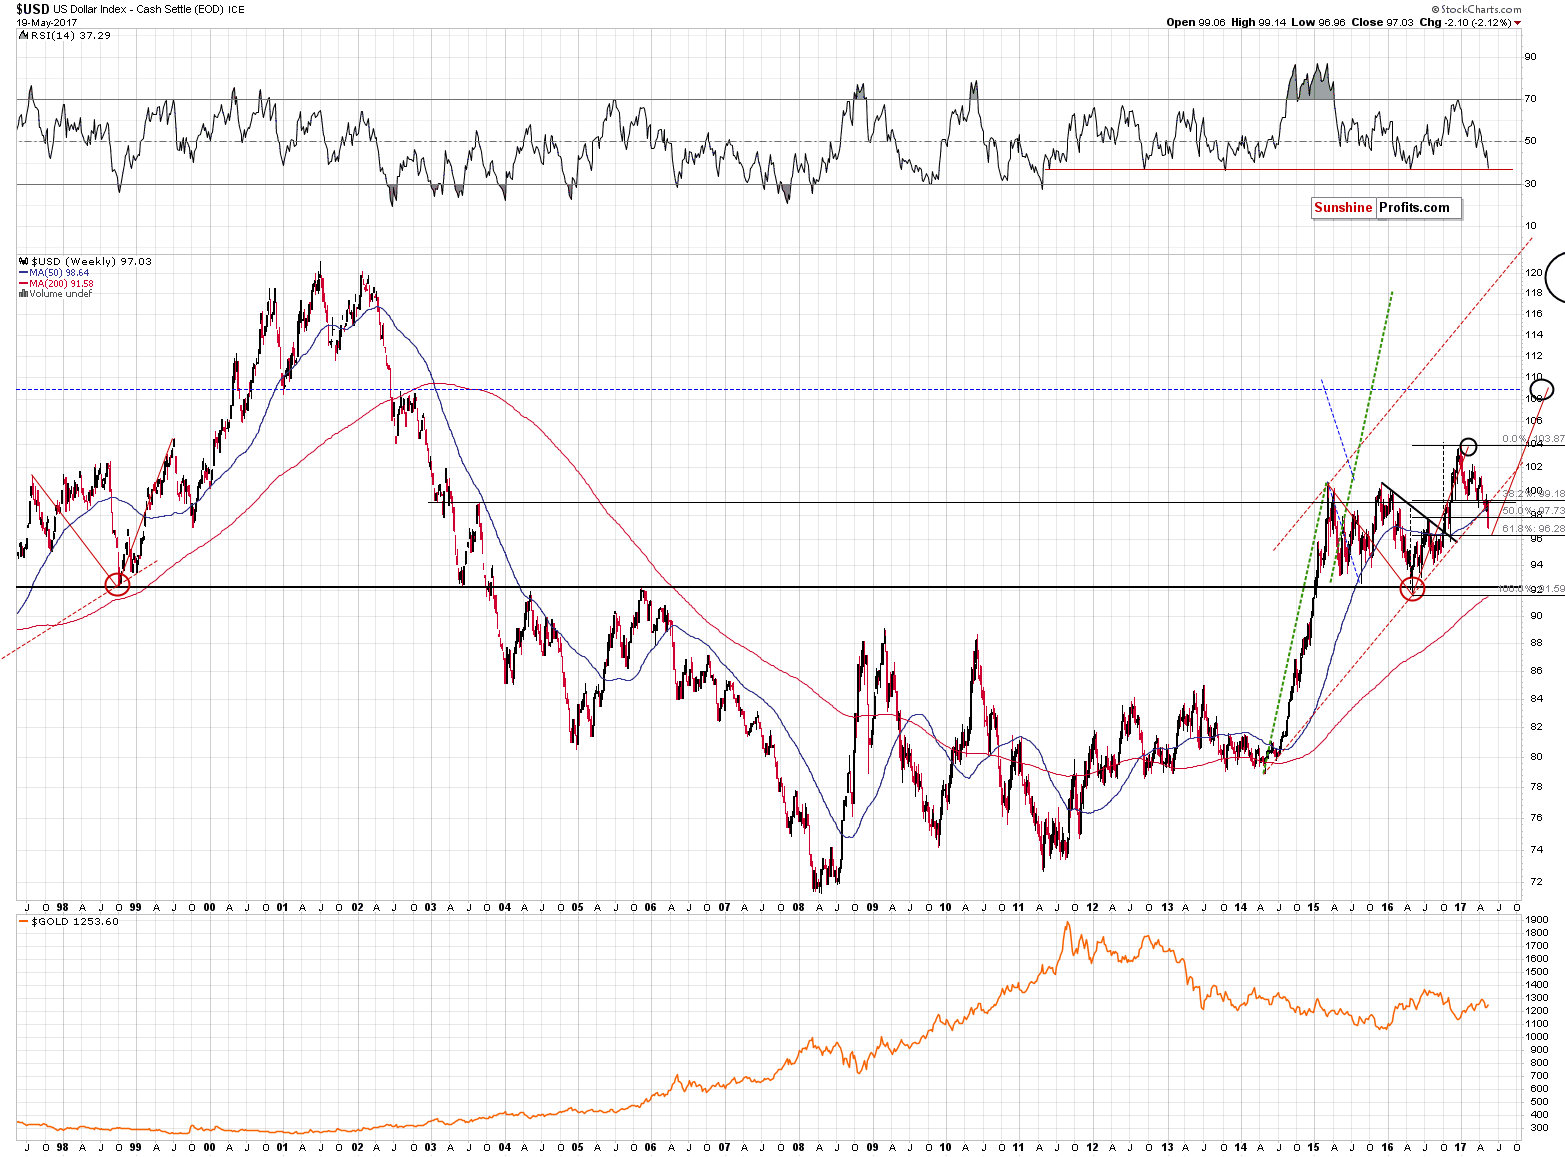
In fact, the RSI indicator in its current position has been pointing to local bottoms since the 2011 bottom. In other words, the USD Index is currently almost as oversold from the medium-term point of view as it was at the multi-year bottom. What’s even more interesting is that given the fact that gold reflects the USD movement in the case of big moves, the current position of the USD’s RSI has bearish implications for the yellow metal.
Was the reflective analogy to the 2002 – 2009 decline just invalidated? No – only its direct application. Obviously, the USD didn’t bottom at the level at which it had ended the decline in early 2003. However, the general shape of the action in the USD before and after 2009 is still similar and the current short-term deviation doesn’t invalidate it. The short term would have invalidated the analogy, if the post-2009 rally had reflected the pre-2009 movement to the letter, but this wasn’t the case. The moves were analogous only on a more-or-less basis.
Moreover, please note that the size of the correction that we saw in the middle of 2003 and the size of the correction that we saw in 2015 and 2016 are different, but very alike on a more-or-less basis. The correction in 2015 started from higher levels than the 2003 top and it ended below the 2003 bottom, but, more or less, the USD corrected a similar amount.
Did the current deviation (that is, the sizable short-term decline) change the analogy on a more-or-less basis? No – the upswing that we are seeing is still intact.
We would like add one more thing before moving to precious metals. The decline in the USD and the likely turnaround at about 96.4 makes the upside target at about 109 even more likely. This level was a likely target based on the 2002 tops and the extrapolation of the size of the 2015-2016 correction (the size of the correction often corresponds to the size of the follow-up rally). Now, it’s likely to be confirmed by yet another technique. The rally that follows a downward correction is likely to be similar to the rally that has preceded it. Both rallies: the 2016 one and the likely upcoming one, are marked on the above chart with solid, red lines. The latter ends approximately at 109, which makes it even more likely as a target level than was the case previously.
So, with a short-term decline being likely for the USD Index before another big rally, does the outlook for the precious metals market change?
In Thursday’s and Friday’s alert, we wrote the following regarding the mining stocks’ reaction to the moves in gold:
[Thursday]
The interesting thing to watch yesterday was the intra-day performance of mining stocks compared to the price of gold. Mining stocks moved higher along with gold (not rallying as significantly, but still), but when gold gave away only a part of its gains miners reacted by declining more significantly. As gold moved higher – and above the previous intra-day high – miners also moved higher, but not above the previous intra-day high. This action took place a few times and it shows how reluctant mining stocks are to react to positive developments in the gold market.
[Friday]
The same kind of reaction is present also in terms of days. Yesterday, gold moved and closed the session several dollars below the previous close, but it didn’t erase the entire rally – it didn’t even erase half of the daily rally. At the same time mining stocks declined and not only erased the previous day’s decline, but also erased a week of daily rallies (yesterday’s close was the lowest since May 11th).
Moreover, the volume that we saw yesterday was the highest reading in May – the decline appears to be more representative of the current market sentiment than the previous days’ upswings.
Miners definitely don’t want to react to bullish news but are eager to react to bearish ones. The implications for the entire precious metals sector are bearish.
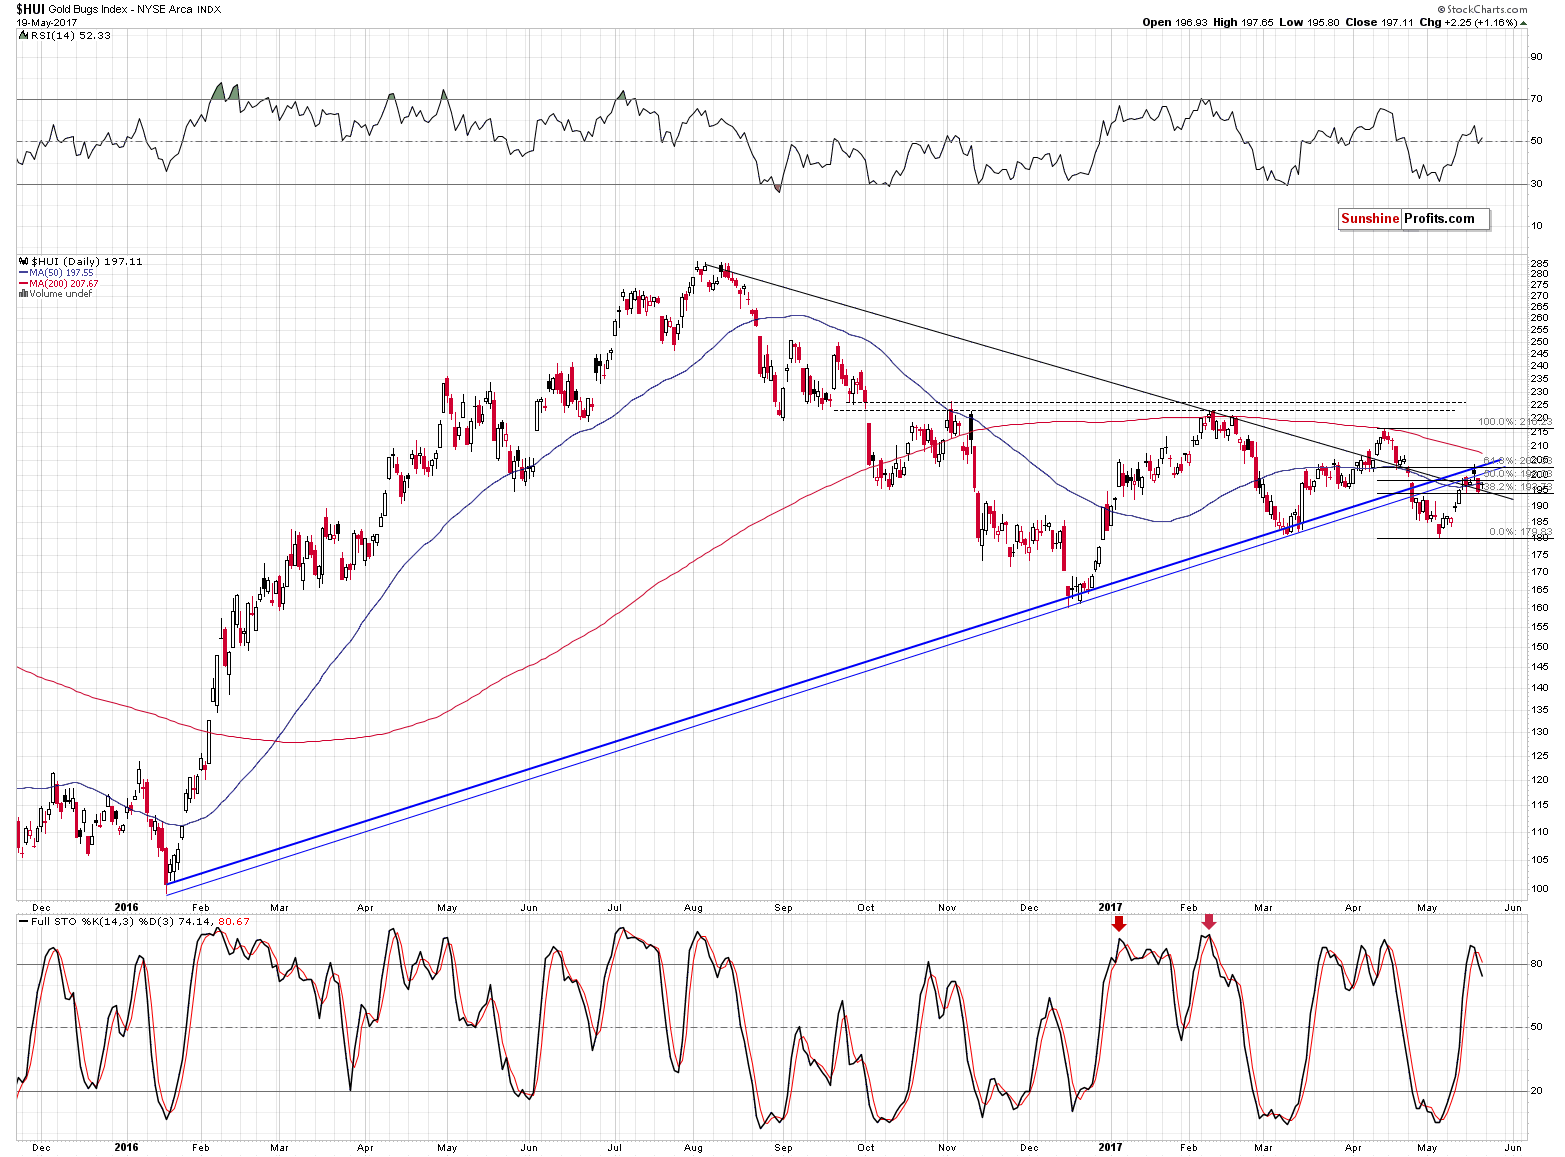
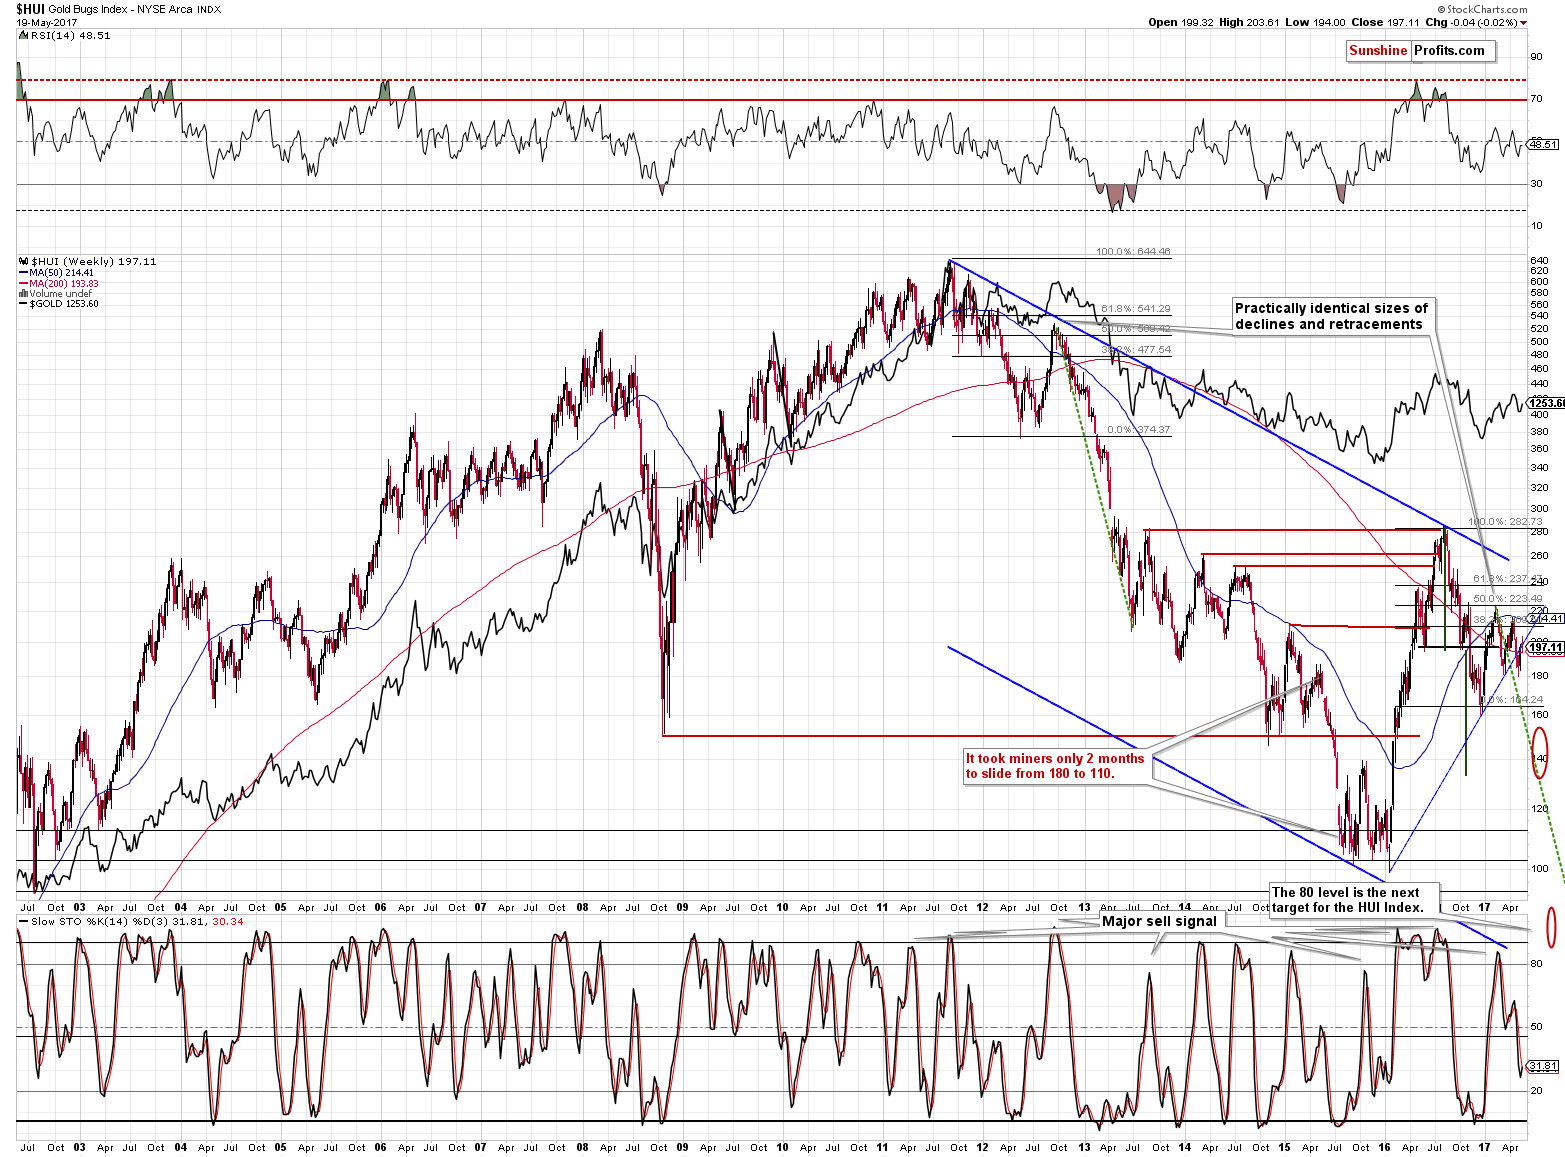
Gold stocks just had a very good reason to rally – the USD Index moved to new lows and how did they react? Miners underperformed once again thus further confirming the bearish outlook. Moreover, miners closed the week visibly below the rising blue support line based on the 2016 and 2017 bottoms. There was no invalidation of the breakdown and thus the outlook remains bearish based on it as well.
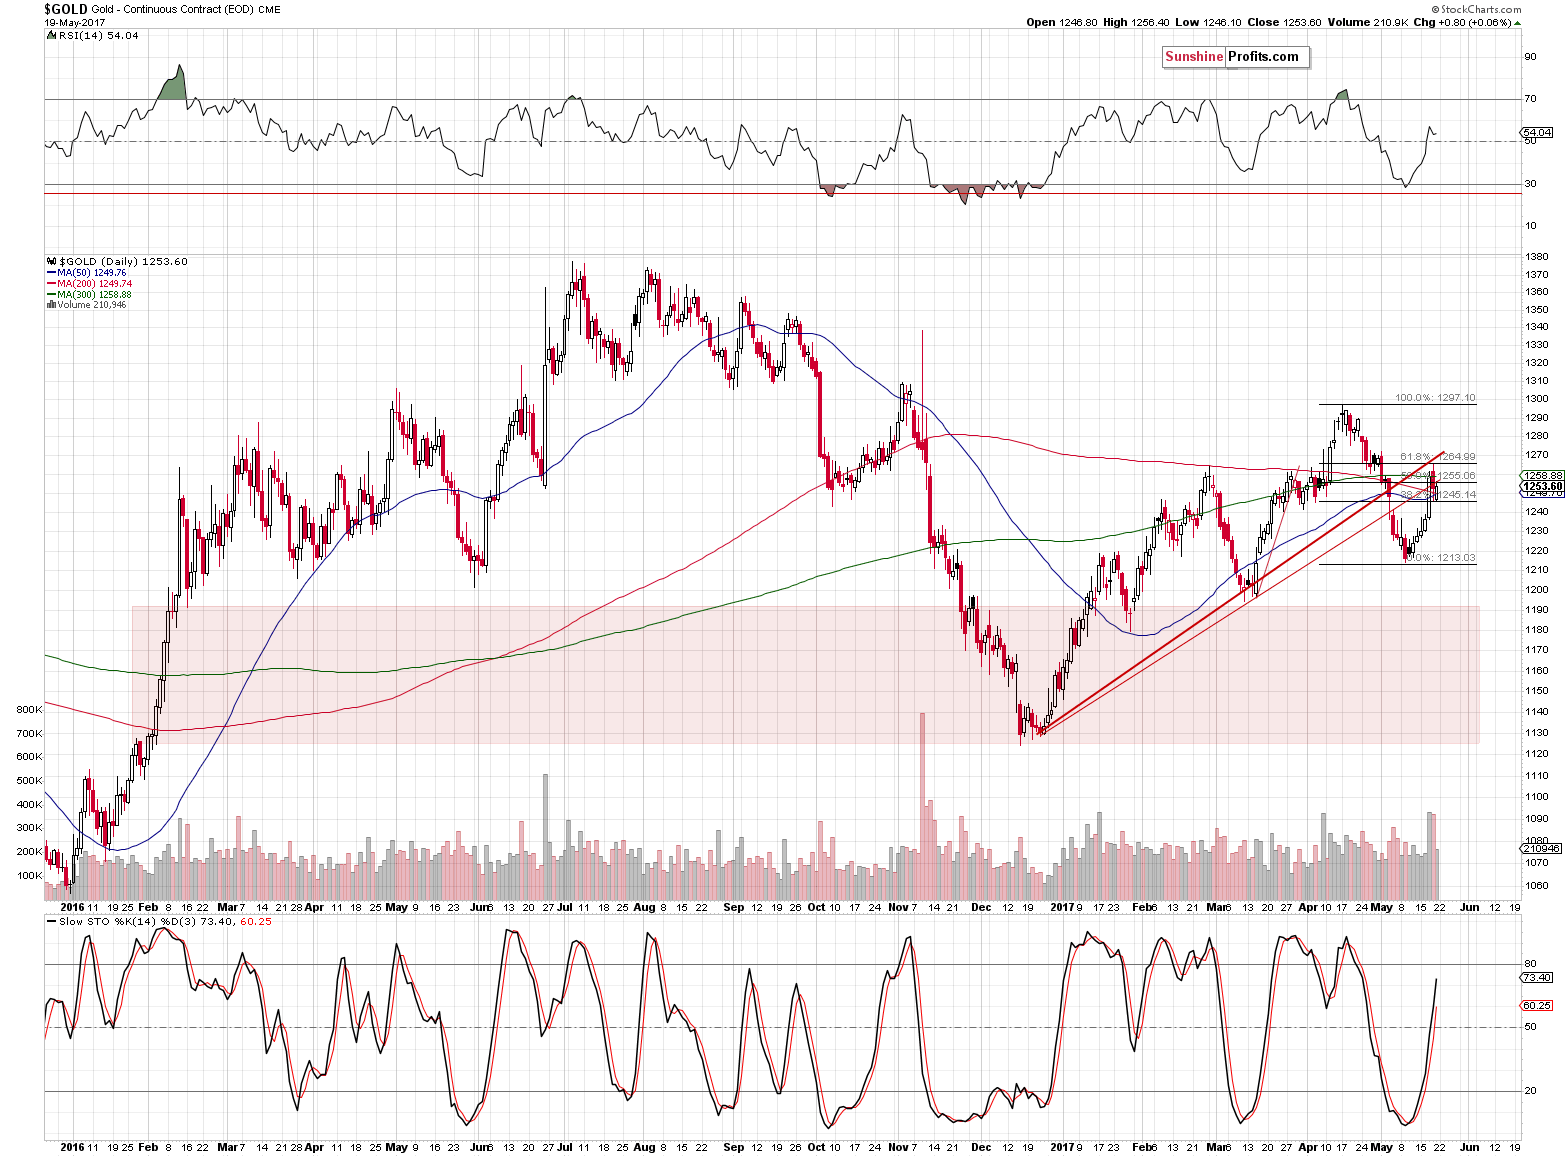
Gold closed the week below its own rising resistance line (both of them) and thus the breakdown below it remains intact and the implications remain bearish.
From the long-term point of view, gold’s price movement remains in tune with the previous decline and our Thursday’s comments on it remain up-to-date:
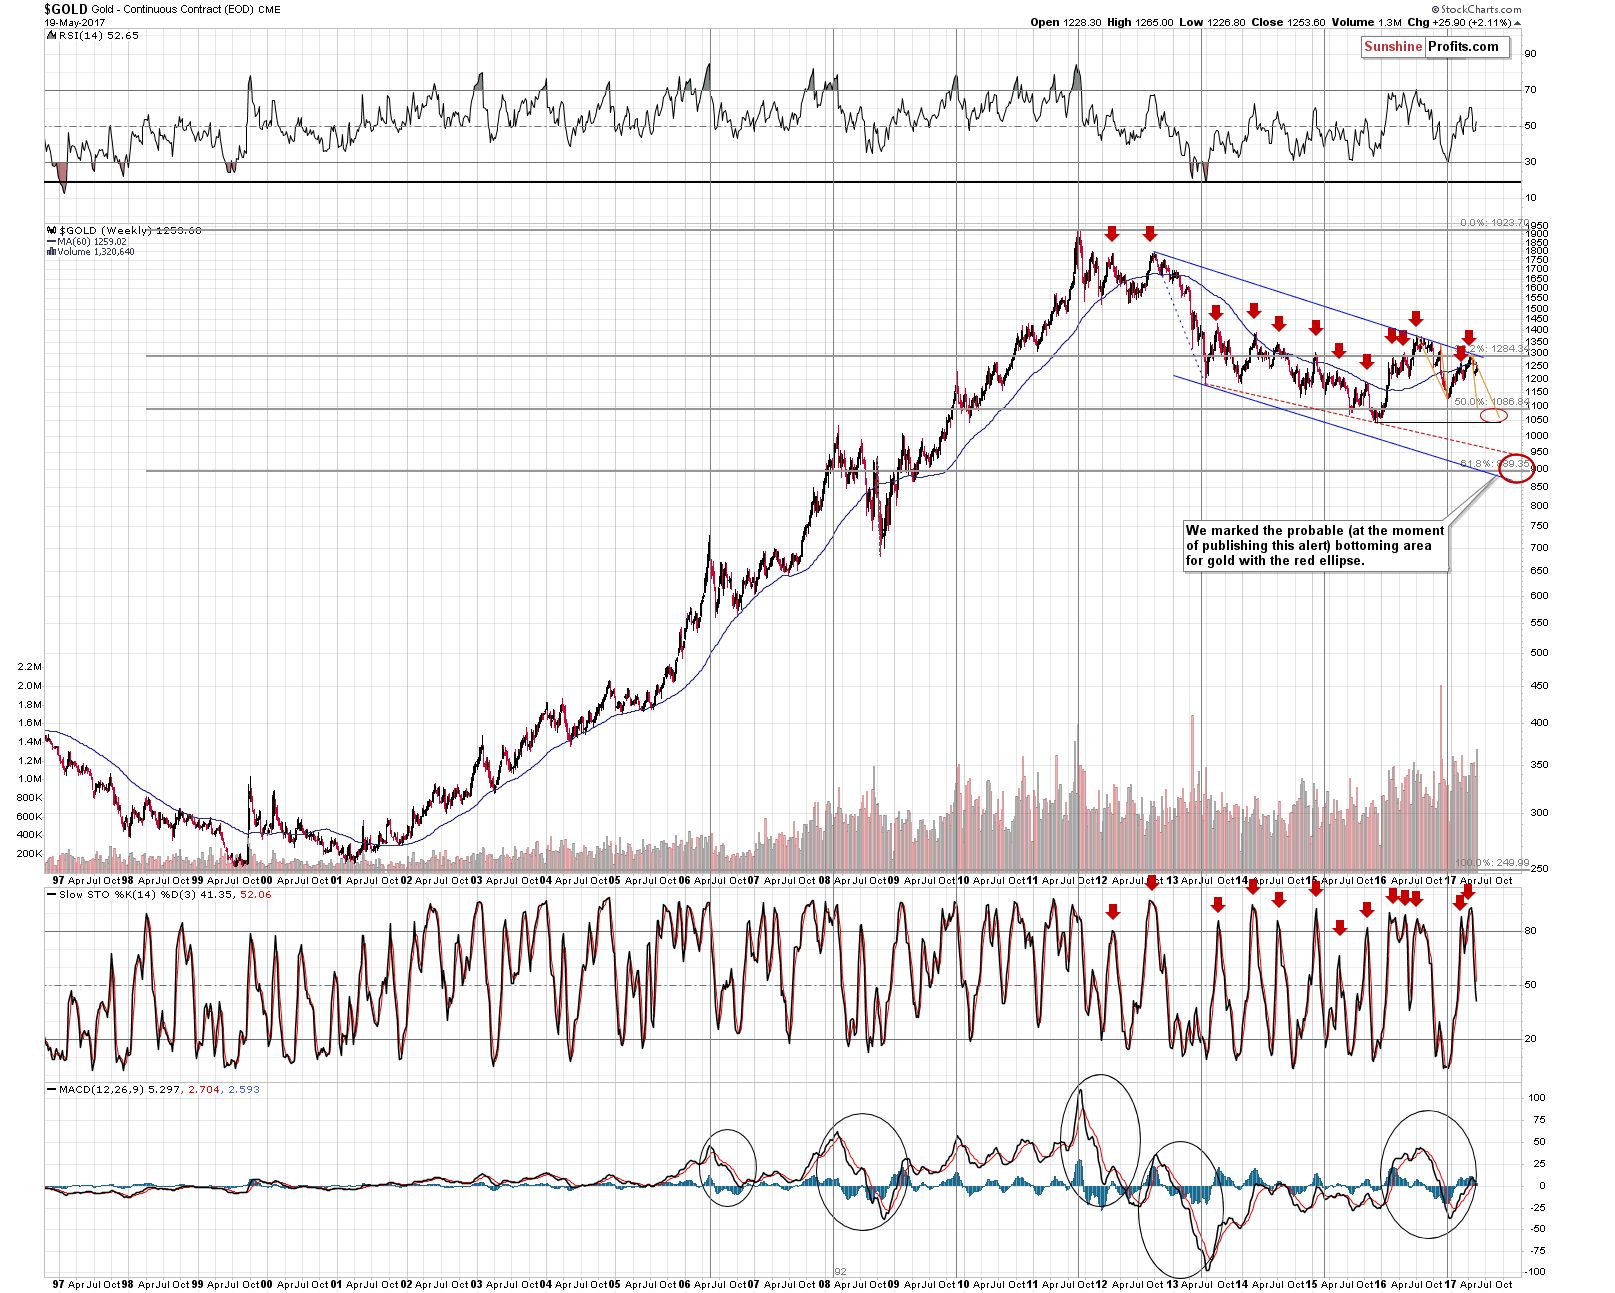
First of all, gold’s upswing remains in tune with the late-2016 decline. Please note that the orange lines represent the pace of the decline based on 2 important tops – each analogy is important and as long as gold remains between these lines or deviates from them in just a minor way, then the 2 declines will remain similar. Based on this analogy gold is likely to move close to its 2015 lows sometime this summer.
Secondly, please note that gold is not only verifying the breakdown below the rising support line (as seen on the previous chart), but also below the 60-week moving average. There was no big move above it (gold remains below it at the moment of writing these words), so the proximity of such an important resistance is a bearish factor.
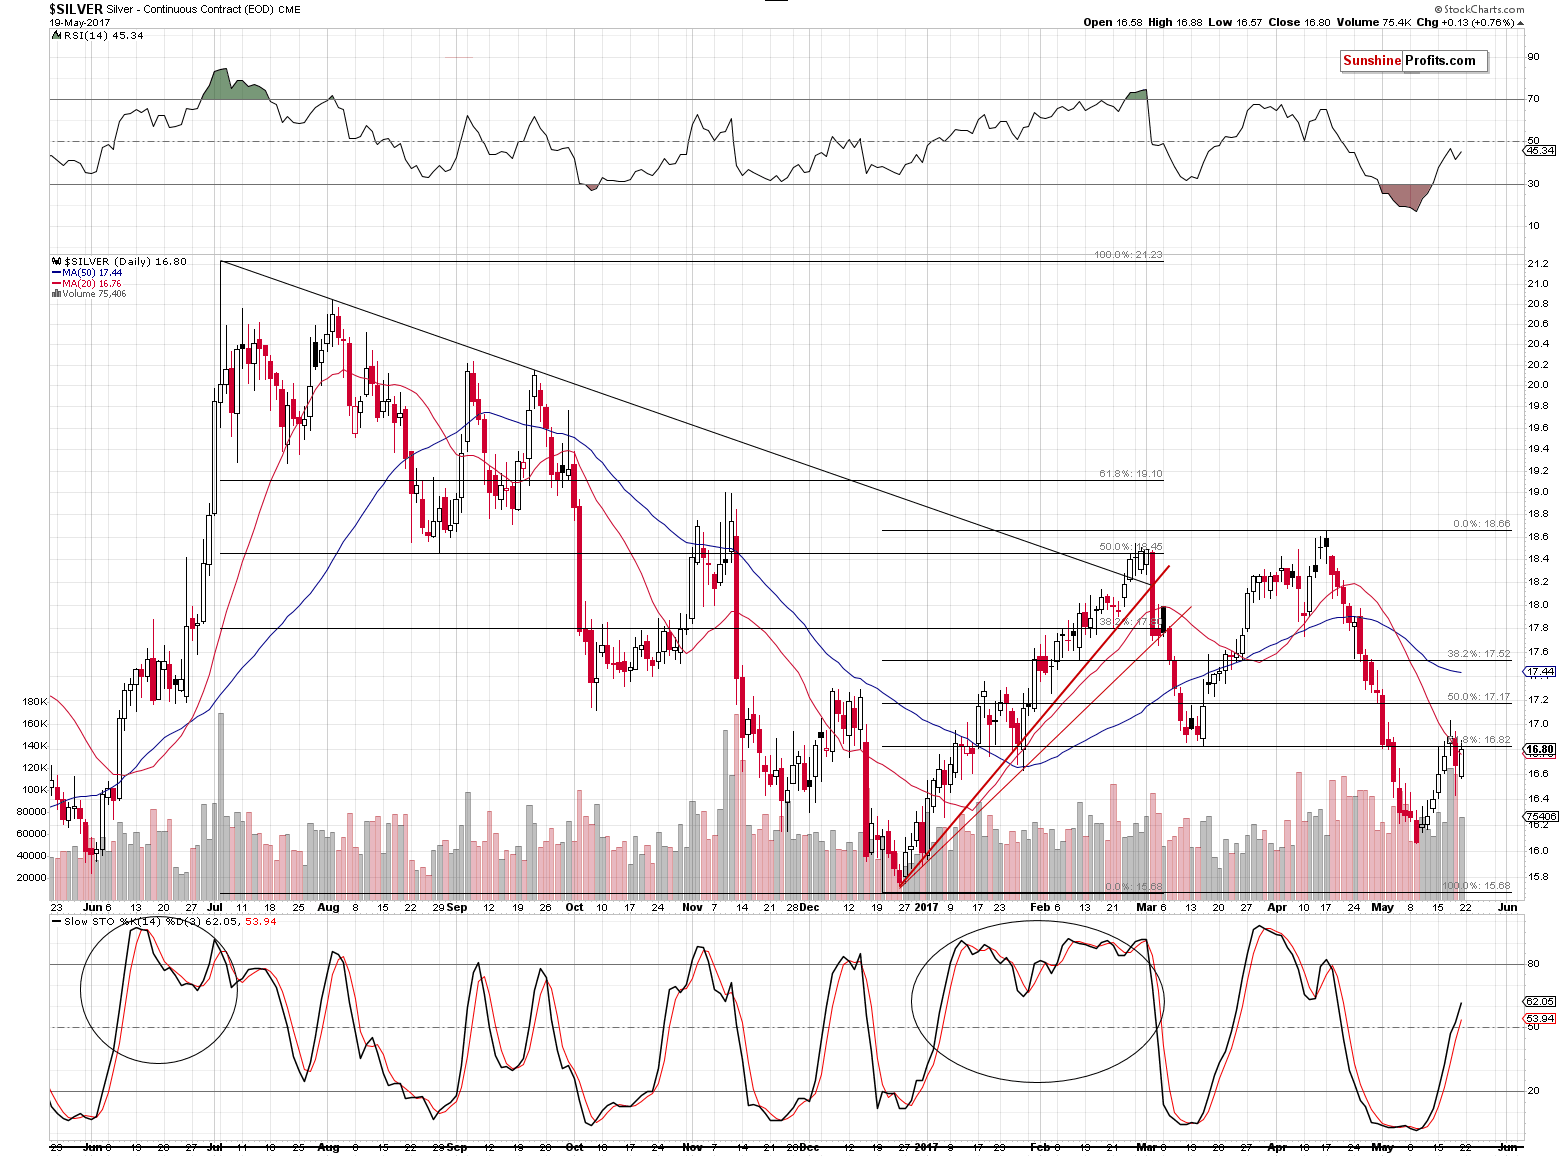
Silver moved 13 cents higher as a response to the USD’s big slide – not a significant reaction, to say the least. We were expecting the move above the first Fibonacci retracement and the March lows to be invalidated and that’s exactly what happened. Silver declined below this resistance on Thursday and didn’t move back above it on Friday. Since silver closed the week below the mentioned levels, we can view these levels as unbroken and any temporary move above them as invalidated. The implications remain bearish.
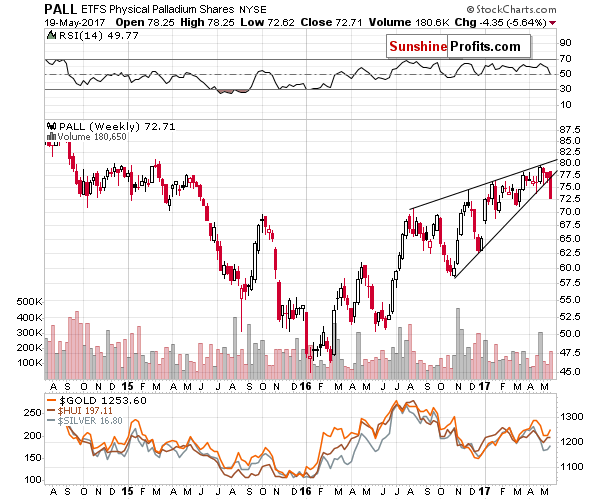
Finally, the breakdown below the rising wedge pattern in the case of palladium is confirmed and the implications are very bearish for the following weeks. Our previous comments on the above remain up-to-date:
Big moves in palladium and big moves in the rest of the precious metals sector tend to take place simultaneously and the breakdown below the big wedge pattern (based on almost a year of price moves) is definitely likely to trigger a major decline. Consequently, the implications for the entire precious metals sector are bearish.
Summing up, the USD Index broke through significant support levels and it could decline some more before turning up again. However, it doesn’t seem that adjusting the positions in the precious metals sector is justified at this time as neither metals nor (in particular) mining stocks want to react to these additional bearish signals and Friday’s session serves as a confirmation. Consequently, it could be the case that additional decline in the USD Index is accompanied by only a tiny move in the precious metals that is followed by a big slide and trying to time this move might backfire. This is especially the case that all: gold, silver and mining stocks moved to their respective resistance levels and verified breakdowns below them. The confirmation of the breakdown in palladium serves as an additional bearish confirmation.
As always, we will keep you – our subscribers – informed.
To summarize:
Trading capital (supplementary part of the portfolio; our opinion): Short positions (150% of the full position) in gold, silver and mining stocks are justified from the risk/reward perspective with the following stop-loss orders and initial target price levels / profit-take orders:
- Gold: exit-profit-take level: $1,063; stop-loss: $1,317; initial target price for the DGLD ETN: $81.88; stop-loss for the DGLD ETN $44.57
- Silver: initial target price: $13.12; stop-loss: $19.22; initial target price for the DSLV ETN: $46.18; stop-loss for the DSLV ETN $17.93
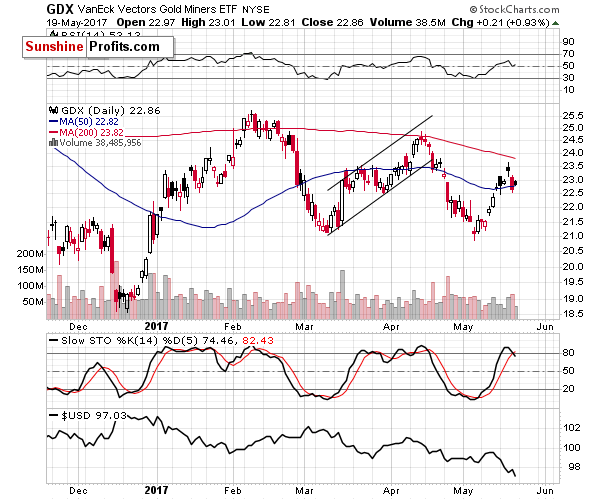
- Mining stocks (price levels for the GDX ETF): initial target price: $9.34; stop-loss: $26.34; initial target price for the DUST ETF: $143.56; stop-loss for the DUST ETF $21.37
In case one wants to bet on junior mining stocks' prices (we do not suggest doing so – we think senior mining stocks are more predictable in the case of short-term trades – if one wants to do it anyway, we provide the details), here are the stop-loss details and initial target prices:
- GDXJ ETF: initial target price: $14.13; stop-loss: $45.31
- JDST ETF: initial target price: $417.04; stop-loss: $43.12
Long-term capital (core part of the portfolio; our opinion): No positions (in other words: cash)
Insurance capital (core part of the portfolio; our opinion): Full position
Please note that the in the trading section we describe the situation for the day that the alert is posted. In other words, it we are writing about a speculative position, it means that it is up-to-date on the day it was posted. We are also featuring the initial target prices, so that you can decide whether keeping a position on a given day is something that is in tune with your approach (some moves are too small for medium-term traders and some might appear too big for day-traders).
Plus, you might want to read why our stop-loss orders are usually relatively far from the current price.
Please note that a full position doesn’t mean using all of the capital for a given trade. You will find details on our thoughts on gold portfolio structuring in the Key Insights section on our website.
As a reminder – “initial target price” means exactly that – an “initial” one, it’s not a price level at which we suggest closing positions. If this becomes the case (like it did in the previous trade) we will refer to these levels as levels of exit orders (exactly as we’ve done previously). Stop-loss levels, however, are naturally not “initial”, but something that, in our opinion, might be entered as an order.
Since it is impossible to synchronize target prices and stop-loss levels for all the ETFs and ETNs with the main markets that we provide these levels for (gold, silver and mining stocks – the GDX ETF), the stop-loss levels and target prices for other ETNs and ETF (among other: UGLD, DGLD, USLV, DSLV, NUGT, DUST, JNUG, JDST) are provided as supplementary, and not as “final”. This means that if a stop-loss or a target level is reached for any of the “additional instruments” (DGLD for instance), but not for the “main instrument” (gold in this case), we will view positions in both gold and DGLD as still open and the stop-loss for DGLD would have to be moved lower. On the other hand, if gold moves to a stop-loss level but DGLD doesn’t, then we will view both positions (in gold and DGLD) as closed. In other words, since it’s not possible to be 100% certain that each related instrument moves to a given level when the underlying instrument does, we can’t provide levels that would be binding. The levels that we do provide are our best estimate of the levels that will correspond to the levels in the underlying assets, but it will be the underlying assets that one will need to focus on regarding the signs pointing to closing a given position or keeping it open. We might adjust the levels in the “additional instruments” without adjusting the levels in the “main instruments”, which will simply mean that we have improved our estimation of these levels, not that we changed our outlook on the markets. We are already working on a tool that would update these levels on a daily basis for the most popular ETFs, ETNs and individual mining stocks.
Our preferred ways to invest in and to trade gold along with the reasoning can be found in the how to buy gold section. Additionally, our preferred ETFs and ETNs can be found in our Gold & Silver ETF Ranking.
As always, we'll keep you - our subscribers - updated should our views on the market change. We will continue to send out Gold & Silver Trading Alerts on each trading day and we will send additional Alerts whenever appropriate.
The trading position presented above is the netted version of positions based on subjective signals (opinion) from your Editor, and the Tools and Indicators.
As a reminder, Gold & Silver Trading Alerts are posted before or on each trading day (we usually post them before the opening bell, but we don't promise doing that each day). If there's anything urgent, we will send you an additional small alert before posting the main one.
=====
Latest Free Trading Alerts:
‘Trump rally’ faded away, while the odds of his impeachment rose. What does it imply for the gold market?
Trump’s Rally, Impeachment and Gold
S&P 500 index gained 0.7% on Friday, as the broad stock market continued its Thursday's rebound off support level. Will the uptrend continue? Is holding short position still justified?
Stock Trading Alert: More Short-Term Fluctuations, As Stocks Retrace Their Recent Decline
=====
Hand-picked precious-metals-related links:
PRECIOUS-Gold prices steady as Trump worries support
Trump Woes May Be a Double-Edged Sword for Gold If Inflation Cools
The end of reflation? Implications for gold
Kansas May Exempt Precious Metals from Sales Tax
Gold Speculators Sharply Cut Their Bullish Net Positions For 3rd Week
Silver Speculators Continue To Pare Back Bullish Net Positions
=====
In other news:
EU Discusses Brexit Position as U.K. Threatens to Quit Talks
Asian stocks post biggest rise in a month as markets settle
North Korea 'confirms warhead guidance' in missile test denounced by U.S.
Exclusive: ECB plan to take euro clearing from London stalled by infighting - sources
British PM May's election lead halves after 'dementia tax': surveys
Pound Falls as Brexit Tensions Rise, Conservative Lead Narrows
=====
Thank you.
Sincerely,
Przemyslaw Radomski, CFA
Founder, Editor-in-chief, Gold & Silver Fund Manager
Gold & Silver Trading Alerts
Forex Trading Alerts
Oil Investment Updates
Oil Trading Alerts

