

Briefly: In our opinion, full (150% of the regular full position) speculative short positions in gold, silver and mining stocks are justified from the risk/reward perspective. This position was originally featured on Jan. 12, 2017 at 3:49PM.
Yesterday’s session was definitely exciting after the rates were increased, but the most important development seems to be hidden behind those that only appear to be very important. Namely, not many traders noticed that the USD Index seems to have completed its short-term correction. Let’s take a look at the charts for details (charts courtesy of http://stockcharts.com).
In yesterday’s alert, we wrote the following:
It appears that the bottom for the USD Index is indeed in, but we would still not be surprised if it declined one final time before turning up (reversing very close to its turning point). As discussed earlier – this could depend on the way the market reacts to the Fed’s comments, but the outlook for the USD Index remains bullish either way.
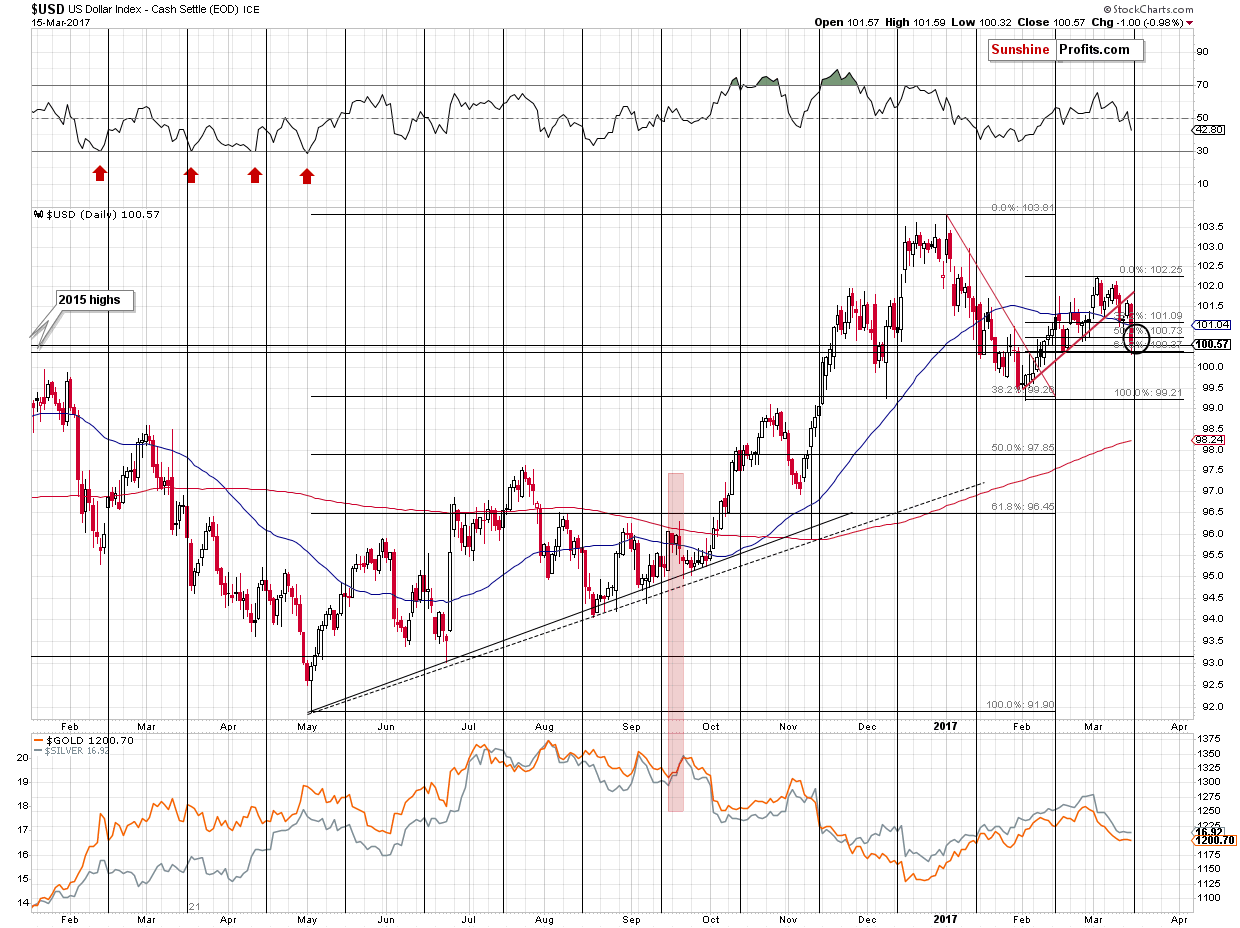
It seems that the USD Index has indeed declined one final time before turning up. Why does it seem that a reversal is so likely here? The USD Index just declined right before the cyclical turning point, which by itself suggests – as its name says – a turnaround. There’s much more to the bullish case than just that, though.
The USD Index reached important support levels in case of both the daily closing price and the intra-day low. The levels that were reached are: the 61.8% Fibonacci retracement level and the 2015 highs (both are very important from the long-term point of view). As if the above wasn’t enough, the USD reached its mid-February low.
There was no breakdown – the support held. This, plus the turning point, plus something even more important makes it very likely that the USD Index will move higher shortly.
The above “more important thing” is that the current decline is a perfect reflection of what happened in early 2003.
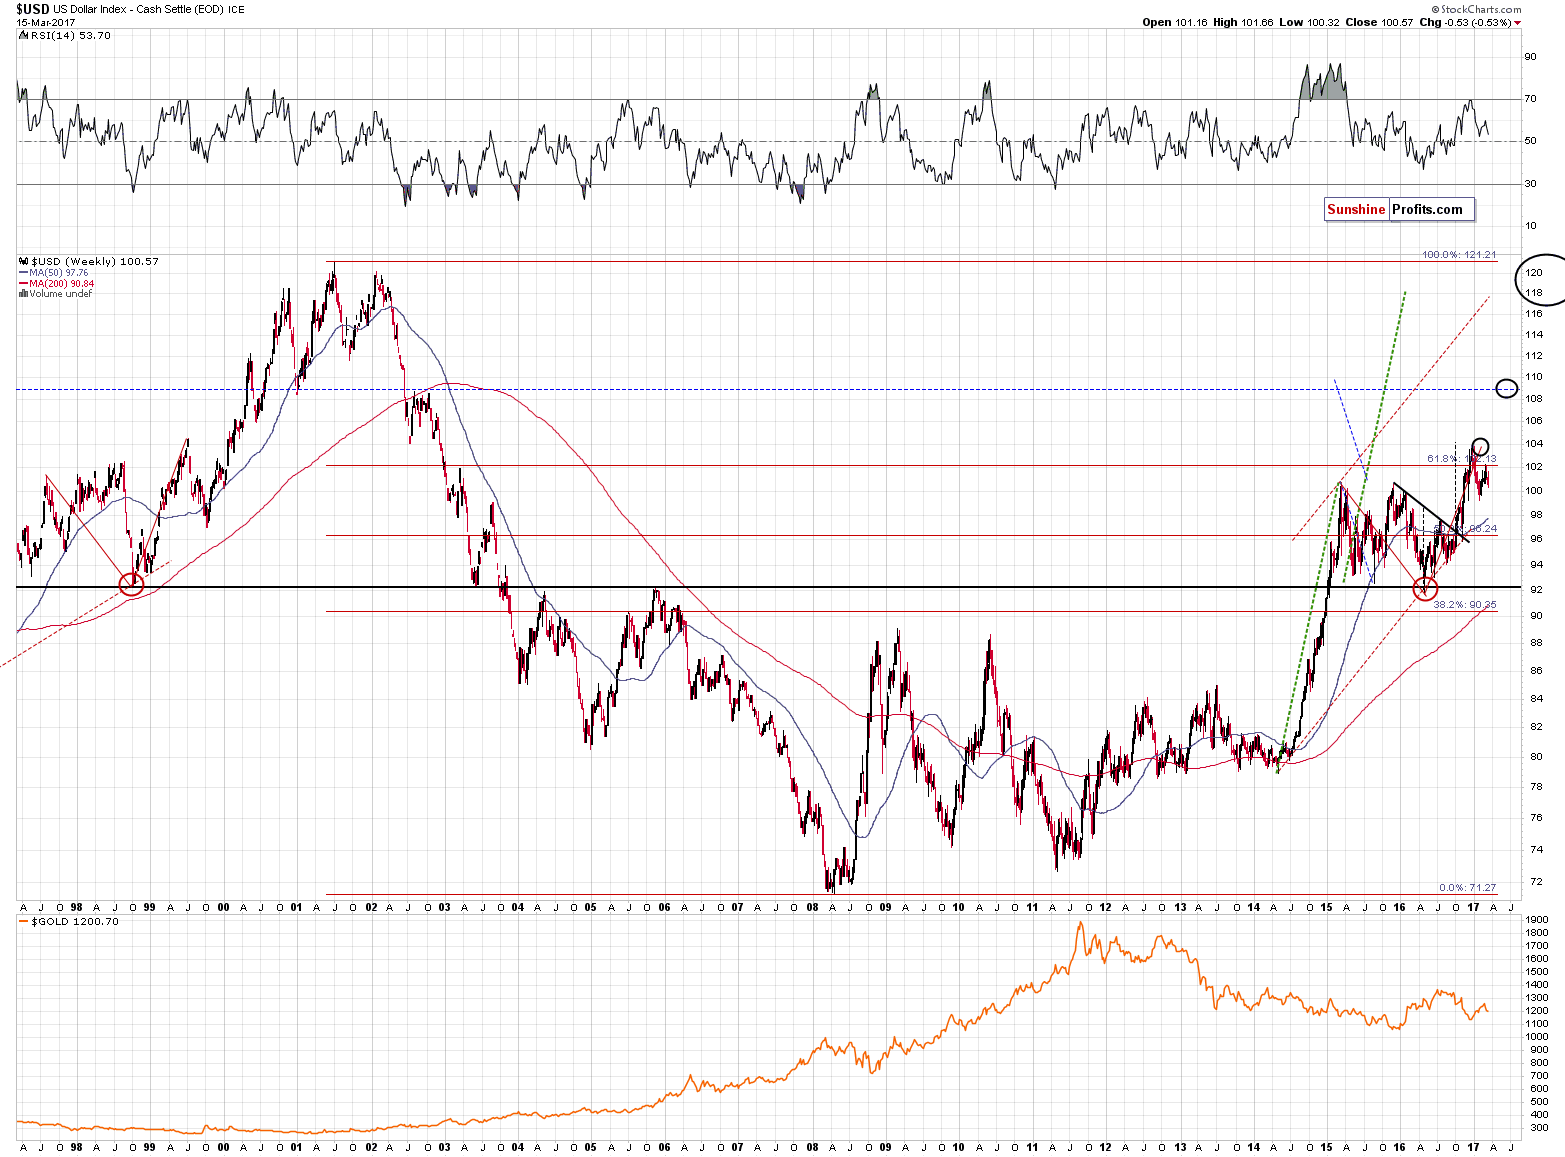
For those who recently subscribed to our alerts, it may be odd to read that something from 2003 can have impact on what’s likely or not today, but that is very likely the case. It’s not visible on the medium- or short-term charts, but the rally that we’ve seen since the 2009 bottom is a reflection of the decline that took the USD to that bottom. The price moves are not identical, but still, the similarity is uncanny.
Based on this analogy, we are right before the period of sharp gains in the USD Index (reflection of the 2002 slide). In particular, the 2003 slide ended with a relatively small correction that was followed by a bigger correction. Now we are after a big correction (January decline) and very likely also after a relatively small correction (March decline). If the analogy continues, we are now likely to see a substantial rally without meaningful corrections until the 108 – 110 area. Even if the history doesn’t repeat itself to the letter, but rhymes instead, we could see another small downswing, but the upswing that is still very likely to follow makes it relatively unimportant.
The above creates a very bearish picture for the precious metals market for the following weeks and months and it’s been confirmed by many long-term signals, for instance by the extremely low volatility in the recent past, extremely high levels of “uncertainty”, a breakout in the Japanese stocks, strong performance of financial stocks, and the sell signals from the weekly Stochastic indicator based on gold and the HUI Index.
Speaking of the HUI Index, let’s put its yesterday move into a bigger perspective.
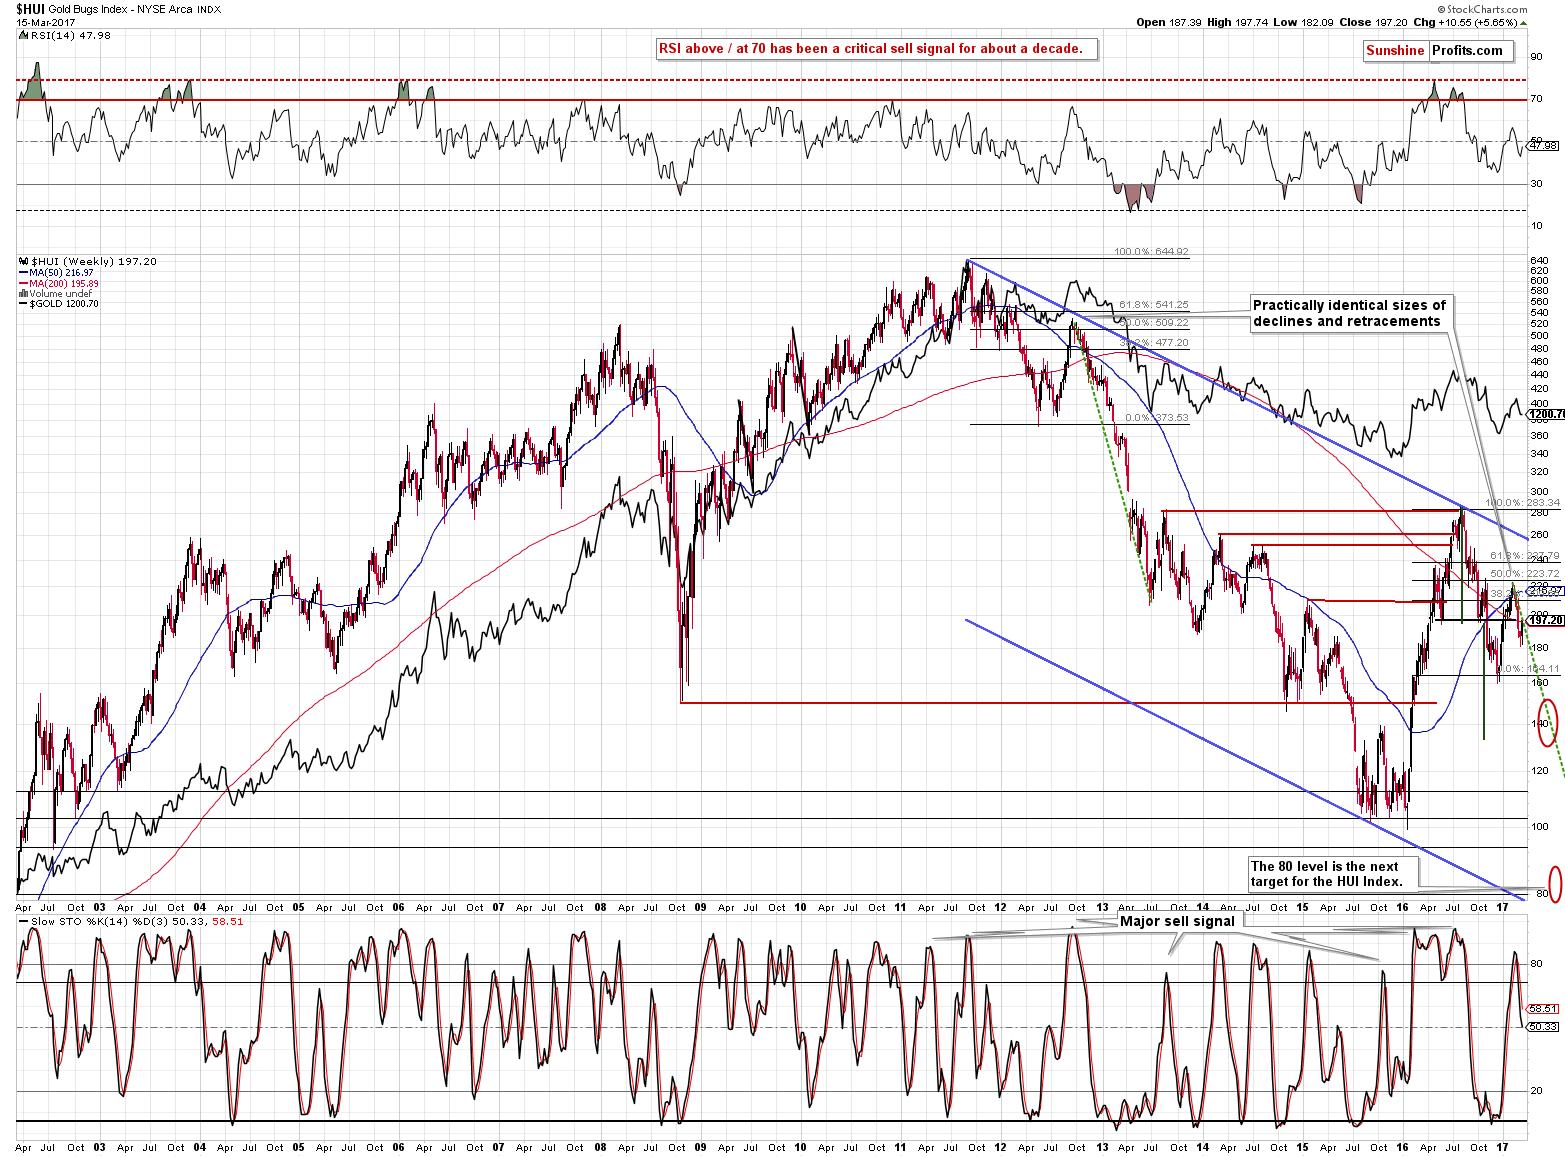
Gold stocks moved higher, but only to the neck level of the previously broken head-and-shoulders formation (in other words, the HUI moved back to the mid-2016 and late-2016 lows without breaking above them) – resistance was reached, not broken.
Was the rally a game-changer by making the decline less visible or was it in tune with the previous declines? The latter is the answer and the green, dashed line shows it. The line is created by copying the 2012 – 2013 decline and applying it to the 2017 top. Based on yesterday’s rally, the current decline is in perfect tune with what we saw in 2012 – not out of it.
Our chart provider didn’t mark yesterday’s rally on the gold and silver charts (showing virtually no move at all), so there’s no point in featuring them in this alert. However, we can say that both metals moved close to their respective 50-day moving averages (gold a bit above it, silver a little below it), possibly verifying the breakdowns below them. Gold closed a few dollars back above it, but since the session was so nervous in its final hours, it doesn’t seem that we should trust a small breakout without a confirmation.
Moreover, please note that the way metals and miners started yesterday’s upswing is suspicious to say the least. They rallied after the interest rate hike but before any additional comments. Since the rate hike was widely expected, no significant action was really justified – markets were not surprised – at least not at that time. Consequently, the rally might have been triggered somewhat artificially in order to take other traders aboard (and trigger nearby stop loss orders in the case of short positions), but in reality to enable others to enter short positions at better prices (at the expense of those who were forced out of their positions). Was this really the case? There is no proof, but the timing of the rally makes it quite likely.
Summing up, the most important development of yesterday’s session wasn’t about gold or silver and not even about mining stocks, but about the USD Index, which seems to have completed a very important corrective pattern. “Very important” because we have likely just seen the final correction before a huge upswing. The implications thereof for the precious metals market are very bearish for the following weeks.
As always, we will keep you – our subscribers – informed.
To summarize:
Trading capital (supplementary part of the portfolio; our opinion): Short positions (150% of the full position) in gold, silver and mining stocks are justified from the risk/reward perspective with the following stop-loss orders and initial target price levels / profit-take orders:
- Gold: exit-profit-take level: $1,063; stop-loss: $1,273; initial target price for the DGLD ETN: $81.88; stop-loss for the DGLD ETN $48.17
- Silver: initial target price: $13.12; stop-loss: $18.67; initial target price for the DSLV ETN: $46.18; stop-loss for the DSLV ETN $19.87
- Mining stocks (price levels for the GDX ETF): initial target price: $9.34; stop-loss: $26.34; initial target price for the DUST ETF: $143.56; stop-loss for the DUST ETF $21.37
In case one wants to bet on junior mining stocks' prices (we do not suggest doing so – we think senior mining stocks are more predictable in the case of short-term trades – if one wants to do it anyway, we provide the details), here are the stop-loss details and initial target prices:
- GDXJ ETF: initial target price: $14.13; stop-loss: $45.31
- JDST ETF: initial target price: $104.26; stop-loss: $10.78
Long-term capital (core part of the portfolio; our opinion): No positions (in other words: cash)
Insurance capital (core part of the portfolio; our opinion): Full position
Please note that the in the trading section we describe the situation for the day that the alert is posted. In other words, it we are writing about a speculative position, it means that it is up-to-date on the day it was posted. We are also featuring the initial target prices, so that you can decide whether keeping a position on a given day is something that is in tune with your approach (some moves are too small for medium-term traders and some might appear too big for day-traders).
Plus, you might want to read why our stop-loss orders are usually relatively far from the current price.
Please note that a full position doesn’t mean using all of the capital for a given trade. You will find details on our thoughts on gold portfolio structuring in the Key Insights section on our website.
As a reminder – “initial target price” means exactly that – an “initial” one, it’s not a price level at which we suggest closing positions. If this becomes the case (like it did in the previous trade) we will refer to these levels as levels of exit orders (exactly as we’ve done previously). Stop-loss levels, however, are naturally not “initial”, but something that, in our opinion, might be entered as an order.
Since it is impossible to synchronize target prices and stop-loss levels for all the ETFs and ETNs with the main markets that we provide these levels for (gold, silver and mining stocks – the GDX ETF), the stop-loss levels and target prices for other ETNs and ETF (among other: UGLD, DGLD, USLV, DSLV, NUGT, DUST, JNUG, JDST) are provided as supplementary, and not as “final”. This means that if a stop-loss or a target level is reached for any of the “additional instruments” (DGLD for instance), but not for the “main instrument” (gold in this case), we will view positions in both gold and DGLD as still open and the stop-loss for DGLD would have to be moved lower. On the other hand, if gold moves to a stop-loss level but DGLD doesn’t, then we will view both positions (in gold and DGLD) as closed. In other words, since it’s not possible to be 100% certain that each related instrument moves to a given level when the underlying instrument does, we can’t provide levels that would be binding. The levels that we do provide are our best estimate of the levels that will correspond to the levels in the underlying assets, but it will be the underlying assets that one will need to focus on regarding the signs pointing to closing a given position or keeping it open. We might adjust the levels in the “additional instruments” without adjusting the levels in the “main instruments”, which will simply mean that we have improved our estimation of these levels, not that we changed our outlook on the markets. We are already working on a tool that would update these levels on a daily basis for the most popular ETFs, ETNs and individual mining stocks.
Our preferred ways to invest in and to trade gold along with the reasoning can be found in the how to buy gold section. Additionally, our preferred ETFs and ETNs can be found in our Gold & Silver ETF Ranking.
As always, we'll keep you - our subscribers - updated should our views on the market change. We will continue to send out Gold & Silver Trading Alerts on each trading day and we will send additional Alerts whenever appropriate.
The trading position presented above is the netted version of positions based on subjective signals (opinion) from your Editor, and the Tools and Indicators.
As a reminder, Gold & Silver Trading Alerts are posted before or on each trading day (we usually post them before the opening bell, but we don't promise doing that each day). If there's anything urgent, we will send you an additional small alert before posting the main one.
=====
Latest Free Trading Alerts:
The Fed hiked its interest rates for the third time during the current tightening cycle. What does it mean for the gold market?
S&P 500 index gained 0.8% on Wednesday, as investors reacted to Fed's interest rate hike announcement. Will stocks break above their early March record high? Is holding short position still justified?
Stock Trading Alert: Stocks Get Close To Record High Again As Fed Hikes Interest Rates
=====
Hand-picked precious-metals-related links:
Gold Seen Climbing as Yellen Sets Scene for Negative Rates
Exclusive: London gold rush - ICE to launch clearing before banks are ready
=====
In other news:
The Lone Dissenter From the Fed’s Rate Move Is Worried About Inequality
The Fed Gave Itself a Safety Net
These Markets Are Really Moving After the Fed Interest Rate Hike
Bill Gross: This could cause 'hell' to break loose in the global bond market
Fed's Yellen Says March Rate Rise Shouldn't Have Been a Surprise
Trump Proposes Historic Cuts Across Government to Fund Defense
Dutch PM Rutte fends off far-right's Wilders
=====
Thank you.
Sincerely,
Przemyslaw Radomski, CFA
Founder, Editor-in-chief, Gold & Silver Fund Manager
Gold & Silver Trading Alerts
Forex Trading Alerts
Oil Investment Updates
Oil Trading Alerts

